Have a spreadsheet full of addresses or coordinates and wondering how to plot them on a map? Geocoding Excel data into an interactive map can transform raw location information into valuable insights. Whether for business analysis, logistics, or research, mapping your Excel data helps visualize trends and make data-driven decisions. This guide will walk you through the process of geocoding Excel data and turning it into an interactive map using simple and effective steps.
What is Geocoding?
Geocoding is the process of converting addresses or place names into geographic coordinates (latitude and longitude). Once you have this data, you can overlay it on a map for better visualization.
Steps to Geocode Excel Data and Map It
1. Prepare Your Excel Data
Ensure your spreadsheet includes key location data in separate columns, such as:
- Address (Street, City, State, Country)
- Latitude & Longitude (if available)
- Additional details like category, name, or description
Make sure the data is clean, free from duplicates, and formatted correctly to avoid errors during mapping.
2. Import Your Data into a Mapping Platform
Once you have latitude and longitude, you need a mapping tool to visualize the data. MAPOG is an excellent platform where you can easily upload your geocoded Excel file and create interactive maps.
How MAPOG Can Help:
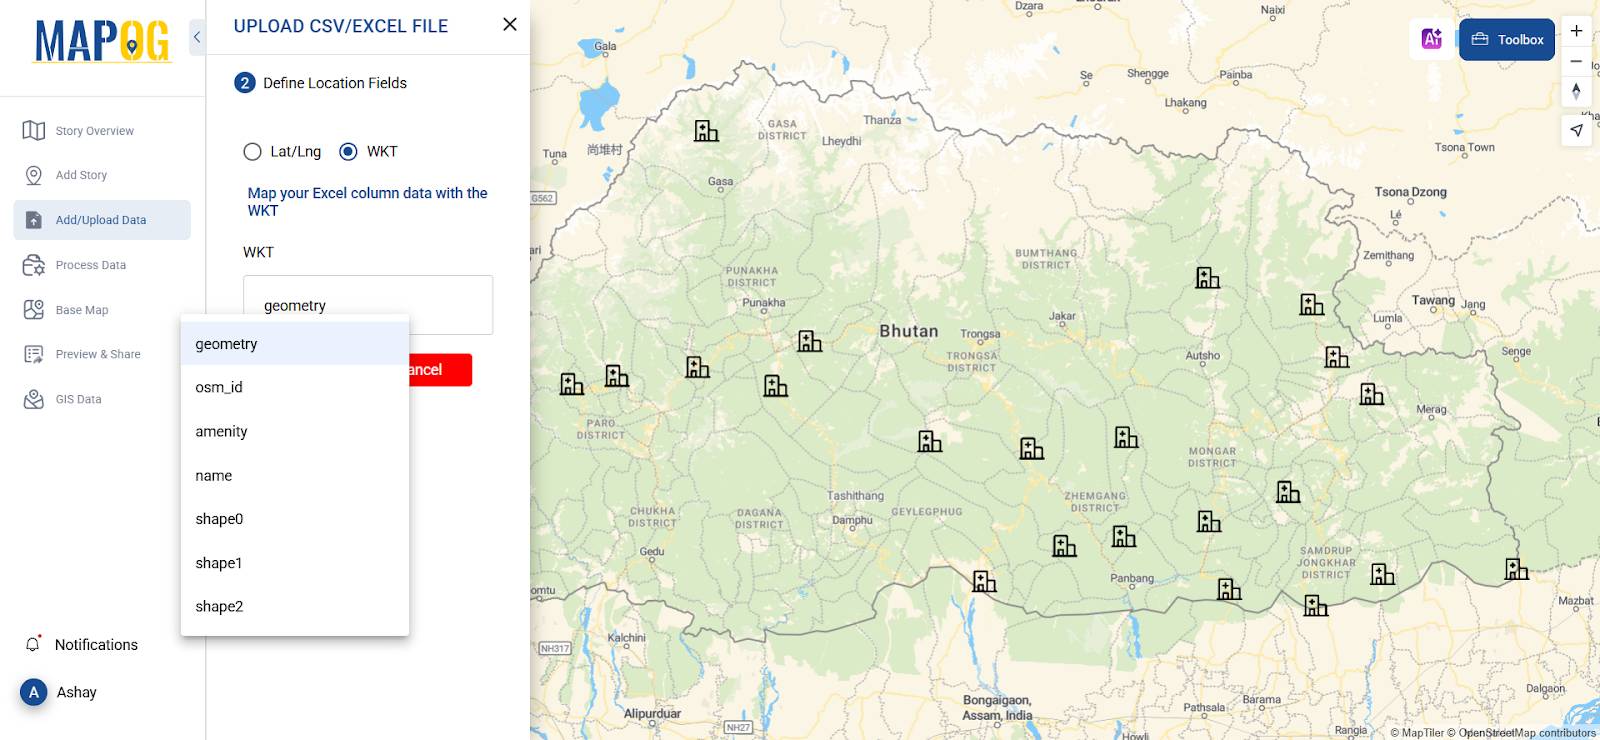
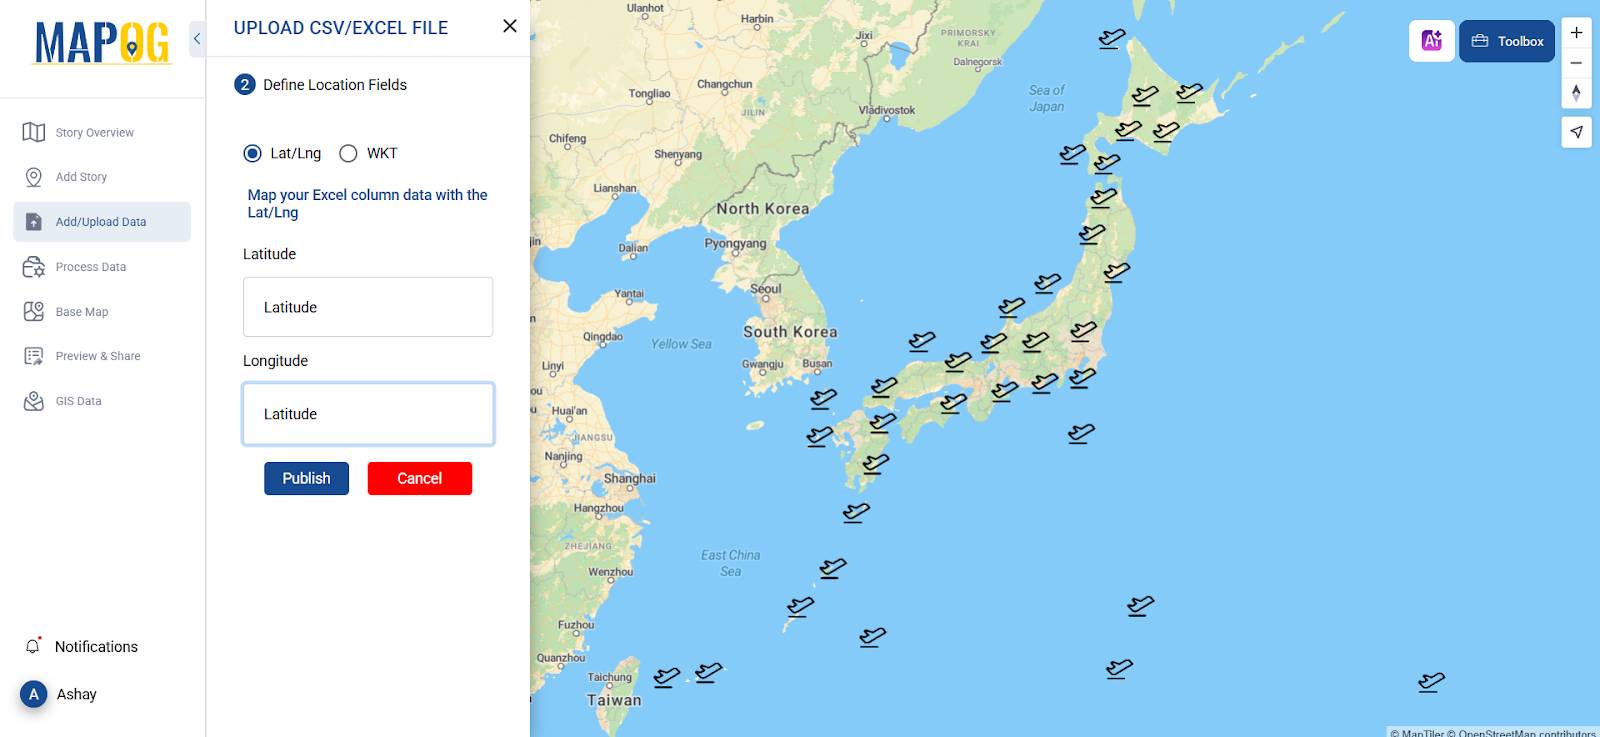
- Allows easy upload of CSV, XLSX, XLS, ODS files containing geocoded data using UPLOAD CSV/EXCEL FILE.
- For file upload various methods are available such as latitude, Longitude and WKT method.
- Supports adding markers, categories, and feature attributes
- Provides customizable map styles, including satellite and street views
- Enables storytelling through interactive layers
3. Customize Your Map
After importing your data, enhance the map with:
- Custom Icons & Colors: Differentiate locations with unique markers
- Labels & Descriptions: Add informative pop-ups
- Layers & Filters: Toggle between different categories
4. Share & Analyze
Once your map is ready, you can:
- Embed it on your website
- Share a public or private link with your team
- Use it for presentations, business analysis, or reports
Example Use Cases
- Retail Businesses: Visualizing store locations and customer distribution
- Real Estate: Mapping available properties by location
- Logistics & Delivery: Optimizing routes for efficiency
- Tourism: Showcasing tourist attractions with descriptions
Conclusion
Geocoding Excel data into a map is an easy yet powerful way to bring location-based insights to life. With platforms like MAPOG, you can transform raw data into visually engaging, interactive maps with just a few clicks. Try it today and explore how mapping can enhance your workflow!