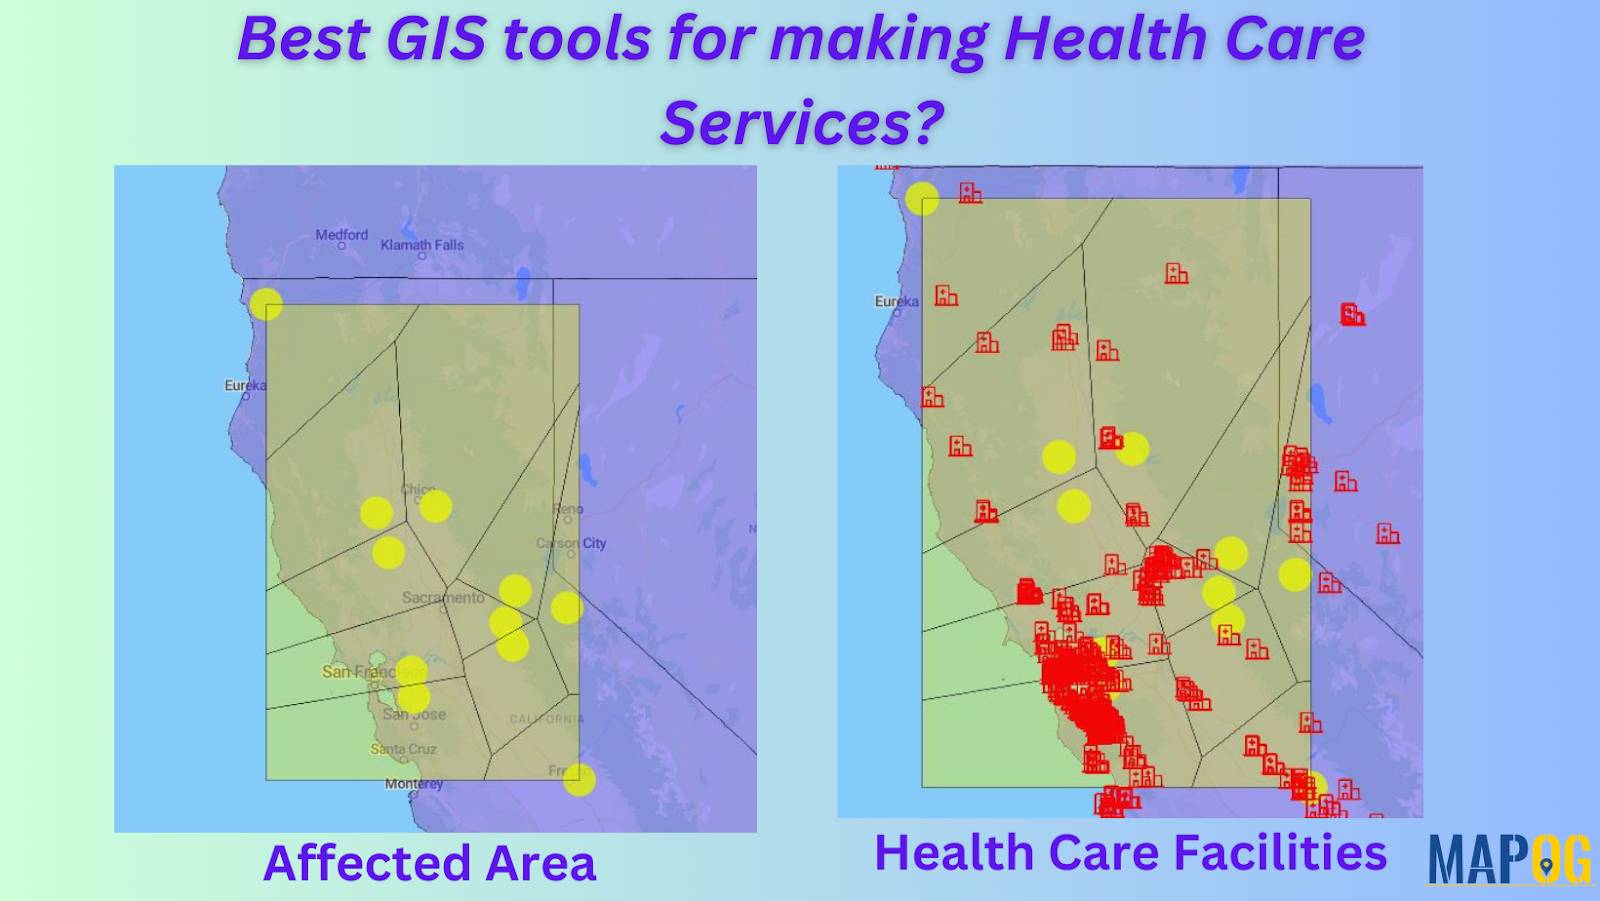
Geographic Information System is an emerging field that combines spatial analysis, statistical modeling and data visualization. We can create maps by pinpointing the location of disease outbreak by using a “point to polygon tool” and help us lineate the affected area smoothly and effortlessly.
Key concept
Analysis of disease affected areas by using point to polygon tool and use geocoding and location analysis that area build-in layers of hospital buildings, clinics.
Here is how we can make Disease map in MAPOG here are the steps to create such maps :
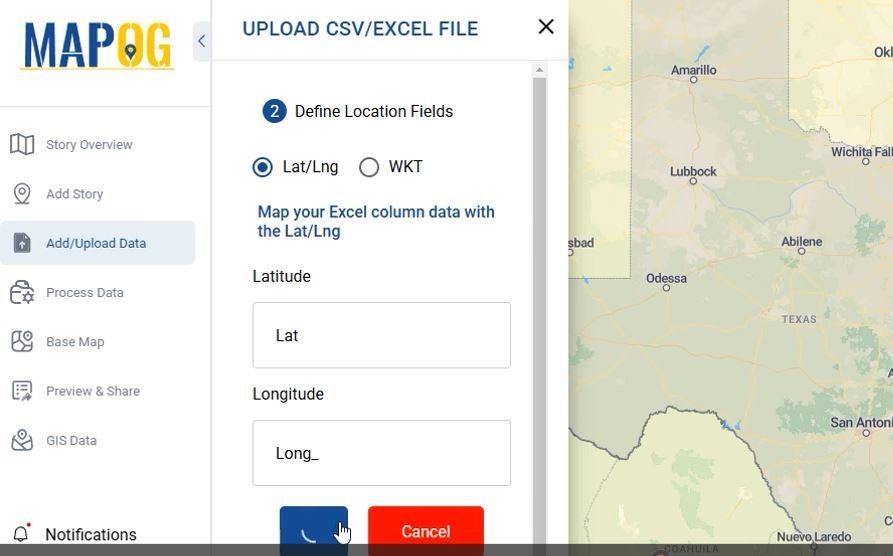
STEP 1: Upload Data –
- MAPOG supports formats in Excel/ CSV, Vector data and WMS.
- Upload Latitude and Longitude and the data will appear on the map
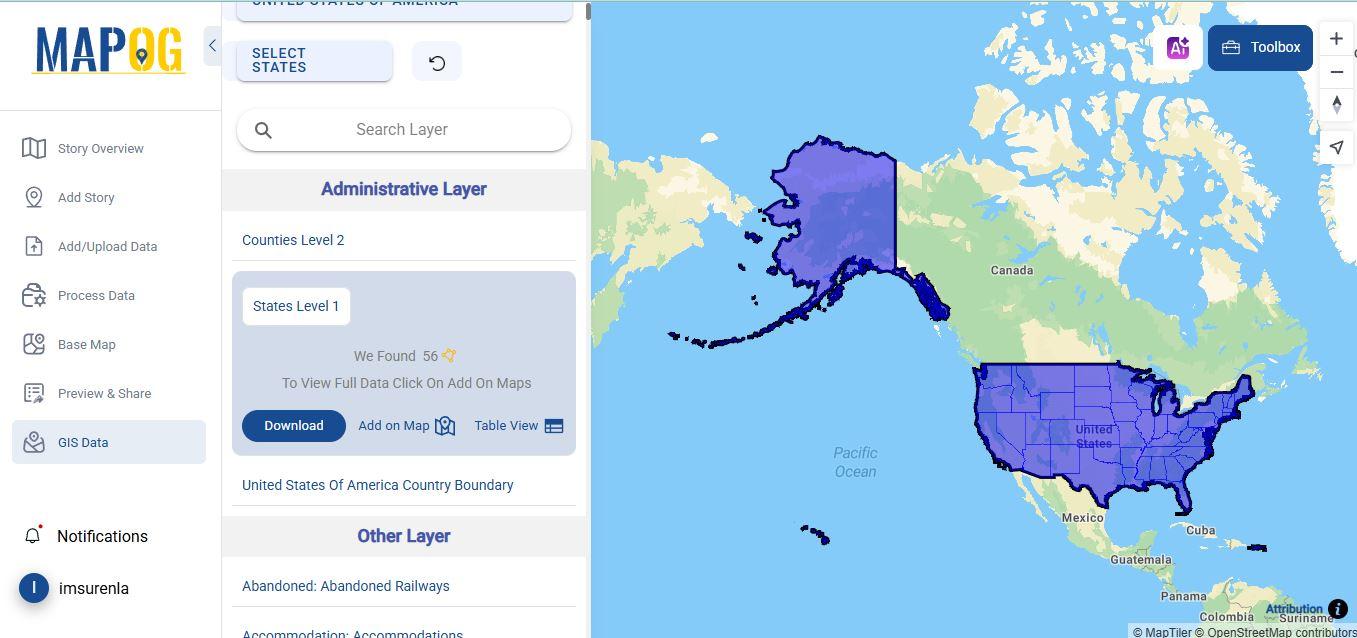
STEP 2 : Add GIS Data –
- Click on GIS Data to download administrative layer and other layer,
- Select a country, state, district, or sub-district—then choose to download the shapefile (SHP) or add it directly to your map.”
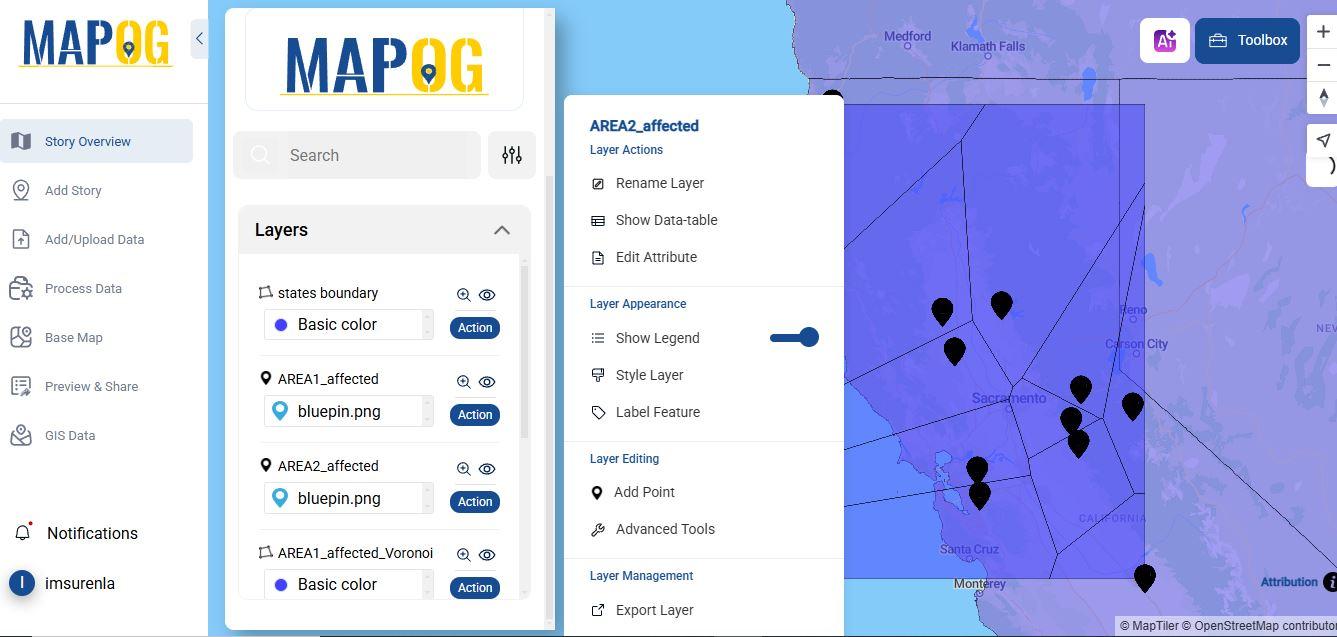
STEP 3: Customize the Layer –
Go to the ‘action’ button of the recently uploaded data and select the “Style Editor” option and edit the color and style with proper weight, icons, size and color and save edits.
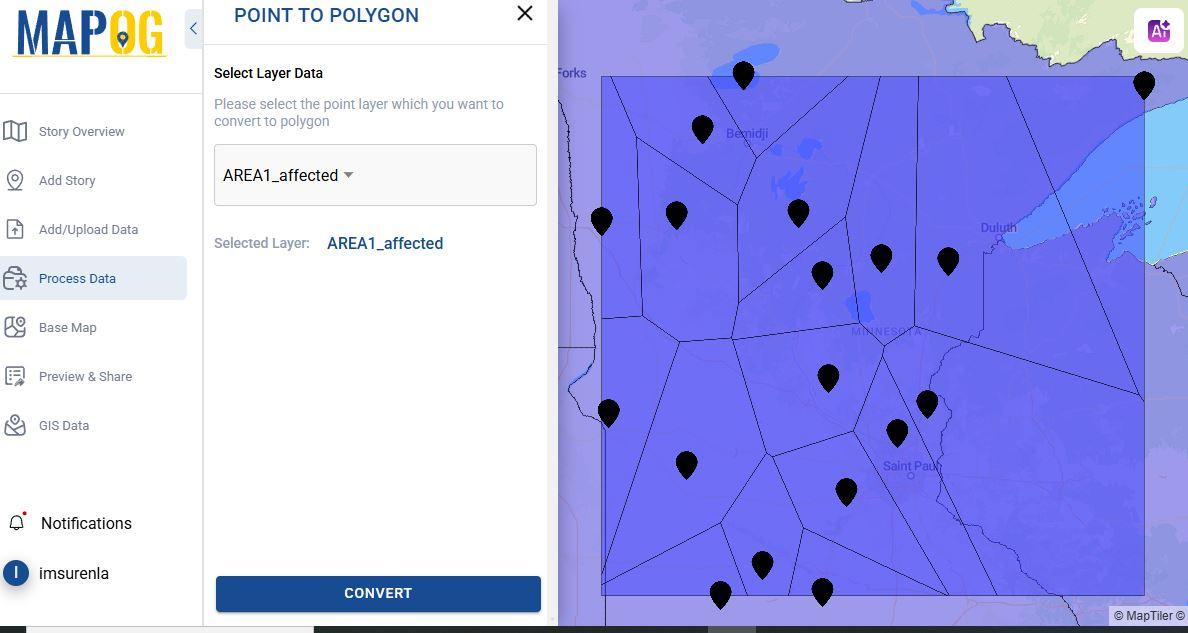
STEP 4 : Convert Point to Polygon –
a) Click “Processing Data” select the point layer and Convert.
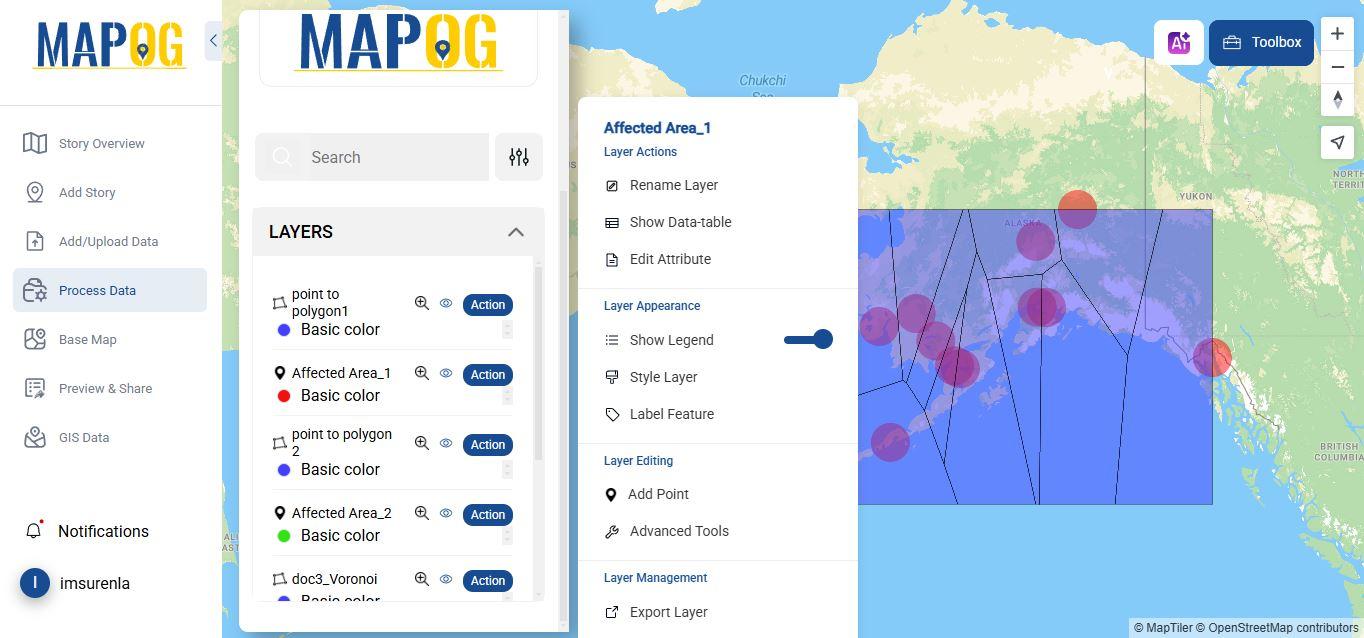
STEP 5 : Customize the Polygon layer –
- Go to the ‘action’ button and rename the layer and save it.
- Select “Style Editor” option for personalize the color, border color, border weight, opacity and click save style.
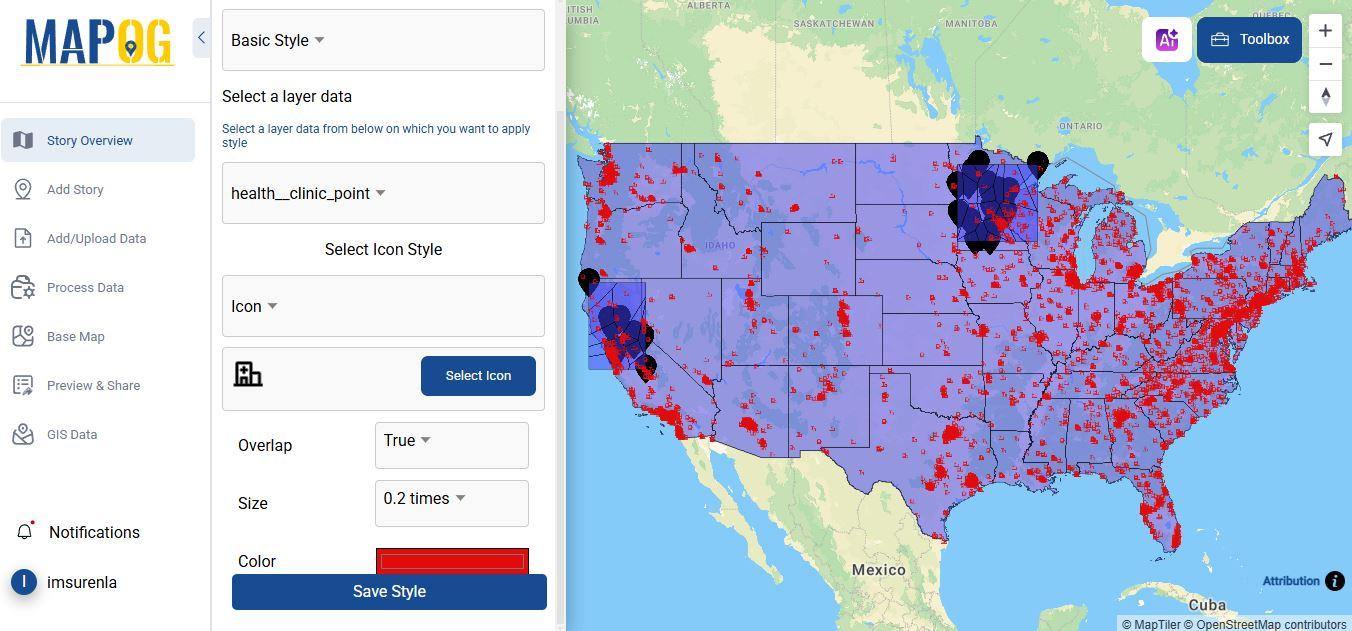
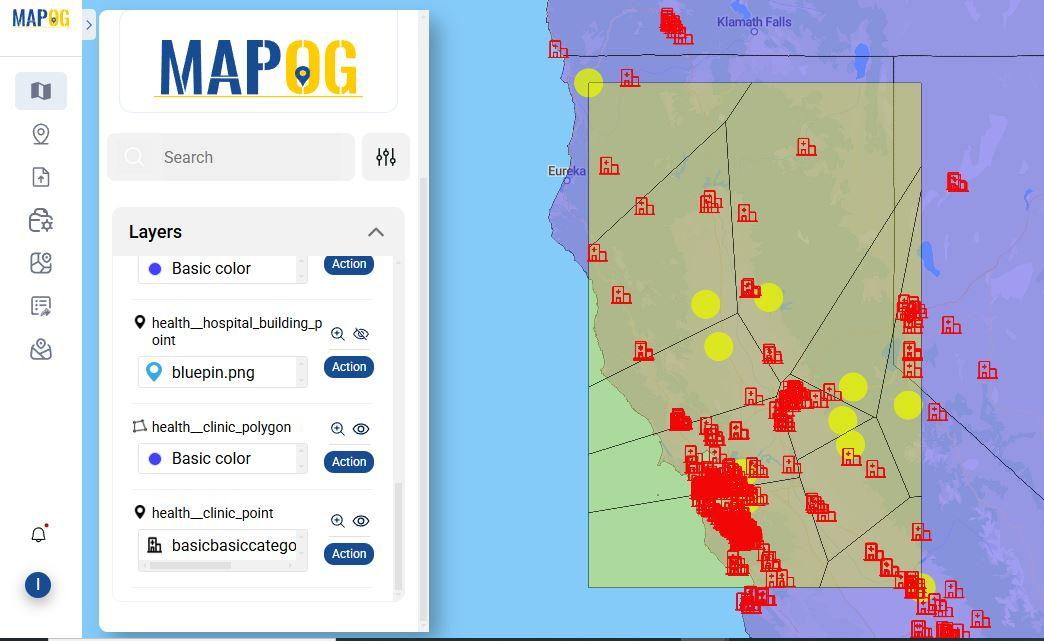
STEP 6 : Add Clinic Hospital –
- Add a layer for clinic hospital, select GIS Data, select the layer health:clinic and click “Add on map”.
STEP 7 : Share map –
- After editing this website lets you share your map with public and private and can share the links for people to access to your map from preview and share.
Major Findings
Analyzing healthcare accessibility in rural areas, to track disease spreading zones to targeting deployment of vaccines to the urgent locations. MAPOG is an online platform that improves imposing quarantines, restricting movement or campaigns for vaccination. You can refer to other articles on:
Best GIS Tools for Healthcare Analysis: Enhancing Accessibility & Resource Allocation
Creating Point Data for Urban Planning: Digitizing Settlement Features & Infrastructure Mapping
How to Use Convex Hull for Contagious Disease Mapping & Outbreak Control
Industries and Domains
- Surveillance outbreak by tracking infectious disease in real time, it covers gaps and prioritizes underserved regions, ensures risk management in advance by authorities, academic research of disease patterns, establishes pharmaceutical clinics.
- Identify disparities in healthcare access or disease burden across demographics. Monetize public transit routes as vectors for infectious disease transmission.
Conclusion
The purpose of mapping a disease affecting areas is to identify hotspots and to visualize clusters area and prioritize high-risk zones. By using buffer analysis it can help predict the proximity of the affected area. Disease mapping using point-to-polygon conversion in GIS is a powerful approach to visualize and analyze health data effectively. By transforming discrete point data into meaningful polygons, we can identify disease hotspots, assess spatial patterns, and allocate resources more efficiently. This method not only enhances our understanding of disease distribution but also supports targeted interventions and informed decision-making for public health authorities.
Why use MAPOG?
MAPOG a free online GIS platform streamlines spatial analysis through its robust suite of GIS tools, including Heat Maps, Isochrones, Point to Polygon conversion, and Proximity Analysis. This GIS powered platform enables instant map generation, empowering users to make data-driven decisions efficiently. Ultimately, MAPOG bridges the gap between raw data and strategic action, ensuring every map drives meaningful outcomes.
Final Thoughts
If you’re new to GIS mapping or a professional, MAPOG combines user-friendly design with advanced capabilities. It transforms raw data into actionable insights, crafts precision maps, empowers informed decisions, and visualizes solutions with unmatched clarity—explore MAPOG today!