GIS plays a vital role in irrigation planning and water resource management by optimising site selection, assessing water demand, designing irrigation networks, and analysing crop suitability. Additionally, it enhances decision-making through spatial analysis, monitors water distribution, prevents water logging, and integrates data for sustainable and efficient water resource utilisation.
Key Concept in Monitoring GIS in Irrigation Planning Using Water Resource Management
Key concepts in monitoring GIS in Irrigation Planning using water resource management include data integration, remote sensing, GIS mapping, How to Map and Address Flood Risks Along Rivers, Extracting Drainage Networks, and climate variability assessment. These ensure efficient water distribution, prevent overuse, optimize irrigation scheduling, and support sustainable agricultural and environmental management.
Use of GIS in Irrigation Planning Using Water Resource Management
Creating a flood map in MAPOG is quick and simple. By following a few buffer analysis steps, you can generate accurate visualisations:
1. Select Your Information from MAPOG
- First, gather all the necessary data from the MAPOG website itself.
- This may include the Country Boundary file, River data and the Vegetation data.
- You may also use Existing Data Sources such as environmental reports or government databases or the data in the MAPOG website itself.
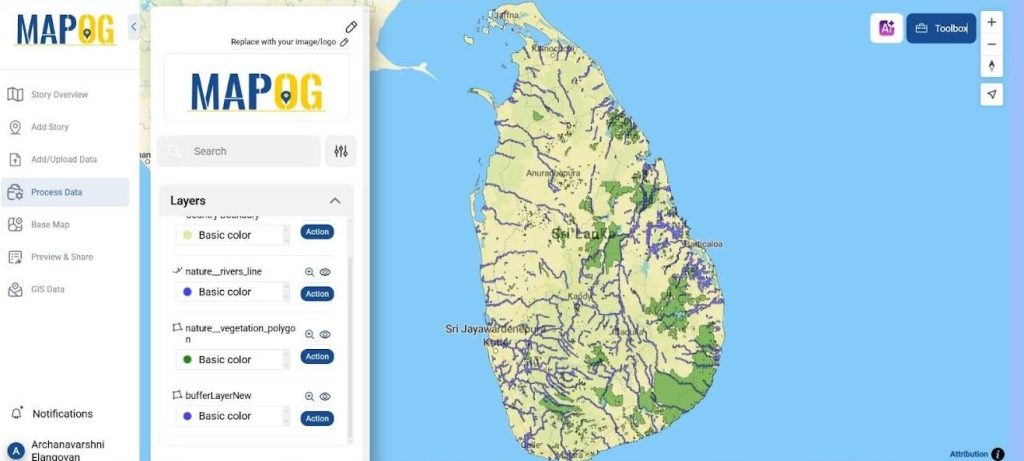
2. Upload Your Information
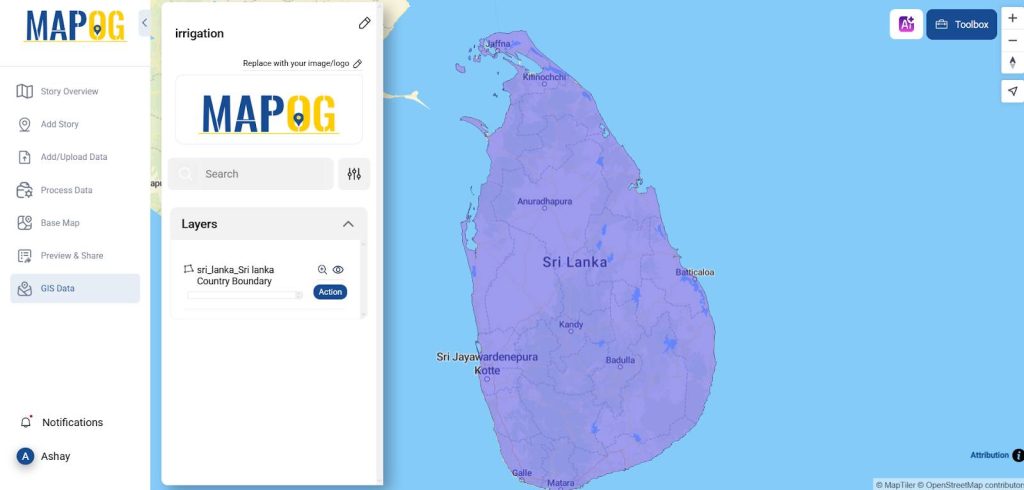
- You can input your data from the MAPOG website itself. To add the Boundary layer, GIS Data >> Select the Country >> The Boundary layer.
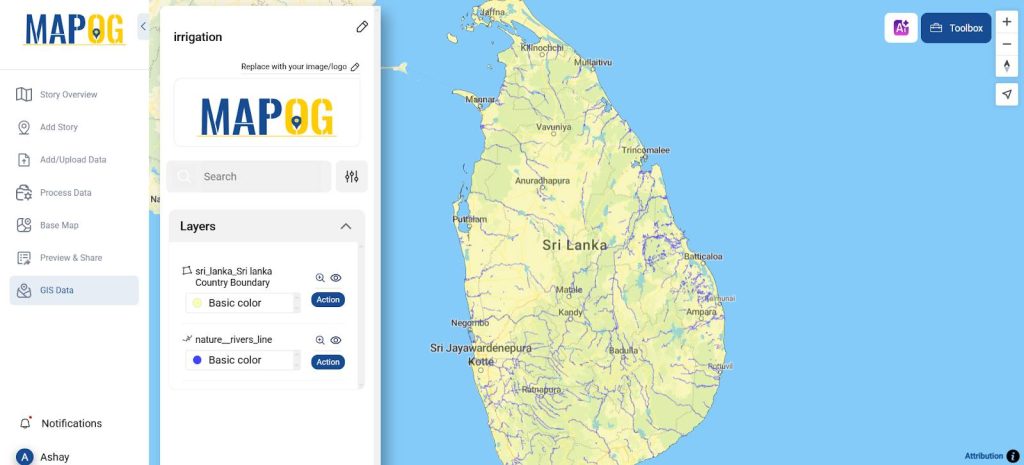
- Add the river files also from the GIS data >> Select the country >> The River Layer.
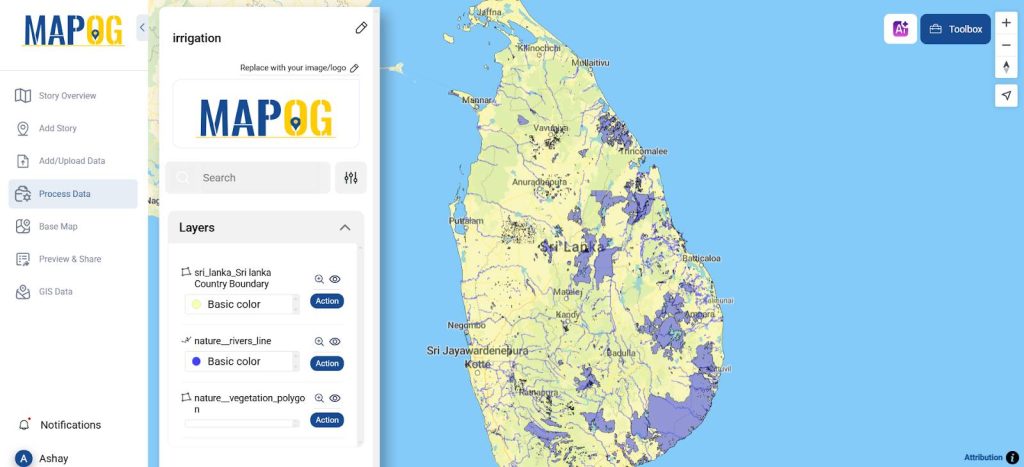
- Add the Vegetation layer from the GIS data >> Select the country >> The Vegetation layer.
3. Buffer Analysis
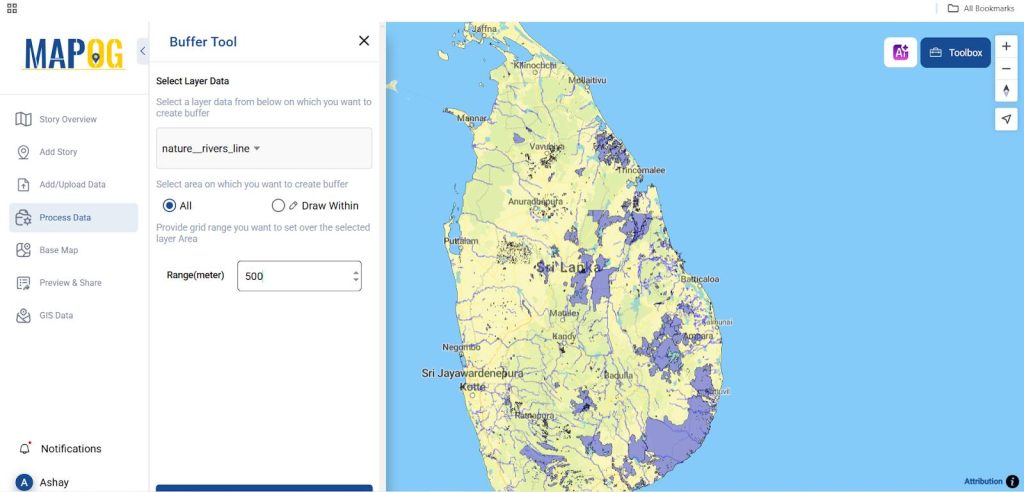
- Select the river line layer to which Buffer should be applied and give its range for the country we are mapping.
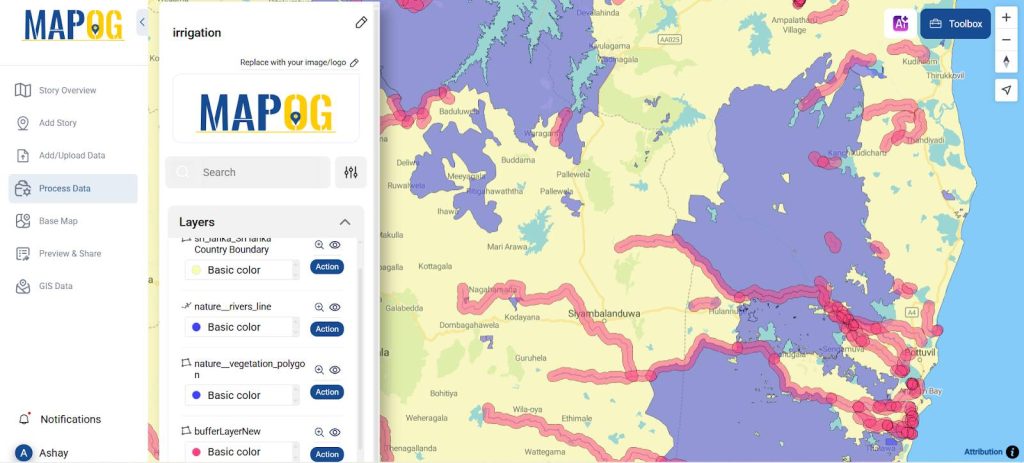
- Choose the attribute to which the buffer should be applied and set the buffer range to 500 meters.
4. Spatially Join the Layer
- We simply need to use a Merge Polygon to spatially combine the buffer layers that are formed, which are overlapped rather than spatially united.
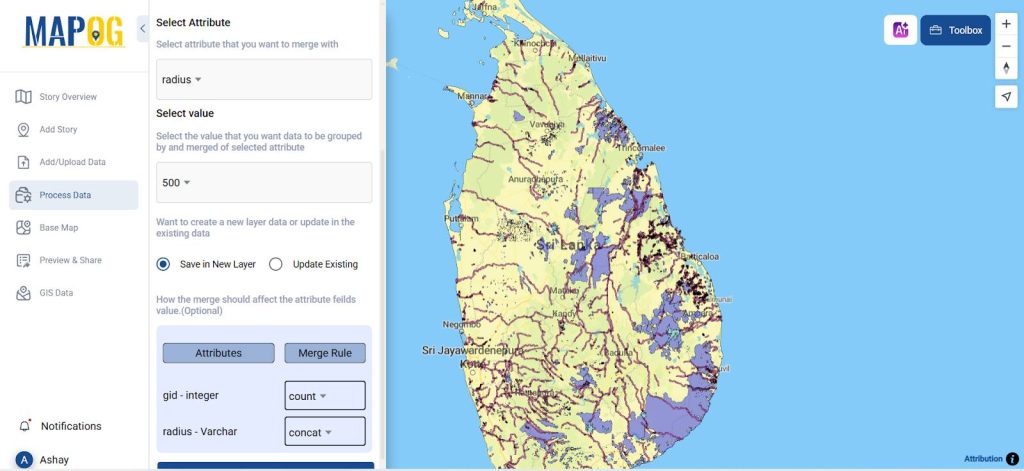
- In merge layer give the buffer layer as the input layer. In which select the attribute as radius and give the value to be 500 since the radius in 500 meters. To merge attributes, give the integer as count and Varchar as concat.
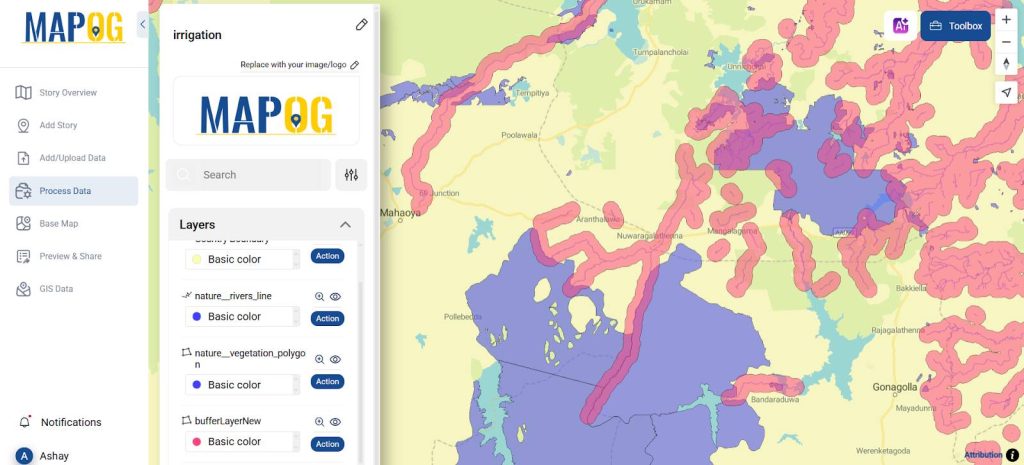
5. Analyze and Disseminate
After building your map, analyze the visualization. You can then share the map with your audience or stakeholders to raise awareness or guide decision-making. It is related to help in: Protecting Managing water distribution efficiently, designing irrigation networks, and analyzing crop.
Major Findings in Flood Mapping
Flood mapping with buffer analysis identifies flood-prone zones, optimizes irrigation planning, enhances disaster preparedness, designing irrigation networks, and analyzing crop and prevents losses, and promotes sustainable farming by minimizing soil erosion, improving drainage, and ensuring resilient infrastructure.
Industry and Domain
- Agriculture, water resource management, disaster management, civil engineering, environmental conservation, and policymaking uses flood maps for irrigation planning.
- It helps in flood risk assessment, smart irrigation, infrastructure planning, sustainable land use, early warning systems, soil erosion prevention, drainage optimization, and climate adaptation for effective water and disaster management.
GIS data Used
Conclusion
Flood mapping using buffer analysis enhances irrigation planning by preventing infrastructure damage, improving water distribution, and ensuring agricultural sustainability. By integrating GIS and hydrological data, stakeholders can make informed decisions and optimize water resource management effectively.
Explore Other Blogs
- How to Use Convex Hull for Contagious Disease Mapping & Outbreak Control.
- Isochrone Analysis in GIS: Optimize Travel Times for Faster Delivery & Urban Planning.
- Creating Point Data for Urban Planning: Digitizing Settlement Features & Infrastructure Mapping.
Final thoughts
Since MAPOG makes it easy to create monitoring maps, anyone—individuals, educators, or organizations—can utilize it to exchange knowledge on water resources and irrigation planning. Have you ever attempted to create a Flood Map ? If so, what was your experience like? It’s a fantastic way to engage with your audience and visually explore data.