GIS is crucial in agriculture for soil mapping and crop monitoring, enabling informed decisions to improve yield, optimize land use, and ensure sustainable farming. It helps identify soil types, track crop density, and enhance precision farming by processing and visualizing soil and crop data.
Key Concepts in GIS for Soil Mapping and Crop Monitoring
GIS aids in soil mapping and crop monitoring by analyzing soil properties, fertility, and moisture levels, enabling farmers and researchers to visualize patterns, track changes, optimize land use, and improve crop health. MAPOG provides essential tools to integrate datasets efficiently. In this guide, we’ll explore how GIS can be used to map soil types and monitor crops effectively.
Steps to Use GIS for Soil Mapping and Crop Monitoring
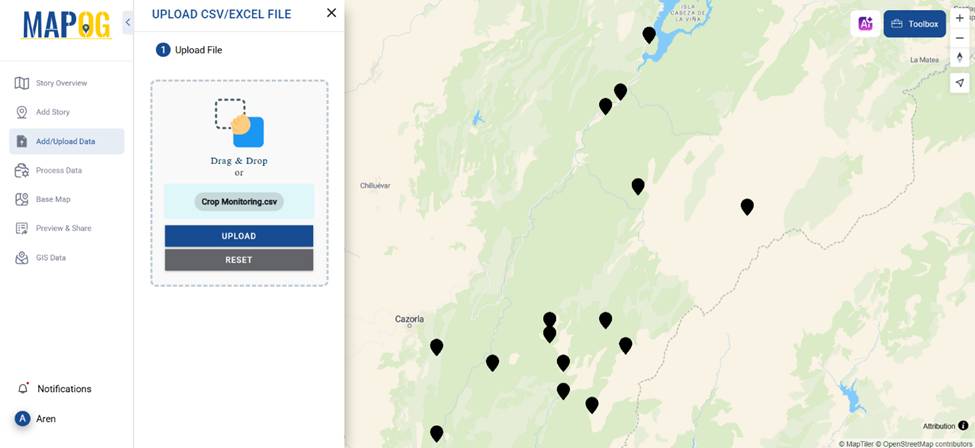
1. Upload Soil and Crop Data
The first step in GIS-based soil mapping is to gather data. This often comes in CSV or Excel format containing details such as soil type, crop density, moisture levels, and fertility indexes. With MAPOG’s Upload CSV/Excel File, you can quickly upload datasets and begin processing them within the platform.
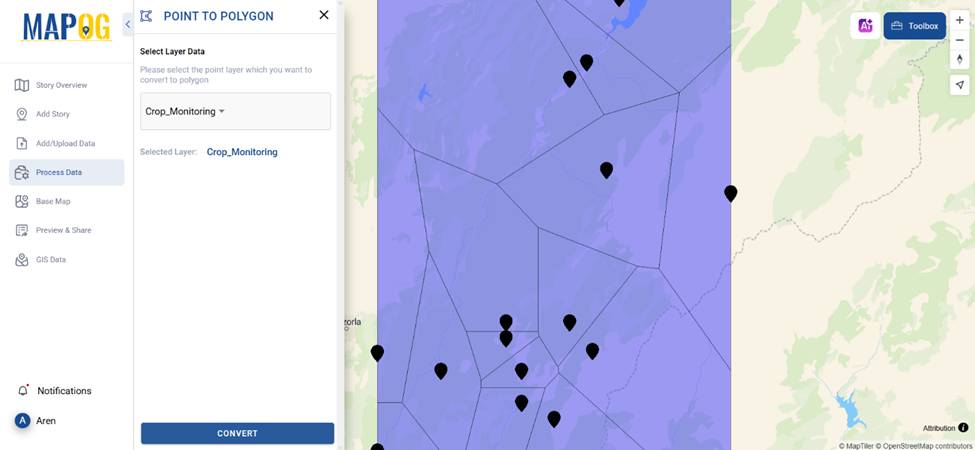
2. Convert Point Data to Polygon Data
Since soil and crop data are often represented as individual points, using the “Point to Polygon“ tool from process data helps transform scattered data into structured regions. This makes it easier to analyze soil distribution patterns and visualize data in an intuitive manner.
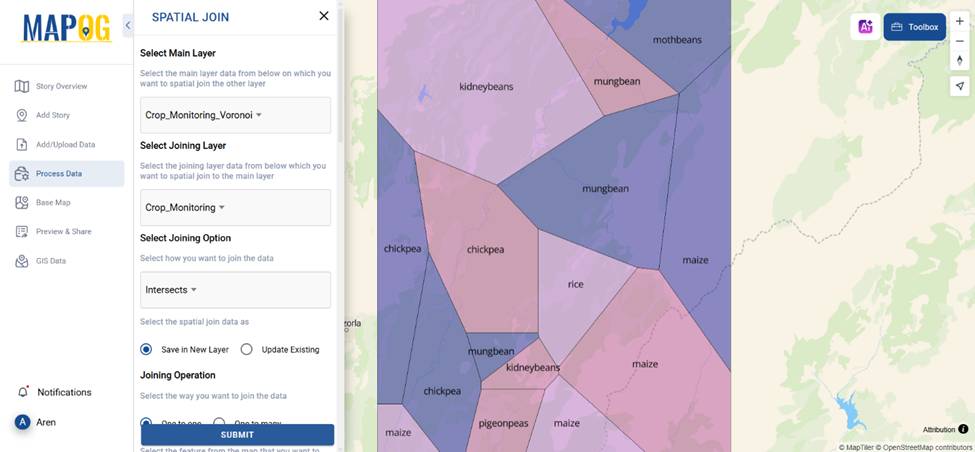
3. Perform Spatial Join
To create a meaningful correlation between soil properties and crop performance, the “Spatial Join“ tool merges the point dataset with existing polygon data. This process helps link soil attributes to specific farming zones, allowing for accurate analysis and better decision-making.
Unlock the future of farming with precision mapping with “Mapping Zones with Specific Farming Fields: Planning Sustainable Irrigation”! Let us dive into how advanced GIS tools help optimize irrigation, reduce resource waste, and boost crop yields.
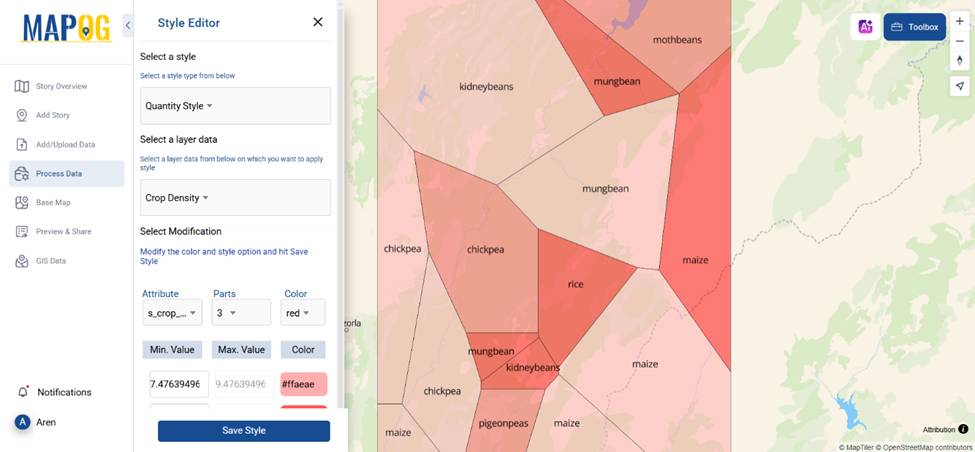
4. Style the Map for Visualization
After processing the data, applying category style for soil types and quantity style from Style Layer under the action button for crop density enhances readability. This thematic representation makes it easier to spot trends and patterns, helping farmers and agronomists determine soil suitability for different crops.
5. Analyze and Use Insights for Better Farming Decisions
Once soil and crop maps are generated, farmers can:
- Identify nutrient deficiencies and apply fertilizers accordingly.
- Monitor crop density to optimize planting strategies.
- Improve irrigation planning based on soil moisture retention properties.
- Detect potential erosion zones and take preventive actions.
Real-World Example
A farm used GIS-based soil mapping to identify low-fertility zones. After integrating soil pH and nutrient levels through MAPOG’s Point to Polygon and Spatial Join tools, they could target these areas with customized fertilizers. As a result, crop yield improved by 25% within a single season.
“Smart Farming with GIS: Connecting Farms to Supermarkets for Better Agriculture” is revolutionizing the way food reaches our tables! By leveraging GIS technology, farmers can optimize crop management, reduce waste, and ensure fresh produce reaches supermarkets faster.
Conclusion
Using GIS for Soil Mapping and Crop Monitoring is transforming modern agriculture. By leveraging tools like Point to Polygon and Spatial Join, farmers and researchers can gain valuable insights, optimize resources, and ensure long-term sustainability. Platforms like MAPOG simplify these processes, making GIS more accessible and practical for real-world applications.
Are you ready to enhance your soil and crop analysis with GIS? Start exploring the possibilities today!
Here are some other blogs you might be interested in
- What Are Heatmaps and How to Create Heatmaps?
- The Role of GIS in Cyber Security and Geospatial Intelligence
- How to Create Grid Maps for Analysis?