A SaaS-based flood risk mapping platform leverages interactive web maps to provide risk assessments. Using GIS, AI, and hydrological data, it enables governments, insurers, and communities to visualize flood-prone areas, enhance preparedness, and optimize response strategies. Cloud-based accessibility ensures scalability, data integration, and seamless user collaboration for proactive risk management.
Key Concept How Flood Risk Mapping with Interactive Web Maps are Prepared
Flood risk mapping SaaS-based with interactive web maps integrates GIS, remote sensing and data analysis. It analyzes elevation, rainfall, land use, and historical flood patterns. AI enhances predictions, while cloud-based platforms ensure accessibility, visualization, and collaboration for proactive flood management and decision-making.
Use of Flood Risk Mapping with Interactive Web Maps
SaaS-based flood risk mapping with interactive web maps serves multiple purposes, including:
- Disaster Preparedness – Helps governments and communities plan evacuation routes and flood defenses.
- Urban Planning – Guides infrastructure development in flood-prone areas.
- Insurance & Risk Assessment – Aids insurers in policy pricing and claims management.
- Public Awareness – Provides accessible flood risk information for communities.
- Emergency Response – Supports quick decision-making during flood events.
- Environmental Conservation – Assesses impacts on ecosystems and water resources.
Process of creating Flood risk mapping with interactive Web Maps
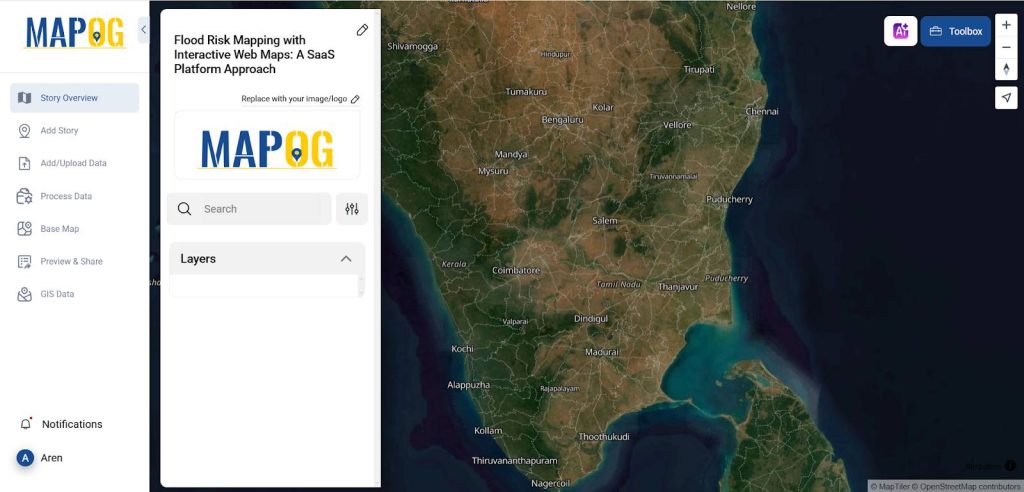
1. Start by setting the Basemap
- Start by creating a new story and give it a name and change the Base Map to Hybrid maps by Selecting Basemap >> Hybrid >> Save Map style.
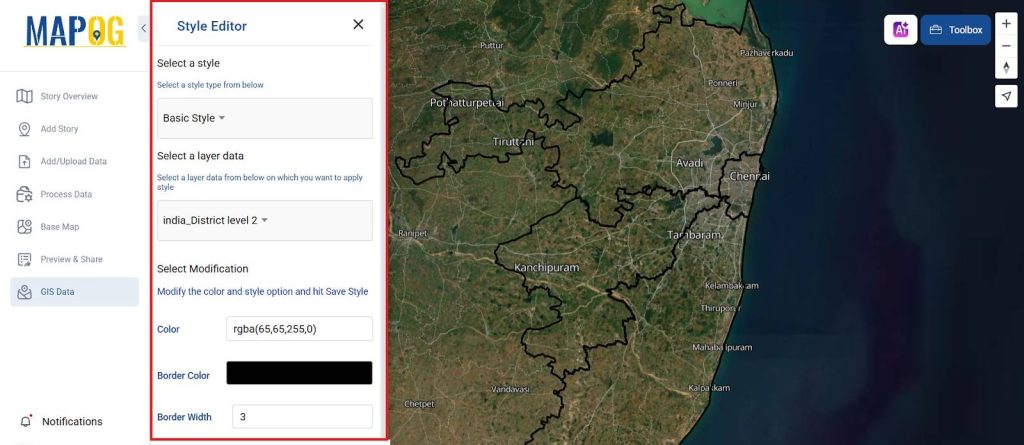
2. Boundary Layer
- Update the boundary layer to the map from the GIS data Library.
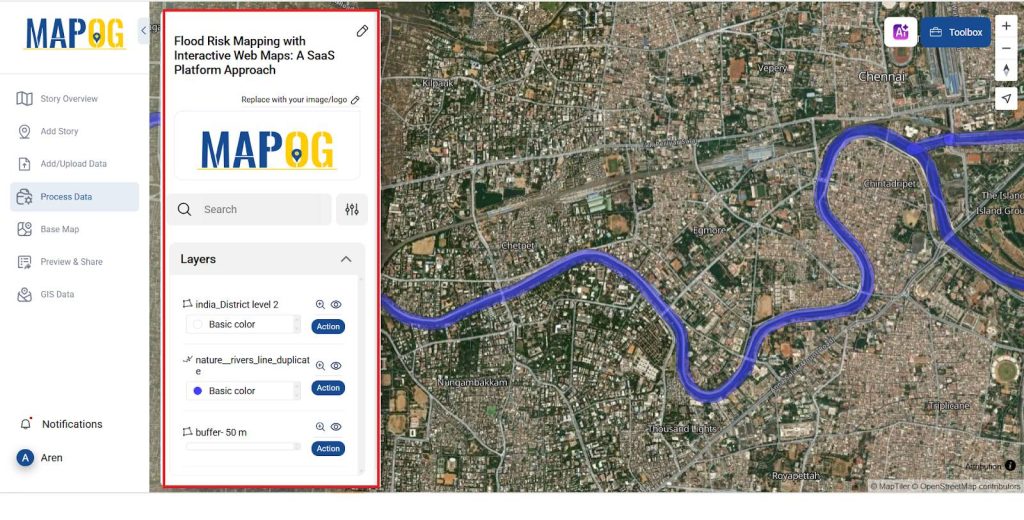
- By selecting the country and then the State and the District to which flood map is created in which select the District Level 2 data and add it on the Map.
- Then on Action select the Style layer in the Basic style editor to reduce the opacity for better mapping.
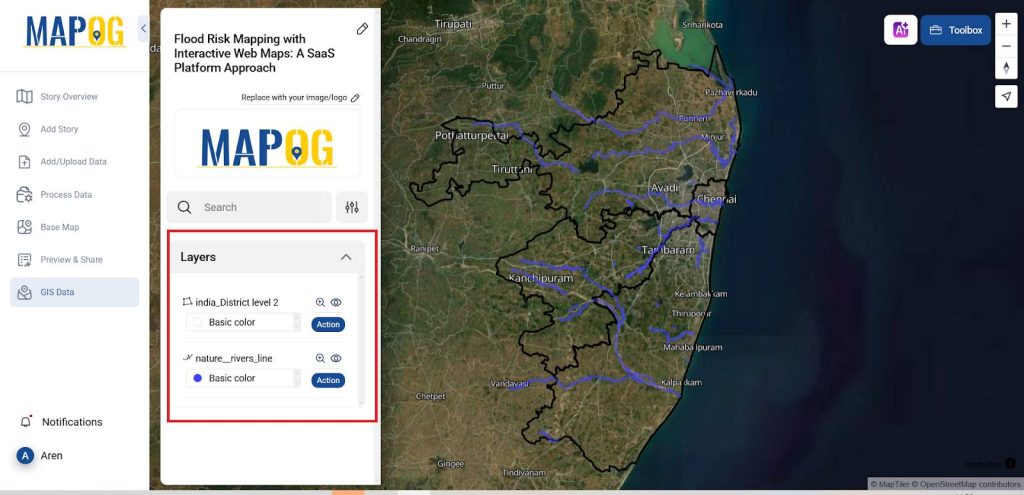
3. River Layer
- Similarly with the same procedure as above by selecting the country >> State >> District to which flood map is created >> select the River data and add it on the Map.
- In Action select the Style layer in the Basic style editor and increase the width to 3 for better appearance.
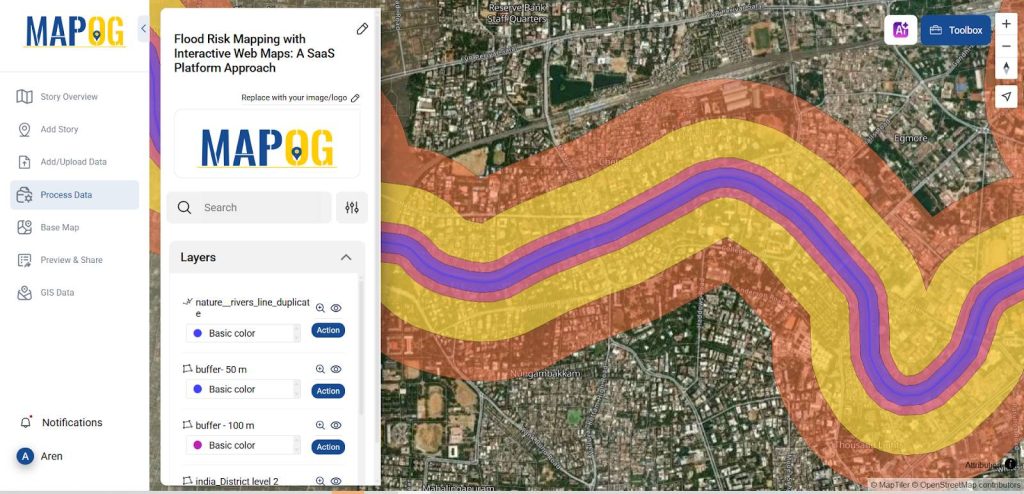
4. Create Various Buffer Layer
Creating various buffers which allows planners and responders to see the full gradient of risk at once, making it easier to prioritize safety, land use, and evacuation planning using SaaS-based flood risk mapping
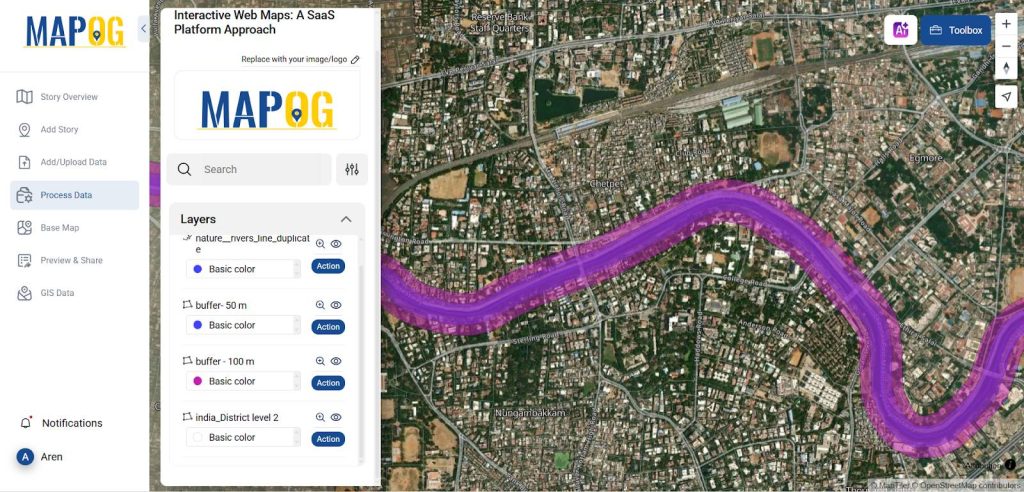
a. Buffer – 50 meter
- In process data select the buffer tool in which select the input layer as river file and the buffer distance as 50 meters.
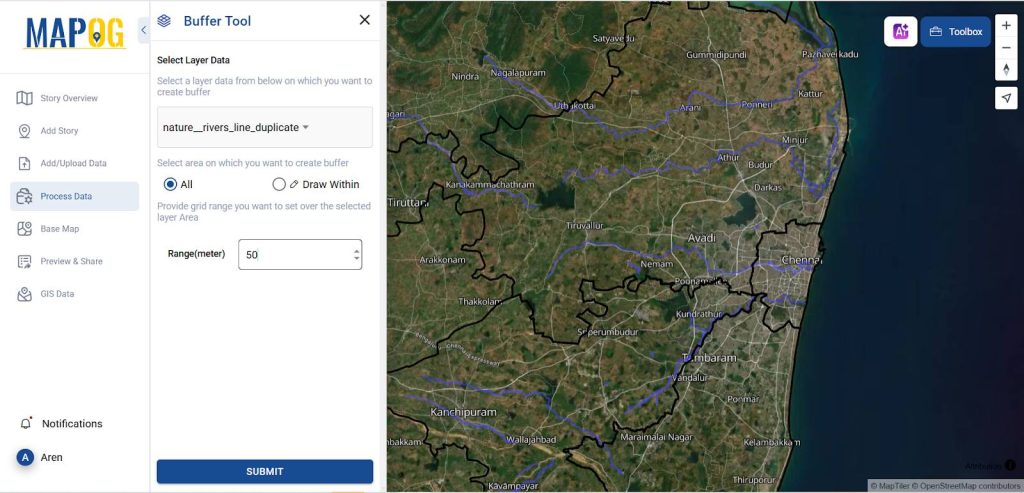
- This map illustrates the extent to which 50-meter floods damage different places and rename the layer as Buffer – 50 m.
b. Buffer -100 meter
- Choose the buffer tool in the process data, setting the buffer distance to 100 meters and the input layer to a river file.
- This map shows the extent of damage caused by 100-meter floods in various locations and renames the layer as Buffer-100 m.
- Modify the layer’s color in Action, to improve mapping, the Style layer in the Style editor modifies the color.
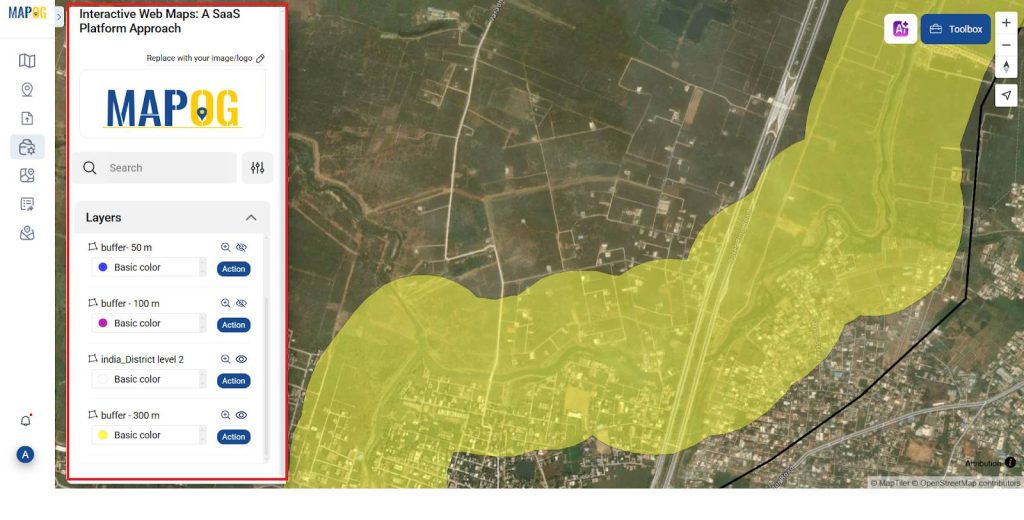
c. Buffer – 300 meter
- Select the buffer tool in the process data, with the input layer set to a river file and the buffer distance set to 300 meters.
- This map depicts the level of damage caused by 300-meter floods in several areas, renaming the layer Buffer-300 m.
- Change the layer’s color in Action. The Style layer’s color is altered in the Style editor to improve mapping.
d. Buffer – 500 meter
- In the process data, select the buffer tool, with a river file as the input layer and a buffer distance of 500 meters.
- With the layer renamed Buffer-500 m, this map shows the extent of devastation inflicted by 500-meter floods in multiple locations.
- In Action, change the color of the layer. To enhance mapping, the Style layer in the Style editor is changed color.
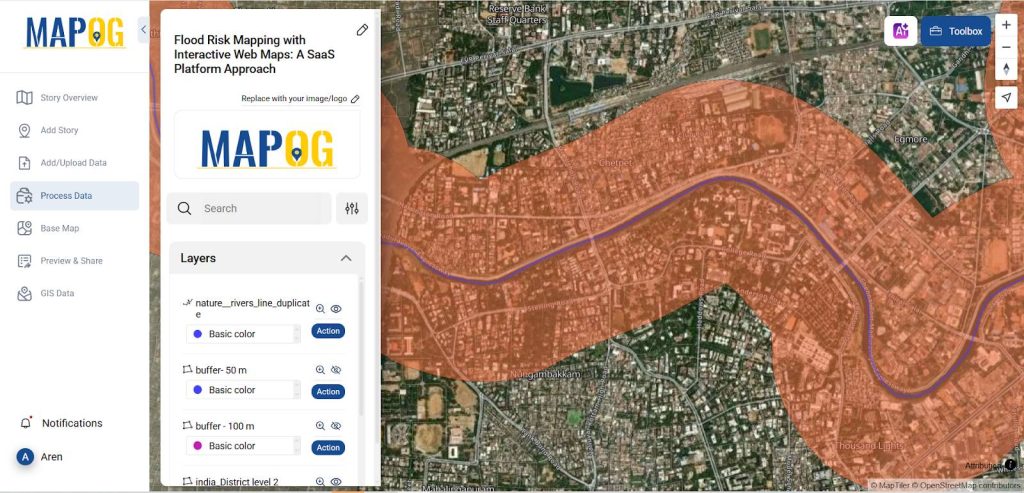
5. Analyze and Disseminate
- Analyze and Disseminate
- The SaaS-based flood risk mapping platform provides interactive web maps for flood-prone areas, enhancing public awareness and emergency response.
- Its scalable cloud deployment allows easy access for multiple users. Integrating geospatial, hydrological, and meteorological data.
- It supports data-driven decision-making for flood prediction, planning, and mitigation, providing governments, organizations, and communities with actionable insights.
Industry and Domain
- Industry: Geospatial Technology, Environmental Technology, SaaS: The platform leverages geospatial and environmental data to provide scalable, cloud-based flood risk mapping, using advanced GIS tools in a SaaS model
- Domain: Disaster Management, Flood Risk Assessment, Environmental Monitoring. The system supports SaaS-based flood risk mapping analysis and decision-making for disaster preparedness, response, and long-term environmental monitoring.
GIS data Used
Conclusion
The platform effectively enhances flood risk awareness through interactive mapping, supports scalable access via SaaS flood risk mapping, and enables data-driven decision-making for improved flood preparedness, response, and mitigation strategies.
An open-source online map-making tool
Interactive Web Maps: A SaaS-based flood risk mapping Platform Approach is greatly strengthened by the combination of interactive mapping, cloud-based accessibility, and rich data analytics provided by the adaptable, open-source MAPOG program, which supports improved preparation, quicker response, and more resilient communities. MAPOG was used in the creation of several of the articles mentioned below.
- How to Use Convex Hull for Contagious Disease Mapping & Outbreak Control
- Isochrone Analysis in GIS: Optimize Travel Times for Faster Delivery & Urban Planning
- How to Geocode Excel Data and Create an Interactive Map (Step-by-Step Guide)
- Creating Point Data for Urban Planning: Digitizing Settlement Features & Infrastructure Mapping