With tools like Story by MAPOG, anyone can begin their journey in online mapping or build a digital interactive map without technical skills. With tools like MAPOG, anyone—whether you’re a student, traveler, business owner, or researcher—can create beautiful, clickable maps in just a few steps. These maps help you tell stories, plan trips, share information, or present data with clarity. And the best part? You don’t need any coding knowledge.
Let’s break it down in the simplest way possible.If you’re also looking to explore different mapping styles or use cases, you might enjoy our guide on Free Custom Mapping – Visualise, Plan & Share.
What is an Interactive Map?
An interactive map is a smart, clickable map that lets users explore locations in a visual and engaging way. You can zoom in, click on points, read short descriptions, view images, and even explore routes. Unlike static maps or plain lists, interactive maps help you tell a story with locations. With tools like MAPOG, creating an interactive map online is not only simple, but also fun and effective for various users.
With Story by MAPOG, you can:
- Add pins to highlight important places
- Attach descriptions, images, or links to each point
- Categorize your points (e.g., restaurants, temples, offices)
- Share your map with others or keep it private
- Embed your maps on a website or blog
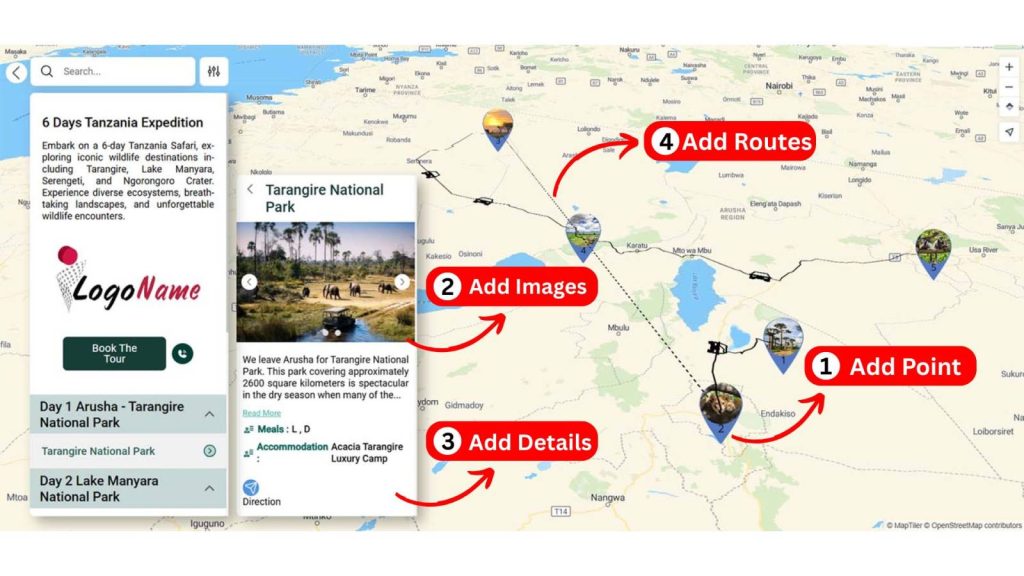
How to Create an Interactive Map or a Story Map
Creating a story on MAPOG is simple and intuitive, designed so anyone can build a map step-by-step with ease. You don’t need to follow long tutorials—just a few actions, and your story starts to come alive.
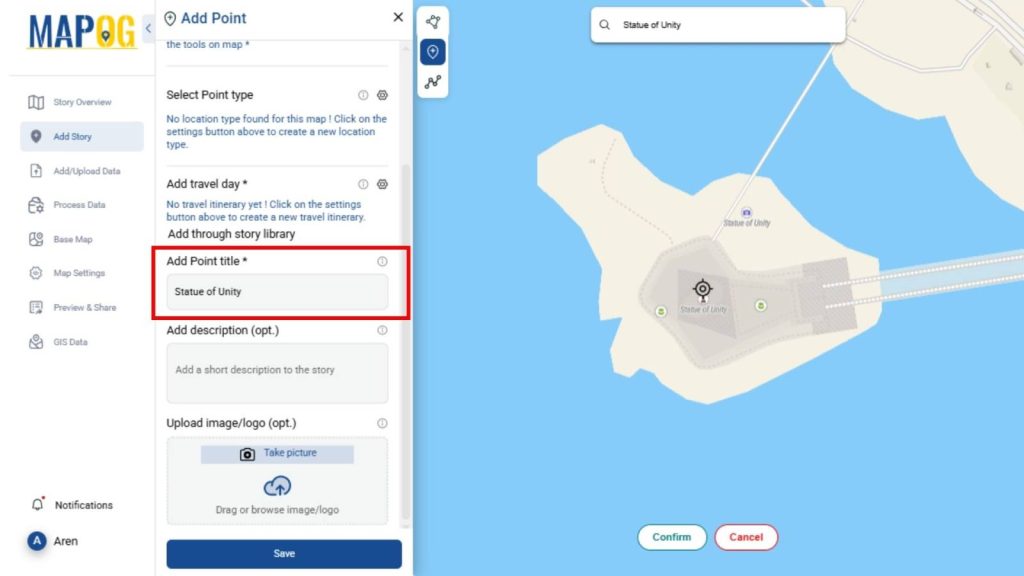
1. Add Points
Click anywhere or search on the map to add a location pin. Each pin represents a place that is part of your story—this could be a hotel, landmark, office, event venue, or anything else.
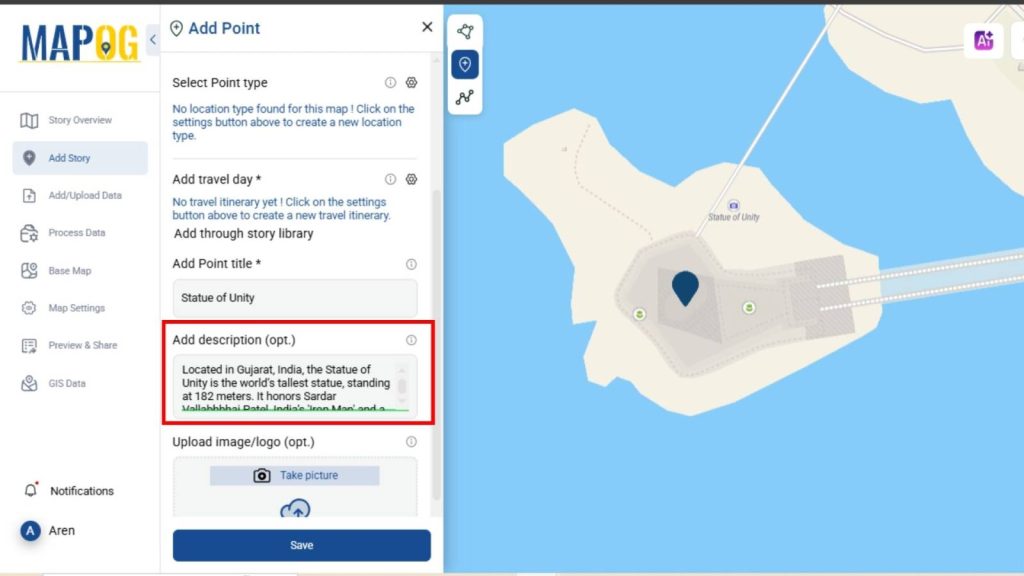
2. Add Descriptions
Every point on the map can have its own title and description. You can write something as simple as a name, or add details about the place—like what it’s known for, why it’s important, or what someone should know about it.
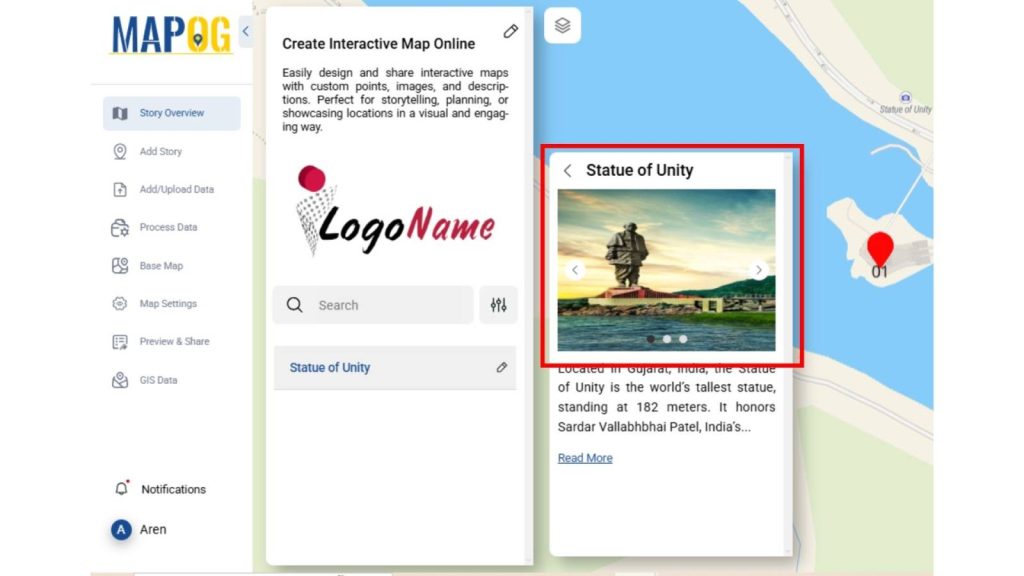
3. Add Images to Each Point
You can make each point visually rich by adding images to your online map. This helps viewers connect more deeply with the story you’re telling—especially in travel, culture, or real estate maps.
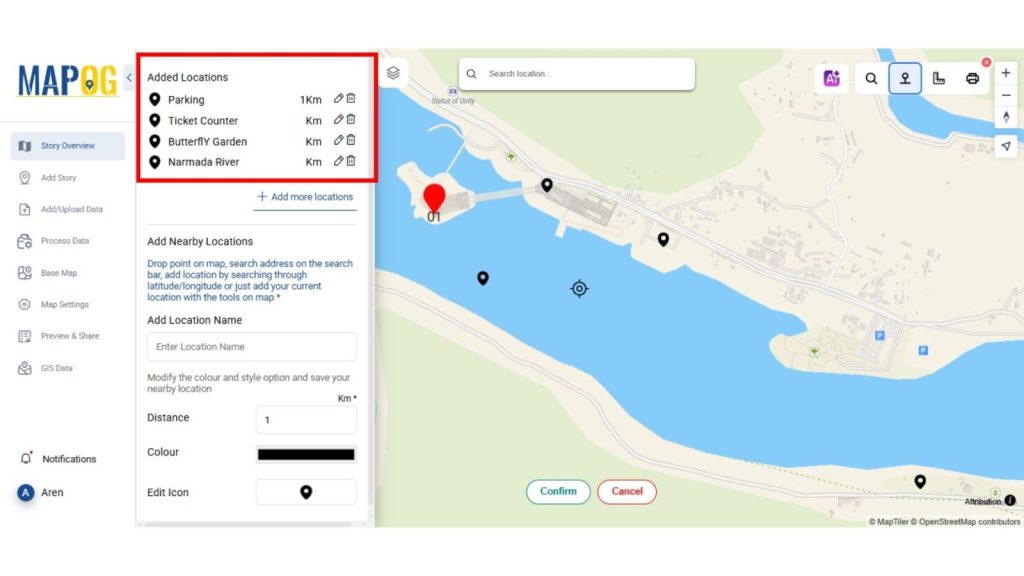
4. Add Nearby Locations
You can manually add nearby points of interest around your selected location—like hospitals, ATMs, restaurants, or landmarks—to make your map more informative and helpful for viewers.
5. Use Buffer or Isochrones
You can draw buffers (circles showing area coverage) or use isochrones (to display how far someone can travel within a certain time or distance) to add deeper context—great for planning, accessibility checks, or delivery coverage maps. This feature becomes even more powerful when paired with advanced visual techniques like Heatmaps, which help highlight density or intensity across your mapped data.
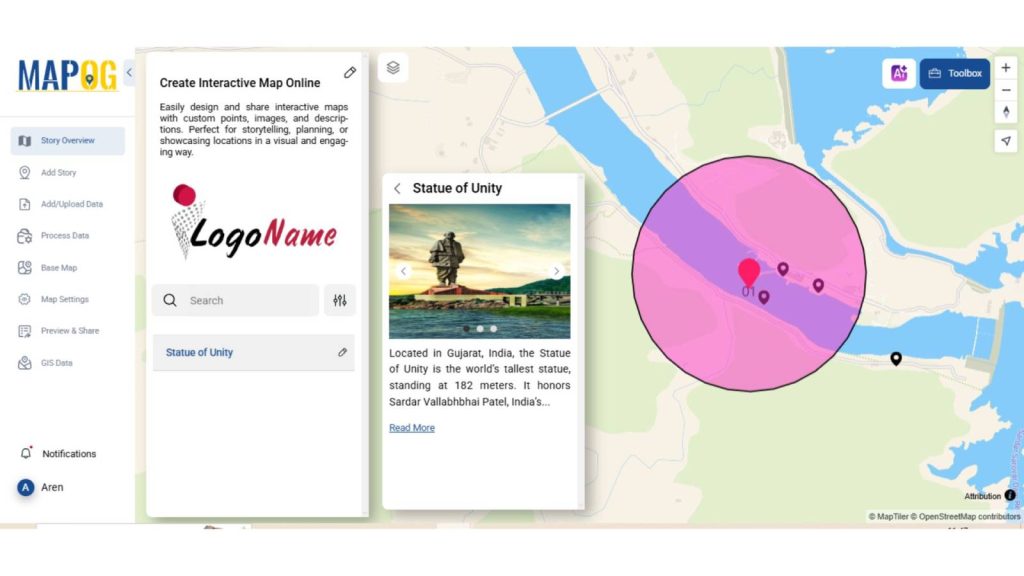
This is how a interactive story map is created visually on a map using MAPOG—point by point, layered with content, customized by category, and organized for clarity.
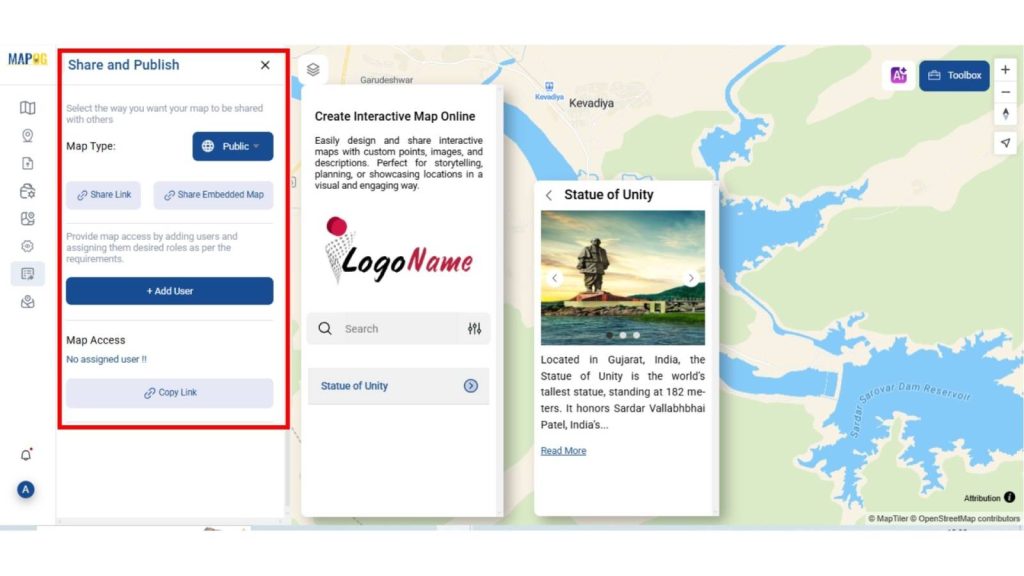
Once your map is ready:
- Share it privately with team members or friends
- Collaborate by giving edit access to others
- Or publish it publicly so anyone can view it
- You can even embed the map on your website or portfolio with a simple link.
Why Use MAPOG for Interactive Maps?
Whether you’re planning a trip or showcasing research, creating an interactive map online makes your content more engaging
- No coding needed
- Add photos, links, text easily
- Mobile-friendly and responsive
- Great for businesses, travelers, schools, researchers, or real estate
- Organize your content clearly with categories and filters
- Public or private sharing control
So next time you need to present information, consider using an interactive map online with MAPOG.
Ideas for Maps You Can Create
- Travel Itineraries
- Property Listings
- Event Planning
- Campus or Facility Tours
- Business Locations
- Heritage and Culture Maps
- Environmental Studies
- Historical Storytelling
- Personal Experiences
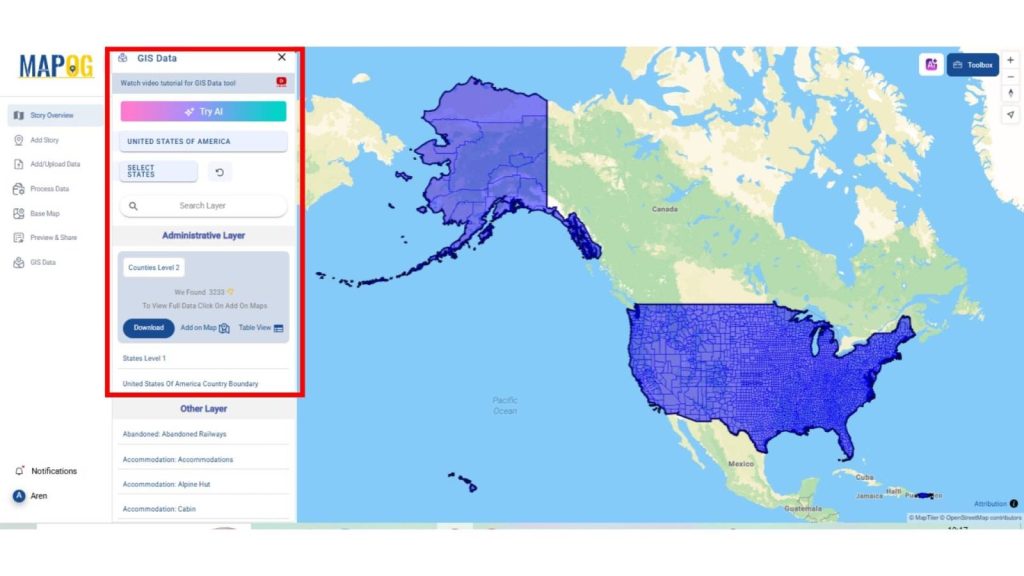
Bonus: Access to Ready-to-Use GIS Data
One of the biggest advantages of using MAPOG is the access to built-in GIS Data. Whether you need administrative boundaries like country, province, or regional borders, or want to include thematic layers such as airports, rivers, highways, or railway lines—MAPOG provides over 200+ layers for more than 2000 countries. All datasets are available in popular GIS formats including SHP, GeoJSON, and KML, making it easy to enhance your interactive maps with rich geospatial context.
Conclusion
Creating an interactive map online is now as easy as creating a social media post. With Story by MAPOG, you can visually present your ideas, plans, or experiences in a way that’s clear, interactive, and easy to share. So whether you’re mapping your next trip, your business network, or a research project—MAPOG is here to help you bring your map stories to life. Curious about how MAPOG can assist in agriculture and land research? Don’t miss our article on How to use GIS for Soil Mapping and Crop Monitoring.
Explore More Articles
Here are some other helpful reads you might enjoy: