In today’s renewable energy movement, GIS helps in solar energy site suitability and analysis by providing precision, clarity, and data-driven decisions. This blog unpacks how Geographic Information Systems are transforming how we identify optimal solar farm locations, ensuring both efficiency and environmental harmony. Through a practical example using real GIS tools, you’ll discover how layered mapping, buffering, and spatial analysis can guide smarter solar energy planning.
Key Concept: GIS for Solar Energy Suitability
When it comes to planning solar energy sites, not all land is created equal. Factors such as proximity to infrastructure, land type, and existing solar zones play a vital role. GIS helps in solar energy site suitability and analysis by letting planners’ layer multiple data sources—like roads, railways, farmlands, residential areas, and existing solar farms—onto one dynamic visual interface.
Using spatial tools like buffer zones and layer styling, decision-makers can evaluate potential sites with incredible accuracy. Tools like MAPOG’s buffer tool and Add story feature simplify this complex process into an engaging and accessible workflow.
Step-by-Step Process for Solar Site Analysis Using GIS
Let’s break down how GIS helps in solar energy site suitability and analysis using a real example created using MAPOG:
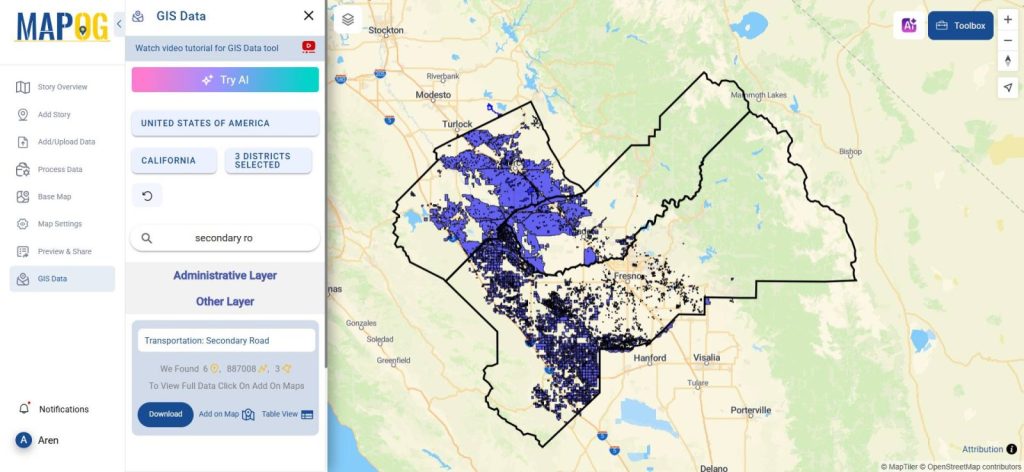
1. Importing Essential GIS Layers
Upon entering the MAPOG interface, we need to get some specific dataset, using GIS data option we can get various built in GIS data in the platform itself, which we can add on map and start working. So,
Start by importing critical datasets:
- Farmland
- Residential zones
- Road networks
- Railways
- Existing solar farms
These layers help build a complete visual landscape.
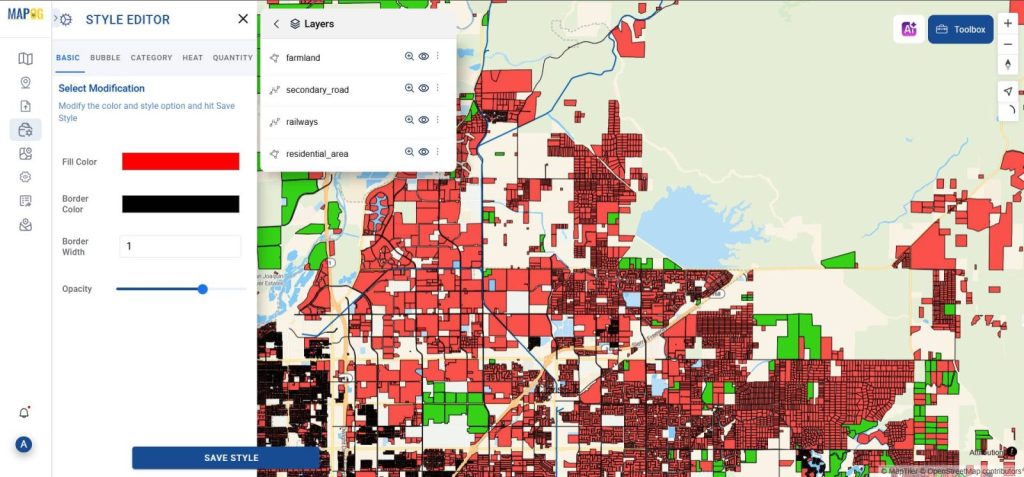
2. Styling Layers for Clarity
With the Style Editor in action button, each layer can be color-coded and visually adjusted. Farmlands can be shaded green, residential areas marked red, and infrastructure like roads and railways clearly defined. This helps distinguish zones at a glance.
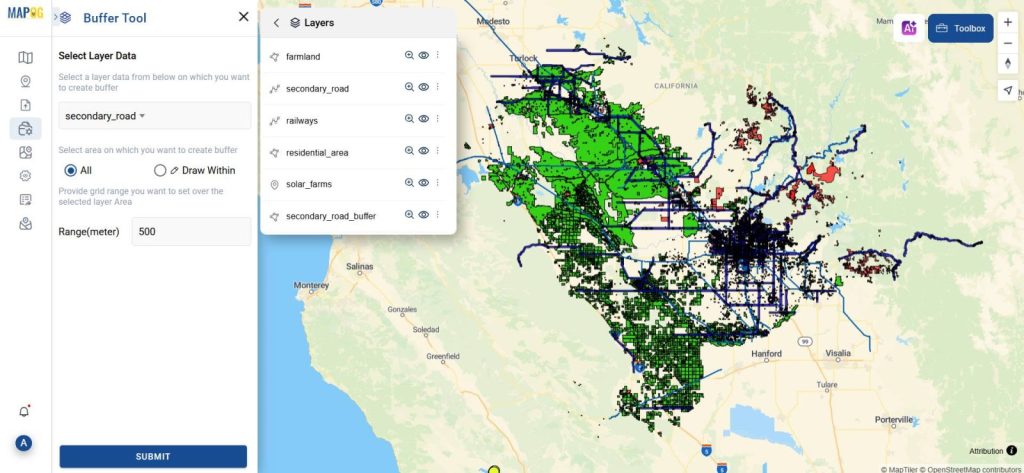
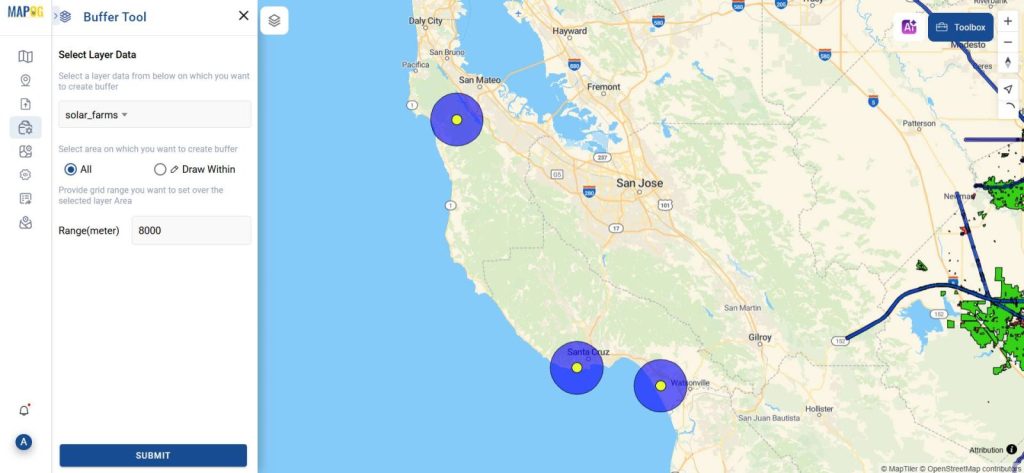
3. Creating Buffer Zones Around Key Features
Here’s where MAPOG’s buffer tool shines. With the process data in the left panel, we can easily access the Buffer Tool. GIS helps in solar energy site suitability and analysis, and by generating a 500-meter buffer around roads and railways and an 8 km buffer around existing solar farms, we create exclusion and preference zones that indicate optimal access and distance. This helps identify viable land that is neither too isolated nor too congested.
Discover how to simplify your hydrological mapping with “Comprehensive Stream Ordering Guide: Map Annotation and Sharing Made Easy.” This quick read walks you through stream ordering like a pro while showing how to annotate and share your maps effortlessly. Whether you’re a GIS newbie or a seasoned mapper, this guide is your next must-read!
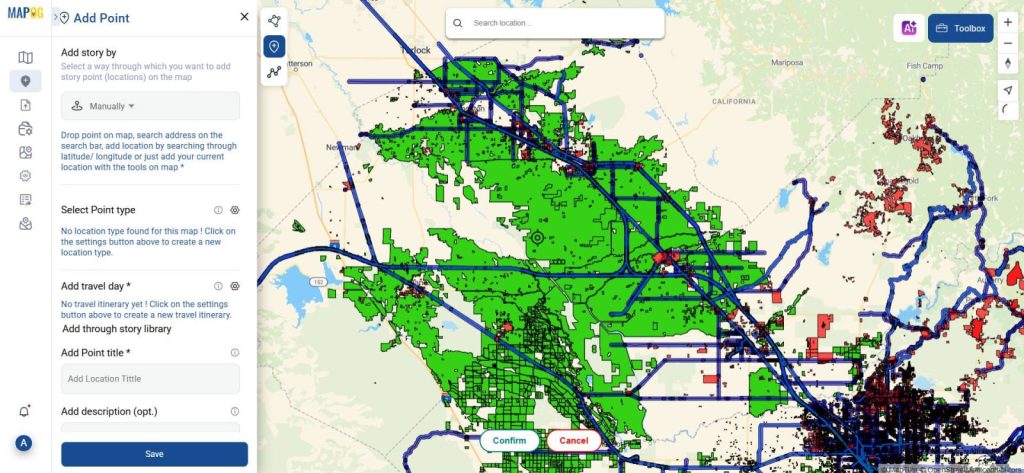
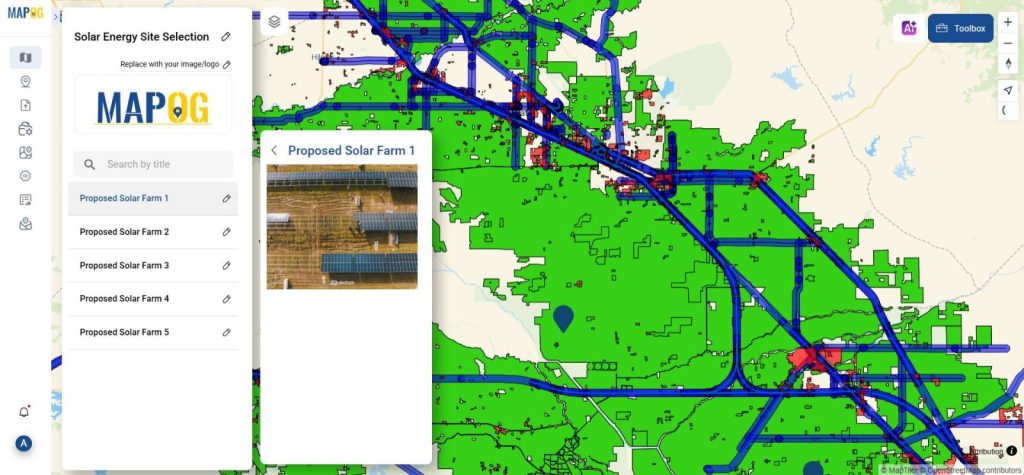
4. Proposing Suitable Sites Using GIS
Once buffer zones are established, the “Add point” feature in the Add Story section is used to mark potential sites for new solar farms. GIS helps in solar energy site suitability and analysis, and these proposed locations fall within optimal zones identified by the spatial analysis. We can manually set the points and provide point titles, descriptions, and images to give them proper value.
This final step brings all the layered data together to present a clear recommendation—ready for stakeholder presentation, policy input, or further environmental review.
Industry Insights & Benefits
GIS helps in solar energy site suitability and analysis not only for planners but also for governments, private developers, and environmentalists. Here’s why this GIS-based approach is becoming the industry norm:
- Improved Accuracy: Decisions are based on data, not guesswork.
- Reduced Environmental Impact: Avoids residential and ecological zones.
- Cost Efficiency: Proximity to infrastructure lowers setup costs.
- Regulatory Compliance: Easier alignment with zoning and land-use rules.
By combining storytelling with spatial data, tools like MAPOG enable professionals to visualize, share, and iterate on solar plans more collaboratively.
GIS Data Used:
Curious about where the world’s clean energy really comes from? Create Map – DIGITIZING SOLAR, HYDROELECTRIC, WIND AND BIOMASS POWER PLANTS – RENEWABLE ENERGY—making renewable energy visible like never before. Dive in and explore how geography powers the planet sustainably!
Conclusion:
From layering farmland to placing proposed points using buffer zones, GIS helps in solar energy site suitability and analysis in ways that are both scalable and deeply insightful. Tools like MAPOG, with features like Add story and buffer tool, allow even non-experts to build compelling, data-rich spatial stories for solar projects.
So, the next time you’re considering a renewable energy site—let maps do the talking.
Here are some other blogs you might be interested in