Welcome to MAPOG, where we address flood risks with innovative solutions along the Rivers. This example demonstrates how MAPOG‘s tools can map and analyze flood risks, providing valuable insights for strategic planning. Join us as we navigate through this use case, showcasing MAPOG‘s capabilities in mapping and addressing flood risks.

Key Concept
Within this key concept, we’ll illuminate the core aspects of employing MAPOG for in-depth map analysis, specifically focusing on mapping and addressing flood risks along the Rivers. For the purpose of this case study, we are taking a River as our focal point. Furthermore, you can find the links to GIS DATA used in this guide at the conclusion of the article.
Follow the below steps to Map and Address Flood Risks Along the Rivers
Step 1: Adding Required Data
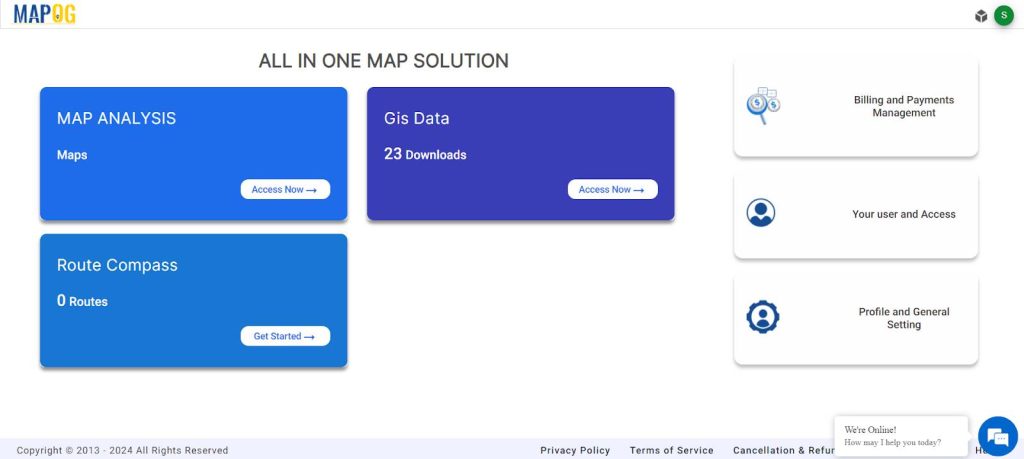
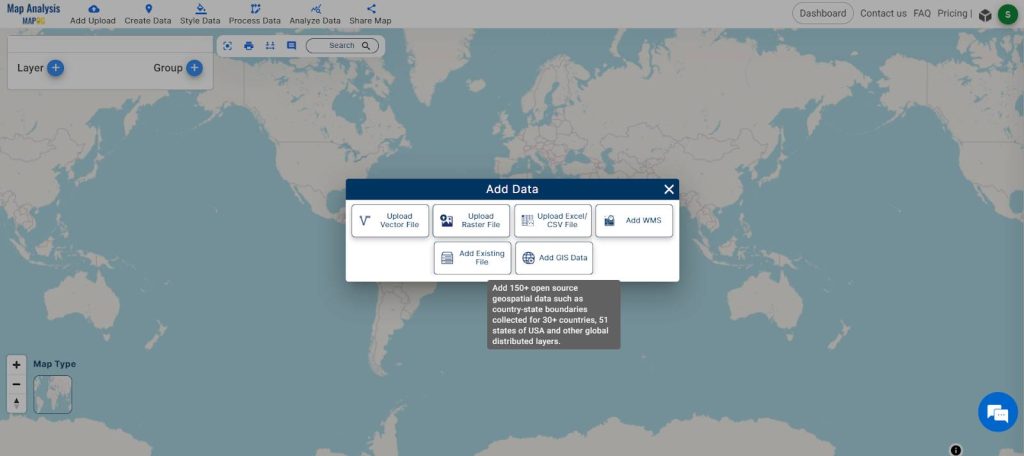
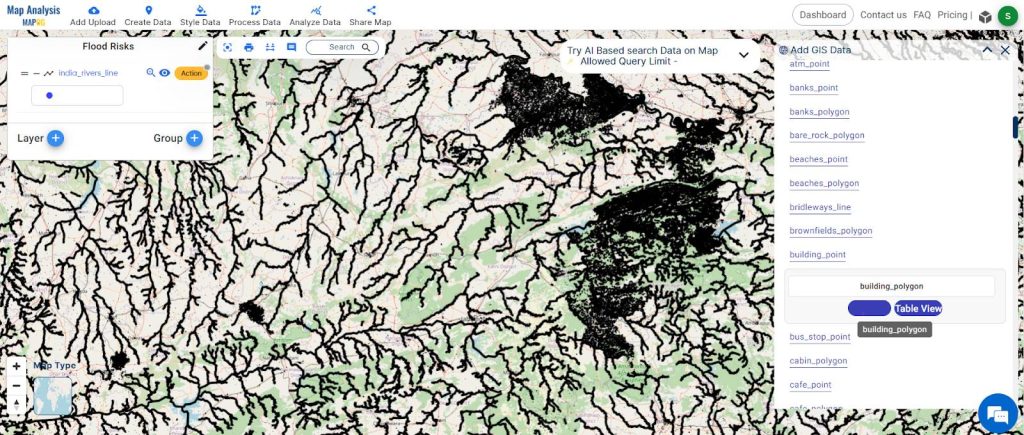
Start the analysis by opening the Map Analysis tool. Click on “Add Upload” and then select the GIS Data tool. Navigate to the country, and proceed to add the River’s shapefile and building polygons for analysis. Click the “ADD” button to smoothly integrate both data layers into the map analysis canvas.
Step 2: Save and Rename Project
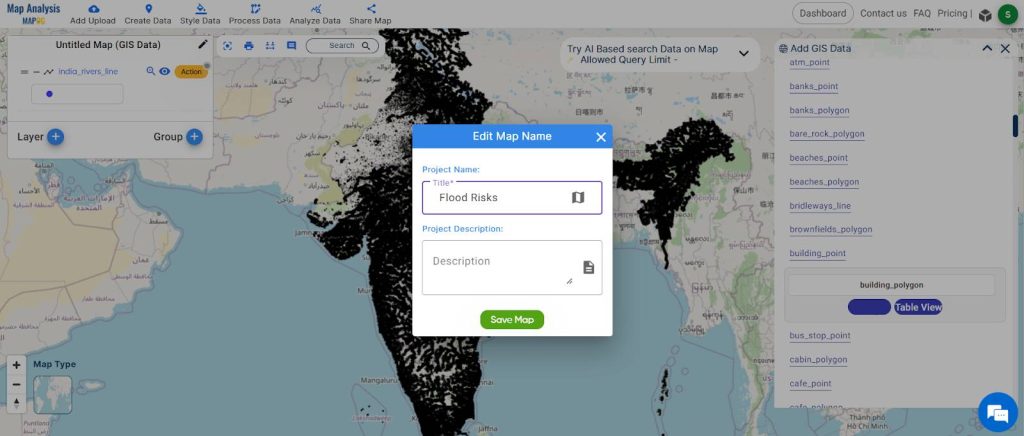
Save your project by clicking the pencil icon above the action button, where you can also rename your project for better organization.
Step 2: Clipping Required Regions
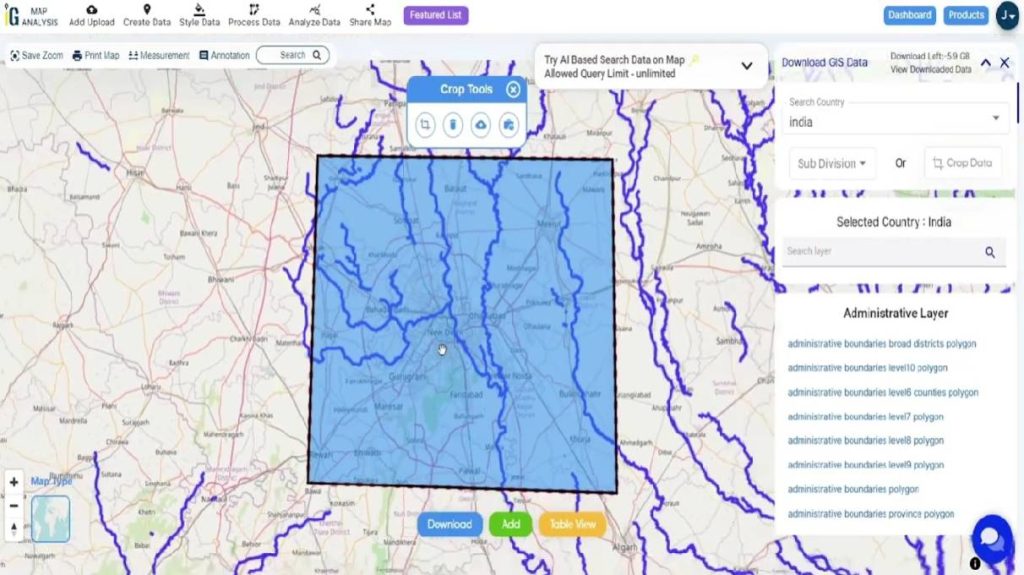
Locate the Crop tool, found in the top-right corner or within the action button. Use the Crop tool to define and select specific areas of interest for analysis, enabling a focus on particular regions or segments based on your requirements.
Step 3: Buffer Zone Creation for River
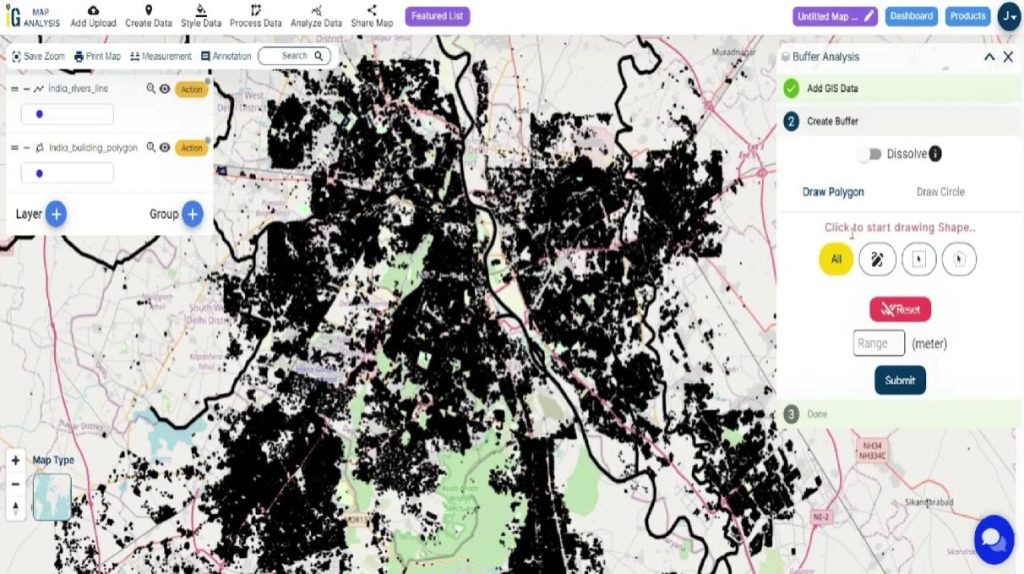
After selecting the study area, establish buffer zones for the River. Create two buffer zones: one of 50m and another of 100m to identify flood-prone areas along the riverbanks.
- Click on the action button for the River Data layer.
- Select “Create Buffer” in the actions menu.
- Specify buffer zones at 50 and 100 meters.
- Click “Submit” to initiate buffer creation.


Step 7: Rename Layer
Rename your layer by clicking the action button, then select the pencil icon to edit the layer name.

Major Findings
Once MAPOG‘s analysis tools are put to work in mapping and addressing flood risks along the River, the insights generated go beyond the surface. Here’s a look at the strategic uses of this analysis:

Flood-Prone Area Identification:
- Utilization: Identify and assess areas susceptible to flooding along the River.
- Strategic Value: Empowers decision-makers with insights for informed urban planning and disaster preparedness.
Buffer Zone Insights:
- Utilization: Establish buffer zones to understand spatial impacts and relationships with features within specified distances.
- Strategic Value: Offers nuanced insights into flood risk areas, aiding in strategic decision-making for resilience planning.
Domains and Industries Benefiting from this Analysis
- evaluation for flood-prone areas in city planning.
- Consideration of impacts on local communities.
- Detailed understanding of flood risks and potential impact zones.
- Facilitation of disaster preparedness planning.
Conclusion
Thank you for joining us on this step-by-step journey in mapping and addressing flood risks along the River with MAPOG’s map analysis tools. From adding data to creating buffer zones, this exploration demonstrates the power of map analysis in uncovering insights crucial for informed decision-making in addressing flood resilience challenges. For any inquiries, contact us at support@mapog.com.com and explore our other innovative products for more exciting possibilities in the realm of map analysis.
GIS data links
Other Articles
- Protecting Wetlands: Guide to Create GIS Map for Nature
- GIS Analysis in Urban Planning: Reshaping Transportation Future Insights of state/city
- Fast Emergency Response: Using GIS and Isochrone Maps for 10-Minute Ambulance Arrival
- Mapping Tiger Attack Hotspots – Create an Online Map and Share
- Make Routes for Military Aerial Planning- Through Bearing angle and Distance calculation – Online Route Compass
- Mapping Healthcare Efficiency: GIS Buffer Analysis of Hospital Locations
- Add WMS- Two step online view of WMS layer on a map
- Plot ATM locations on a map and embed on your website
- Map habitat locations of endangered animals & keep track of their living