In the developing landscape of agriculture and environmental conservation, the need for innovative tools and technologies has become most important. One such groundbreaking solution is MAPOG, a platform that seamlessly integrates agriculture and river data to create a comprehensive map for assessing proximity and potential impacts on water resources. In this article, we’ll explore the process of using “Create a Map for Smart Farming: Agriculture and Rivers”, offering valuable insights for farmers, environmentalists, and land-use planners.
Key Concept to Create Map for Smart Farming: Agriculture and Rivers
The primary goal of this mapping endeavor is to create an informative and visually appealing map showcasing the closest rivers to agriculture zones. The insights provided by MAPOG are crucial for farmers, environmentalists, and land-use planners, guiding informed choices. You can explore all the data used in this analysis through the link provided at the end of the article.
Below are the steps to unleash the potential of MAPOG Map Analysis, a user-friendly tool: to Create Map for Smart Farming: Agriculture and Rivers
This methodical process effortlessly guides us in creating an insightful map, revealing the proximity of water resources to farming zones . Let’s dive into each step to make this mapping journey a seamless experience:
Step 1: Data Integration:
- The first step involves adding GIS datasets from MAPOG. Click on the “add upload” button from the header and choose the “add GIS data” option.

2. Search the country.

3. Let’s find the river and agriculture data and Click on the Add Button.

Step 2: Rename the layers and Untitled Map:
1. Click on the Rename Button and Name the untitled map.

2. Change the layer name by clicking on the “Action” Button.

Step 3: Enhanced Visualization:
1. To enhance the visual appeal of the map, the ‘Category Style‘ is applied to rivers. Click on the “style Data” button and choose the Category style option.

2. Select the river layer and choose the attribute. Then Click on the “Save Style” Button.

Step: 4 Creating Buffer Zones:
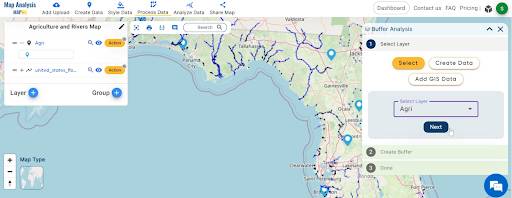
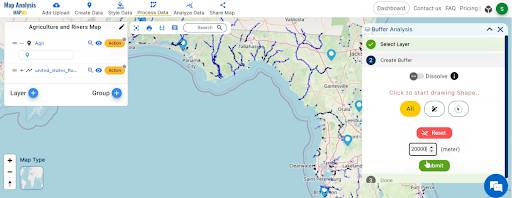
1.Buffer zones around agriculture areas are created. Click on the “process data” option then choose the “Buffer tool“.

2. You can see the Buffer Analysis Tool open on the right side of the screen. here select the layer Agri. set the buffer range 20000 meters. Click on the Submit Button.


Step: 5 Proximity Analysis:
1. The utilization of the ‘Proximity Analysis‘ tool. Click on the Analyze Data Button and Click on the “Two Layer” Option.

2. Select the finding features are within and select features. Click on the “next”.

3. Write the field name and click on the “get result” option.

4. we have the total Feature: 75. we can download the excel file and click on the “Publish” Button for visualization.

This tool determines the nearest river to each buffer zone, providing actionable insights into the relationships between agriculture and water resources.
Step: 6 Showcasing Findings:
The final steps involve showcasing the findings through the ‘Export Layer’ and ‘Share Map’ options. Click on the “Action” Button of the new filtered layer and choose the “Export Layer” option.


Major Findings:
- The information provides valuable insights into potential impacts on water resources and environmental considerations.
- The resulting map becomes a crucial tool, revolutionizing smart farming practices in the region.

The integration of agriculture and river data through MAPOG opens new avenues for informed decision-making in the agricultural landscape. The map serves as a tool for not only assessing proximity but also for promoting sustainable and responsible practices. For any questions or inquiries, stakeholders are encouraged to reach out to MAPOG at support@MAPOG.com.
Link of the Data:
Explore the data further through our GIS Data product, uncovering valuable information for in-depth analysis and understanding.