MAPOG, empower users to create, analyze, and manage spatial data, offering valuable insights across diverse industries. Create Point, Line, Polygon on Map Using MAPOG allows users to generate new spatial datasets. It’s crucial for customizing maps, defining specific geographic features, and tailoring analyses to meet diverse mapping needs.
Unlock the power of merging polygons in maps! Explore our guide on how to seamlessly combine spatial features for comprehensive analysis and visualization in ‘How to Merge Polygons in Maps‘.
Key Concepts to create Point, Line, Polygon Using MAPOG
Our goal is to create Point, Line, Polygon Using MAPOG. This map’s thematic structure is undoubtedly what gives it its fascinating details. Join us as we walk you through the process of making this effective map on the MAPOG. Let’s get started!
Steps to create Point, Line, Polygon Using MAPOG
Step 1: Create Polygon Data
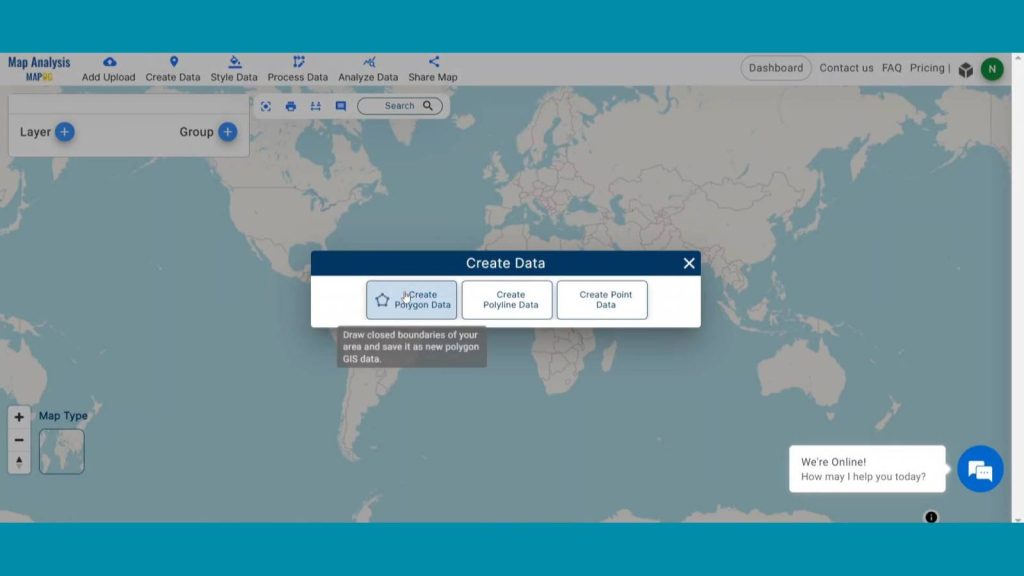
First, navigate to the Map Analysis interface. Then click on the “Create Data” button in the upper left corner. A dialogue box will open. Click on “Create Polygon Data” to Create Polygon.
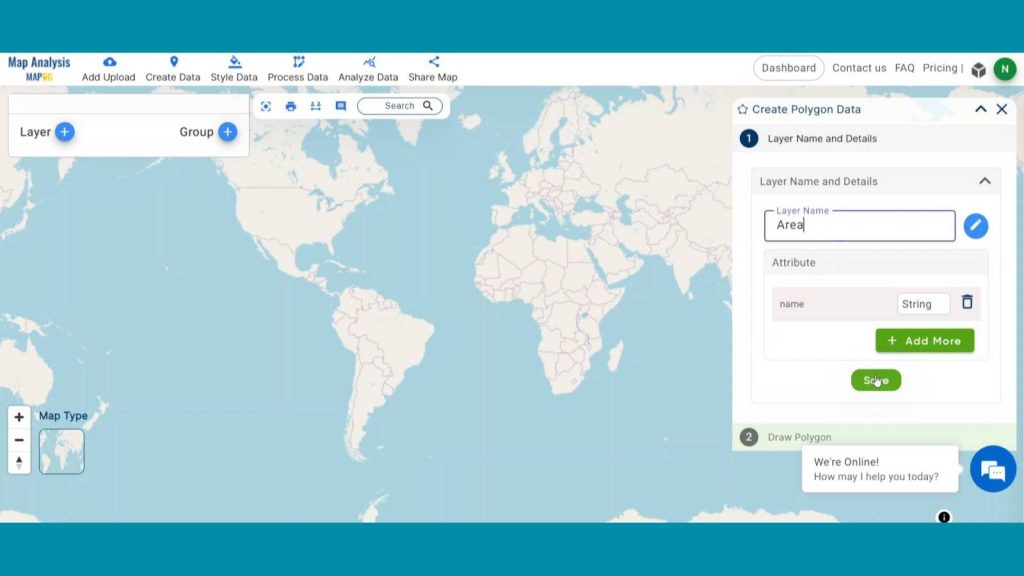
In the right corner box Provide the name and hit save.
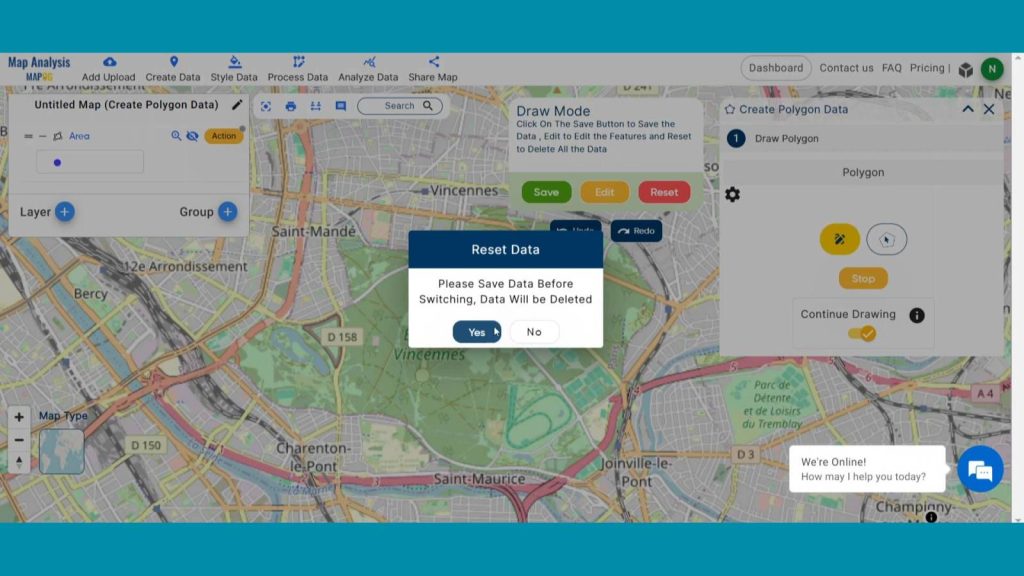
Now, click on pencil icon to create any shape and press the continue drawing option then click yes on the opening dialogue box saying “Please save data before switching, or data will be deleted”
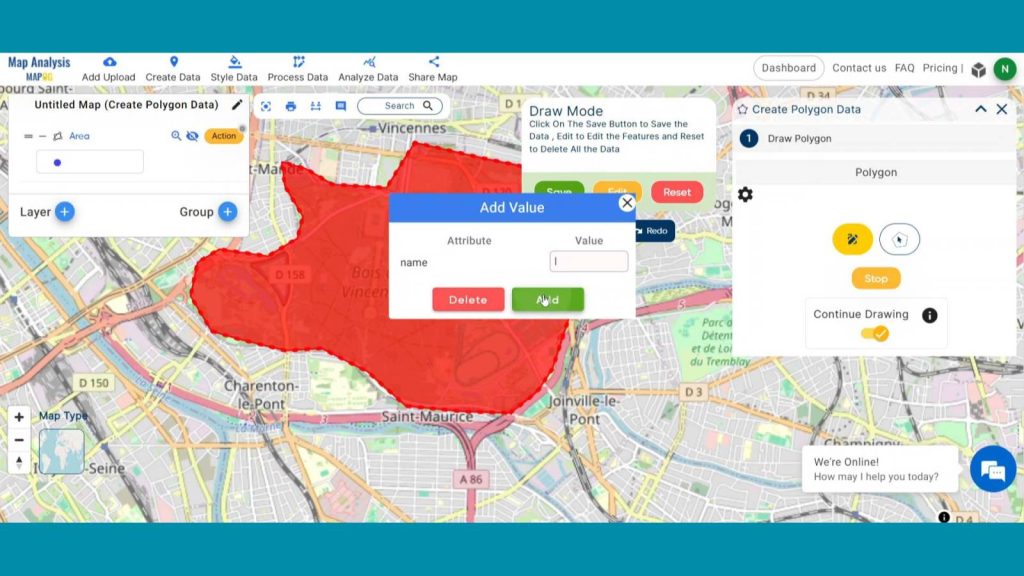
Now start digitizing the area boundary and double click to finish the digitization. In the Add Value provide a suitable value and press add.
Now click on Save to save the polygon digitization.
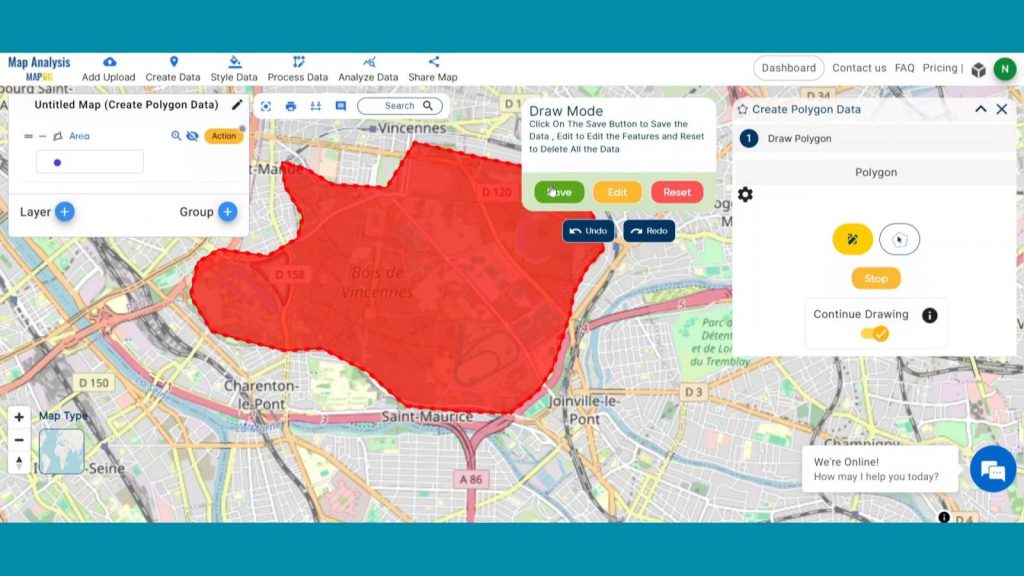
In GIS, polygon features delineate enclosed areas on the Earth’s surface, defined by interconnected sets of coordinates. They are essential for mapping regions like land parcels, watersheds, and administrative boundaries. Polygon features are widely used in spatial analysis, land-use planning, and resource management for comprehensive geographic insights.
Step 2: Create Polyline Data
Click on Create data and then click on Create Polyline Data .
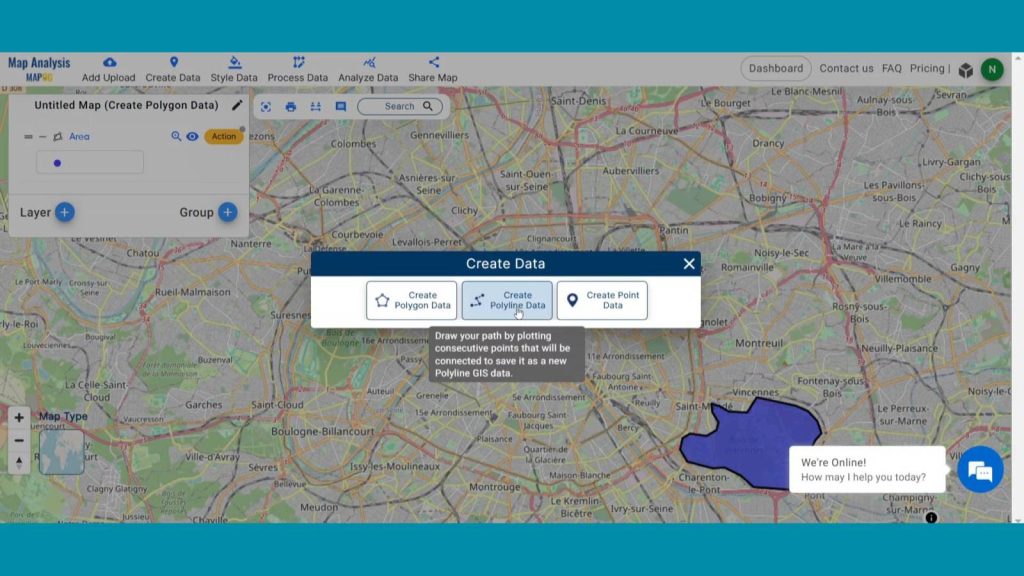
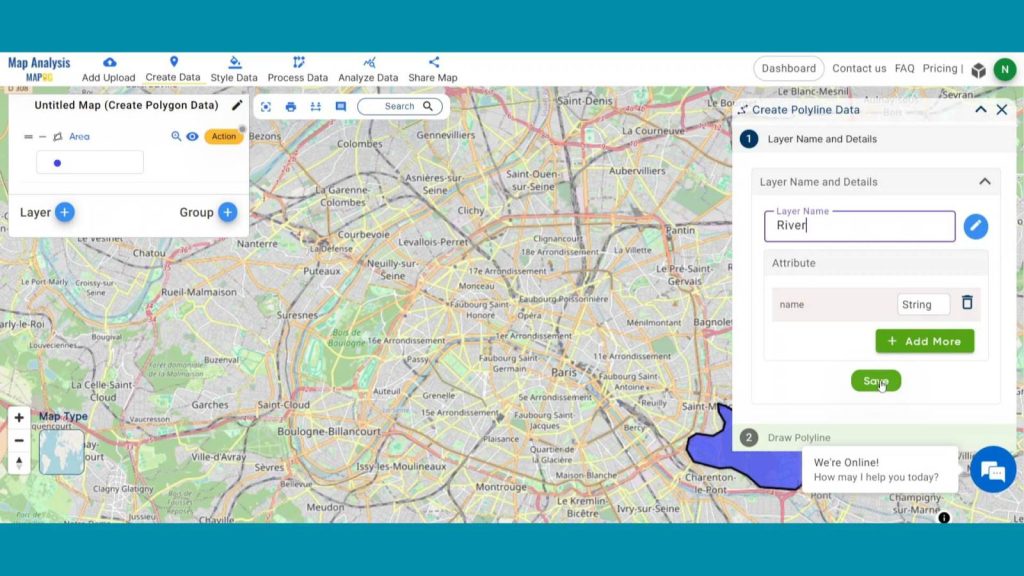
Change the layer name to River and click on save as we are digitizing a river.
Click on the polyline icon and continue drawing. End the digitization by double click. Then Add Value and click Add.
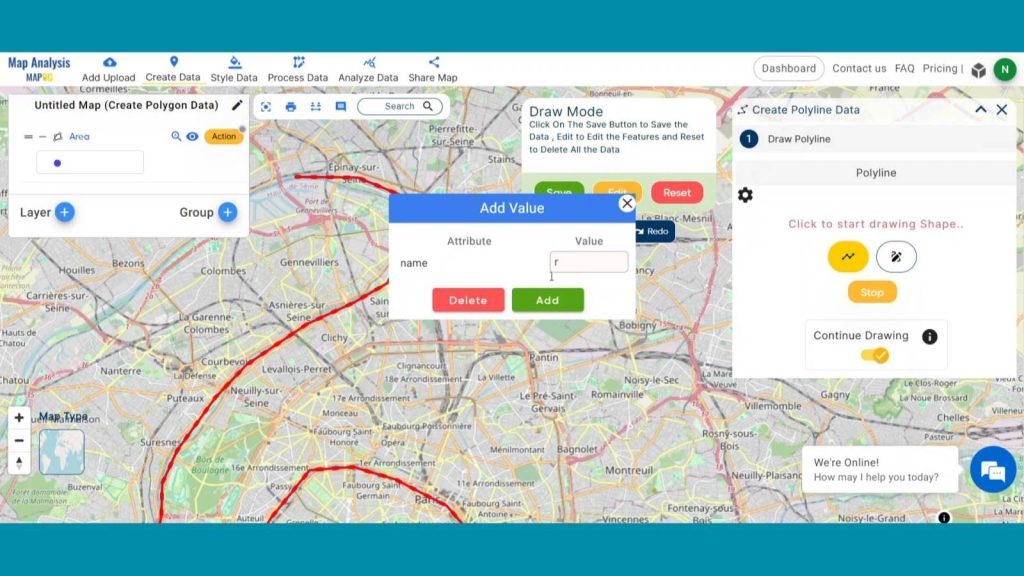
Lastly hit save to save the polylines.
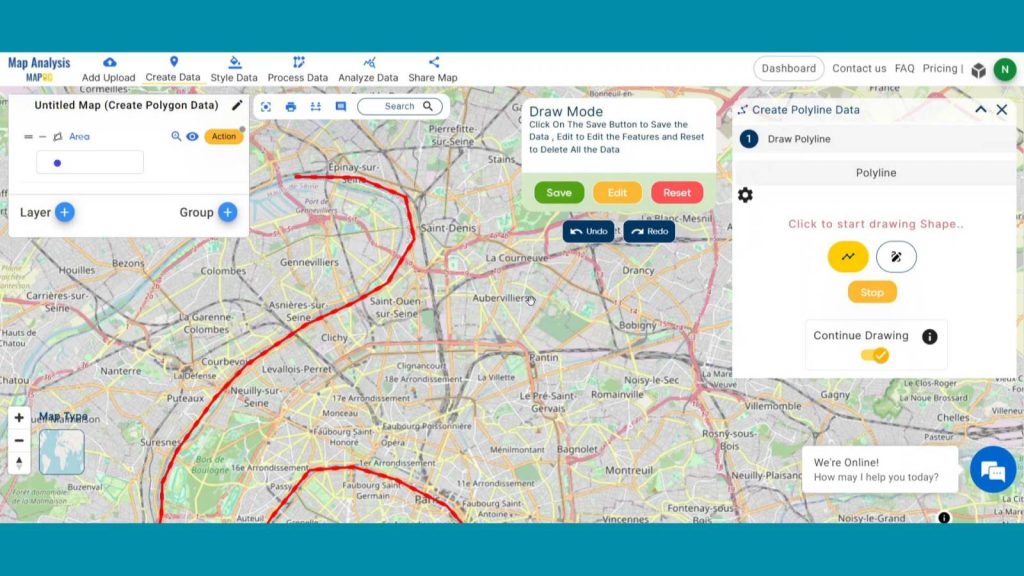
In GIS, line features represent linear entities such as roads, rivers, or pipelines, characterized by connected sets of coordinates. They are pivotal for mapping transportation networks, utility corridors, and natural features. Line features aid in route planning, environmental monitoring, and infrastructure management for enhanced spatial analysis and decision-making.
Dive into the world of biosphere reserves with our “Create Biosphere Reserves Map: Iconic Fauna Representation with GIS“! Discover how utilizing GIS to create point data enhances conservation efforts and promotes biodiversity within these vital ecosystems.
Step 3: Create Point Data
Click on Create data and then click on “Create Polyline Data”
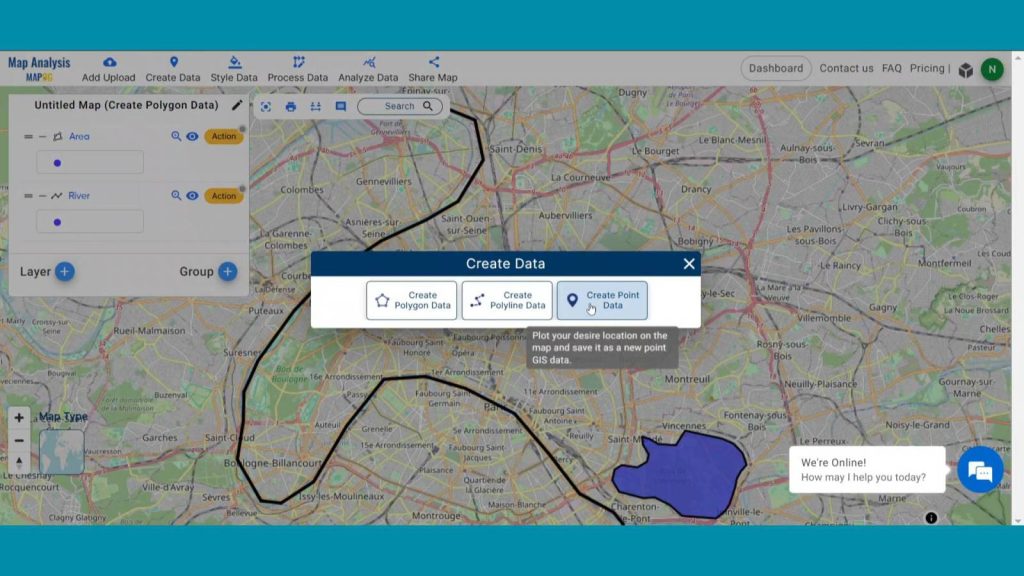
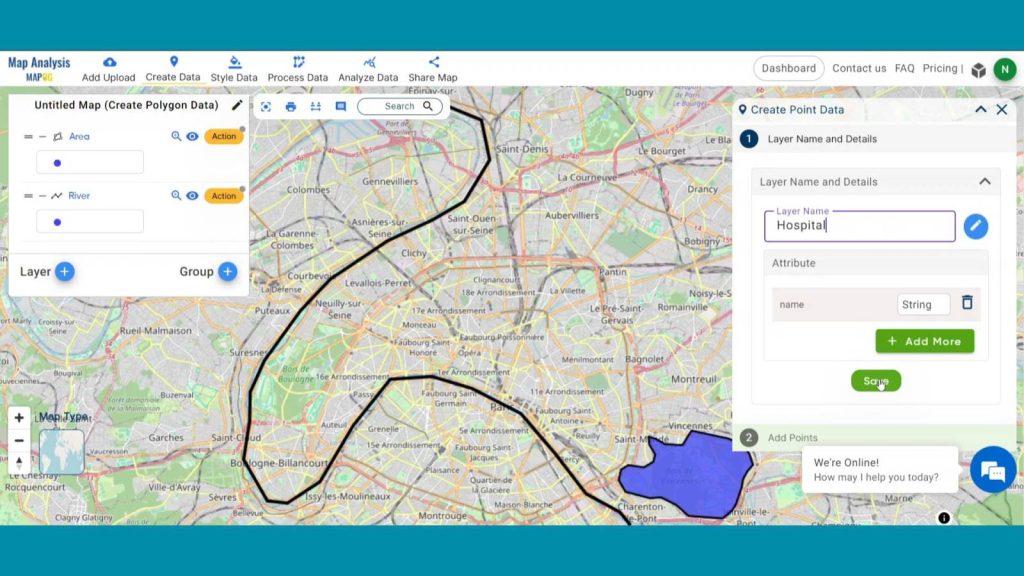
Provide suitable layer name and hit save.
Provide suitable Select any icon that matches your interest. Then You can either drop points or search addresses, then continue drawing. Then start digitizing.
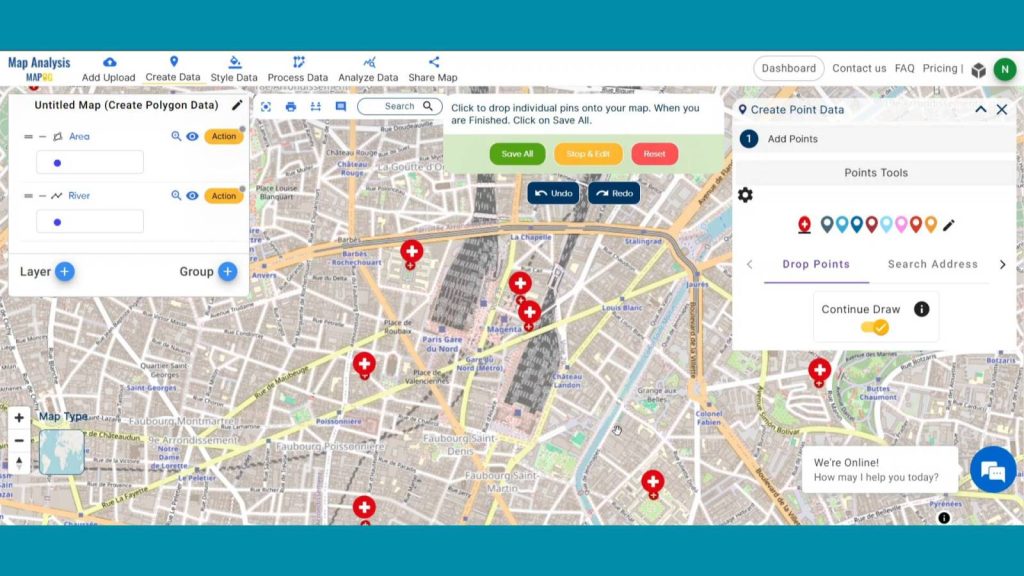
Lastly hit save to save the entire point data on map canvas.
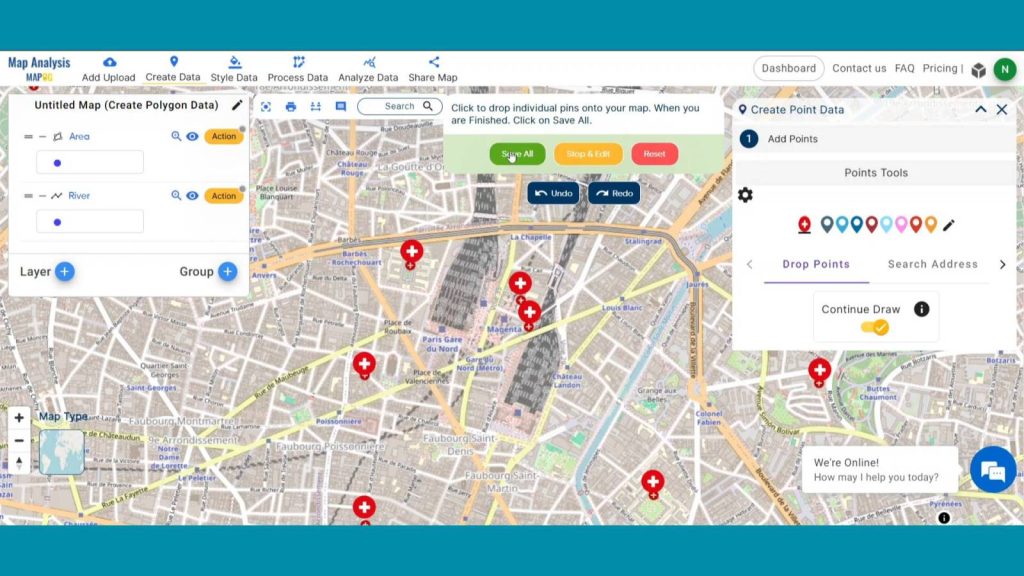
In GIS, point feature’s pinpoint specific geographic locations, defined by coordinates. These serve to represent discrete entities like landmarks or utility poles. Point features find applications in mapping infrastructure, tracking environmental monitoring stations, and identifying key locations for analysis, aiding in spatial decision-making and resource management.
As the narrative unfolds, venture into the realm of urgent response with “Fast Emergency Response: Using GIS and Isochrone Maps for 10-Minute Ambulance Arrival.“
Step 3: Analyze final result
With our map now enriched with details, let’s make those final adjustments. The Create Data tool in MAPOG serves to generate new spatial datasets, allowing customization of maps and definition of specific geographic features. It is crucial for tailoring analyses to diverse mapping requirements.
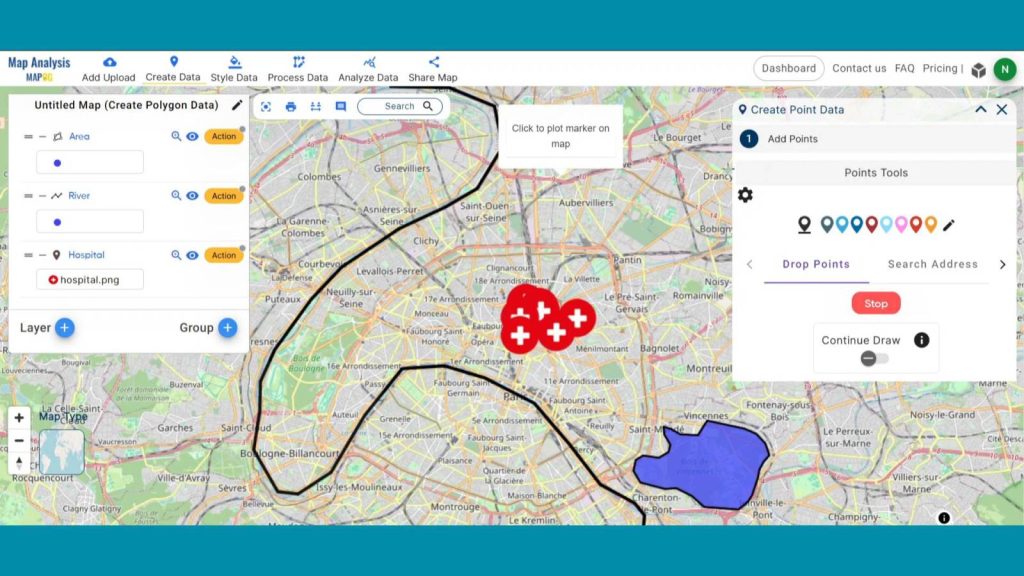
Major Findings
Custom Spatial Datasets: Create Data tool enables the generation of custom spatial datasets, tailoring maps to specific needs.
Geographic Feature Definition: It allows users to define and incorporate specific geographic features for accurate representation.
Versatile Mapping: The tool enhances mapping versatility, accommodating diverse data requirements and analyses in MAPOG applications.
Domain and Industry
This map is a powerful tool for Infrastructure Development, Environmental Conservation, Emergency Management and beyond.
Conclusion
In conclusion, MAPOG’s Create Data tool empowers users to customize spatial datasets, fostering versatility across industries. It’s pivotal for precise mapping, enabling informed decision-making and tailored analyses.
Here are some other blogs you might be interested in
- Protecting Wetlands: Guide to Create GIS Map for Nature
- Mapping Tiger Attack Hotspots – Create an Online Map and Share
- Make Routes for Military Aerial Planning- Through Bearing angle and Distance calculation – Online Route Compass
- Mapping Healthcare Efficiency: GIS Buffer Analysis of Hospital Locations
- Add WMS- Two step online view of WMS layer on a map
- Plot ATM locations on a map and embed on your website
- Map habitat locations of endangered animals & keep track of their living
1 thought on “Create Point, Line, Polygon on Map”