Understanding water flow patterns is crucial in hydrological analysis, and extracting drainage networks accurately is key to this endeavor. This article is all about Extracting and Creating Drainage Network Maps for Hydrological Analysis. With the additional support of MAP OG’s MAP ANALYSIS tool, users gain enhanced insights and efficient mapping solutions. Let’s explore this essential technique, empowering researchers and professionals in their hydrological assessments.
KEY CONCEPTS
Our goal is to extract the drainage basins from the map using the clip tool. This extraction can be useful for further analyses like Flood Risk Assessment, Ecological Conservation, etc. This extraction will help in Protecting Wetlands: Guide to Create GIS Map for Nature and also knowing the tiger habitats and Mapping Tiger Attack Hotspots – Create an Online Map and Share. For Demonstration purposes, we have taken the major rivers of Madagascar. All the GIS data used are available in MAPOG GIS DATA.
Steps for the Extraction of the Drainage Network.
Below are the steps to follow to Extract the Drainage networks using the Clip tool from MAPOG Map Analysis.
Step 01: Adding the DATA
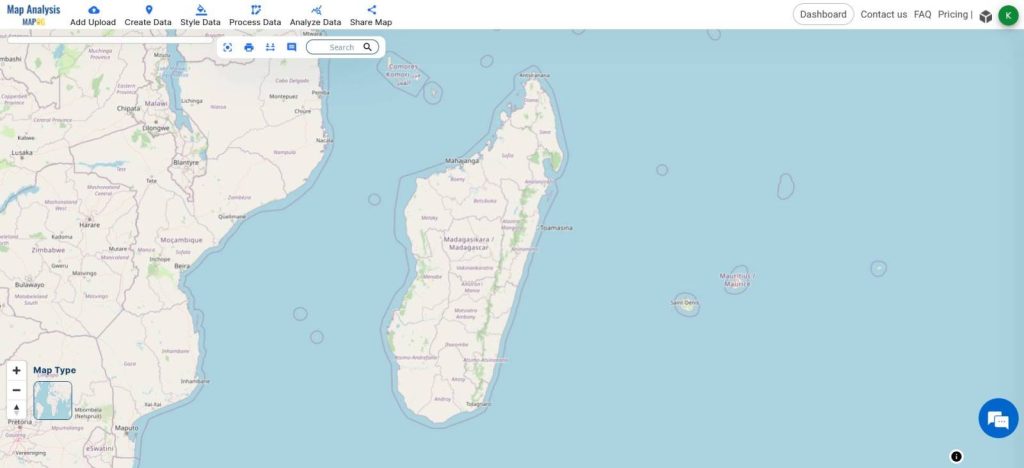
- Click on the ADD UPLOAD button from the top left.
- Click Add GIS Data
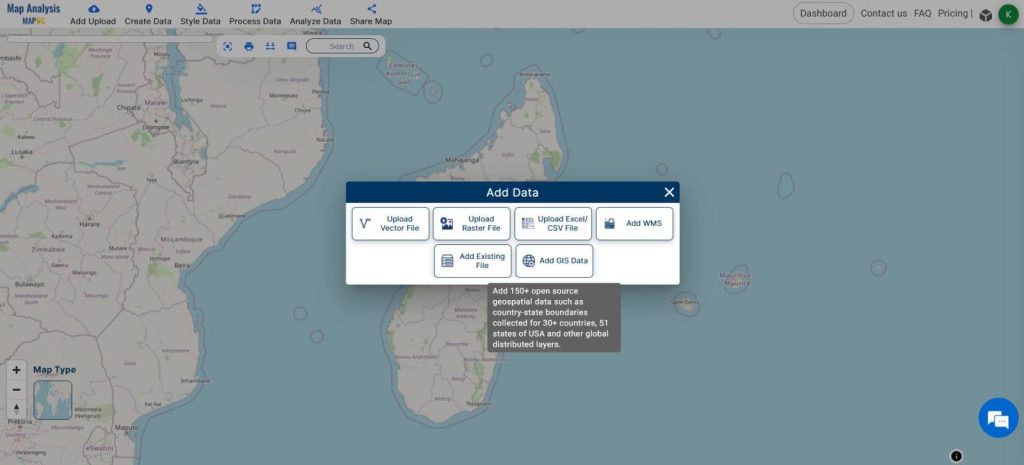
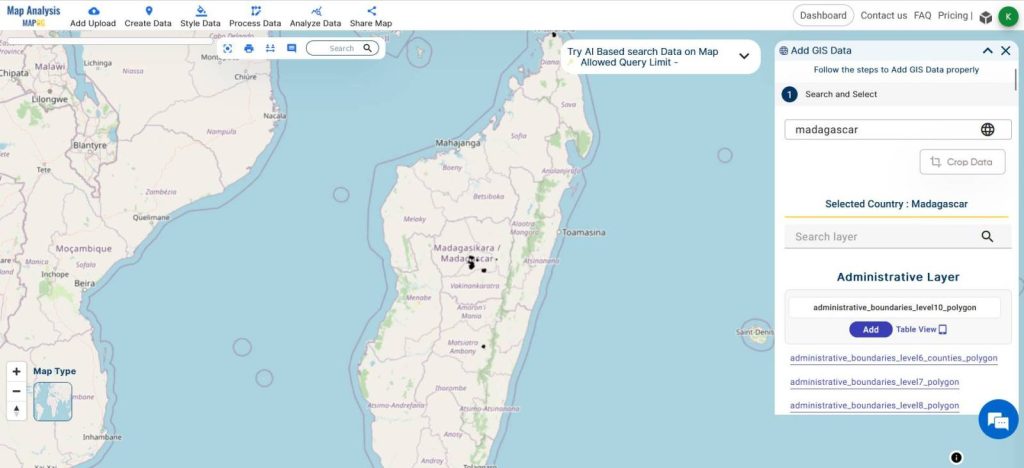
- Search for the country
- Select the River Line Layer and click ADD
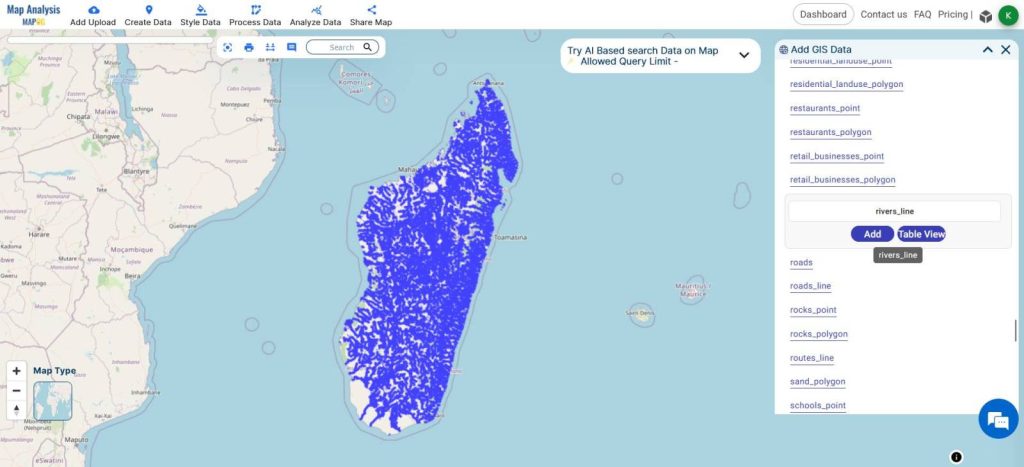
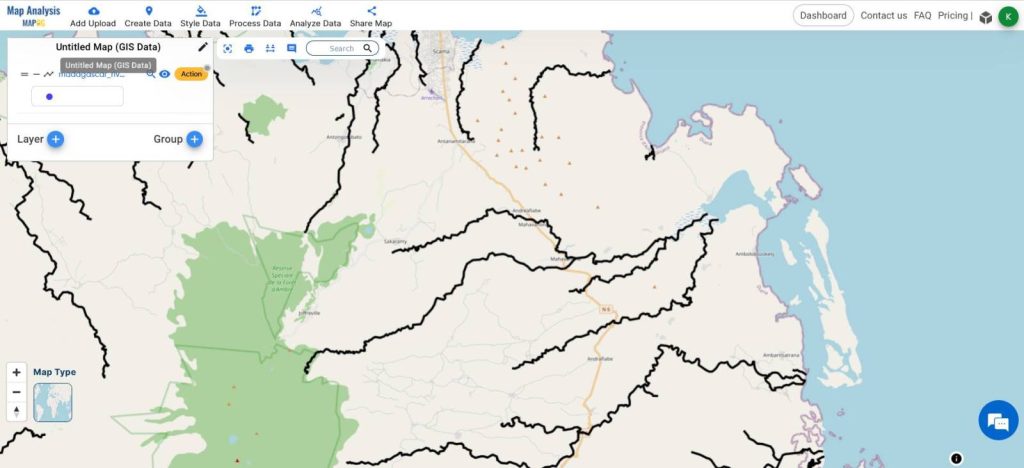
We can identify a drainage network by clean observation. A drainage network is usually a chain of streams that drains into a single point of output. Select a drainage network of your choice and,
02: Extracting using Clip Tools.
- From the Process Data toolbar, click on the Clip tool.
- Select the River layer from the Select layer option on the right side.
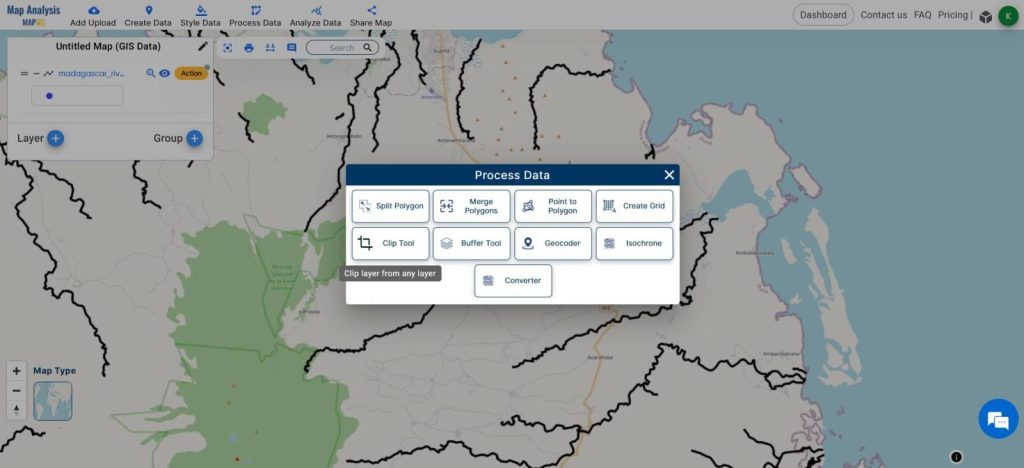
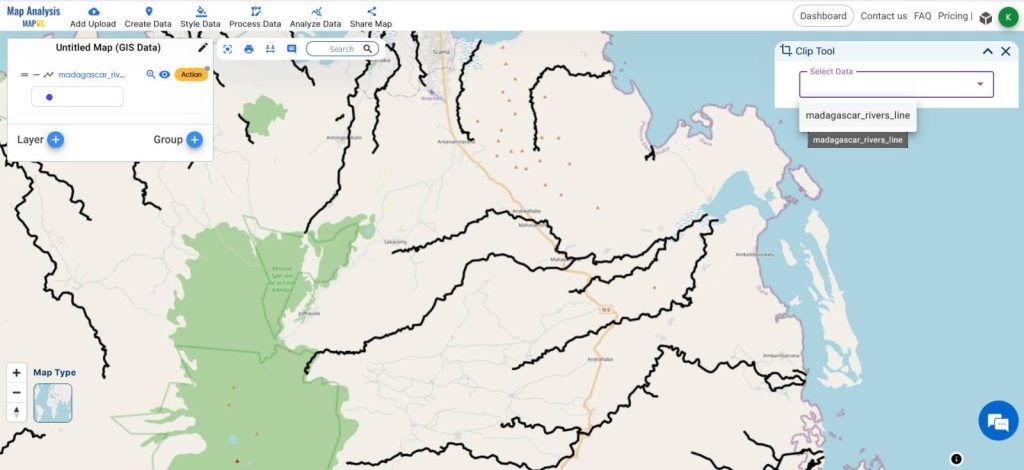
- Click on Start Drawing shape and carefully create a polygon around the stream network.
- Once done, double-click to lock in the polygon, and click Submit.
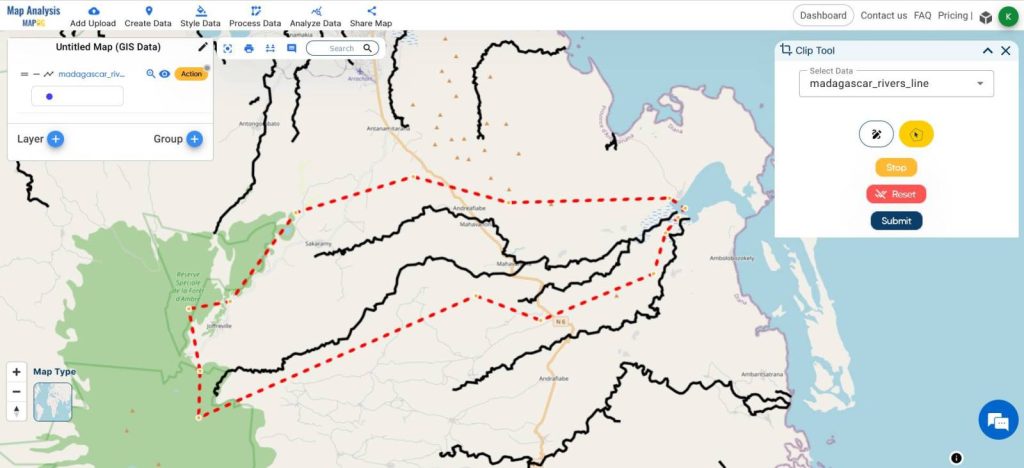
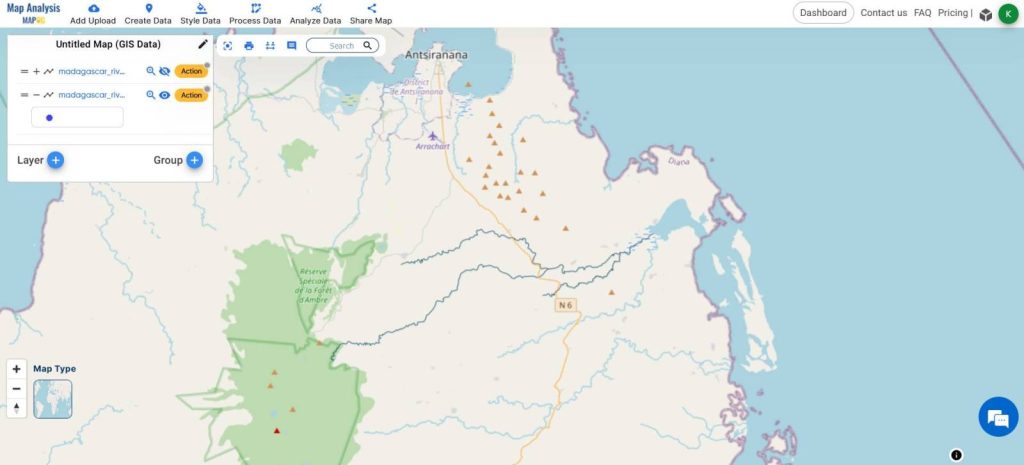
A new layer will be created of the extracted drainage network.
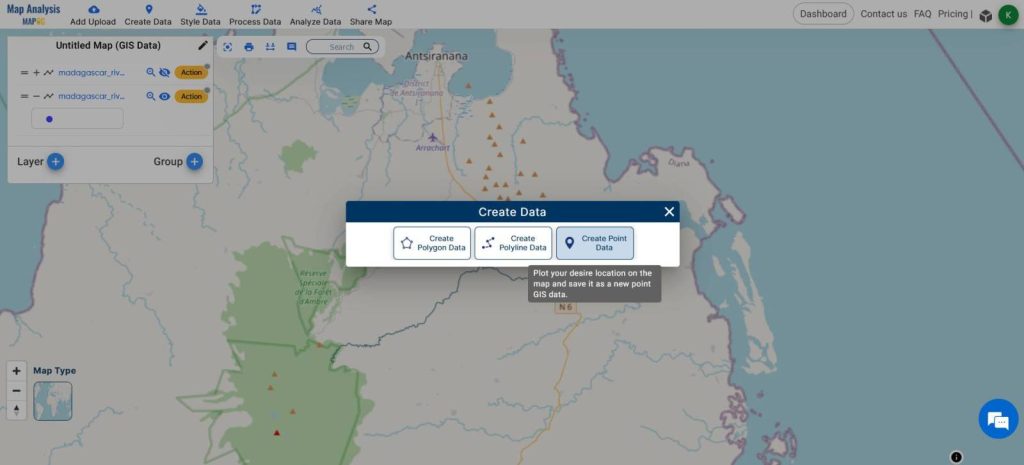
- From the Create Data, Click on the Create Point feature.
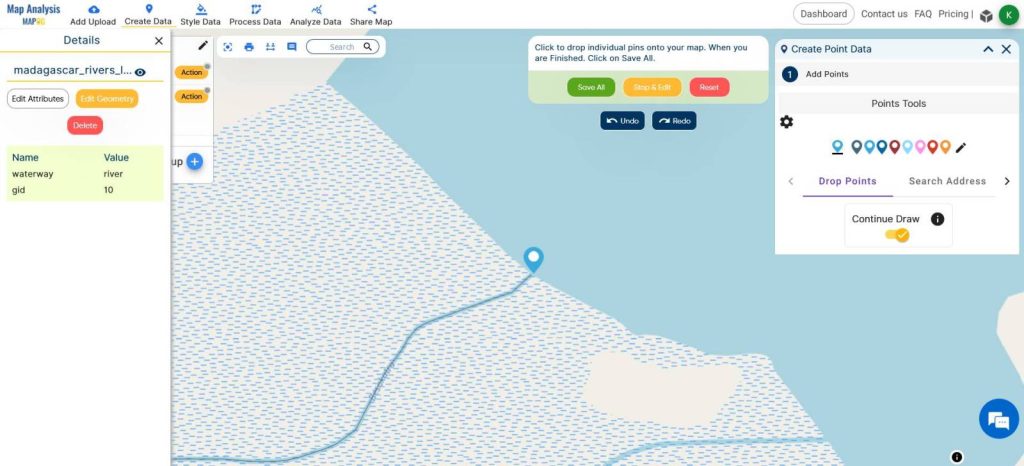
- Create a point on the output of the network to mark the single output point of the entire drainage network.
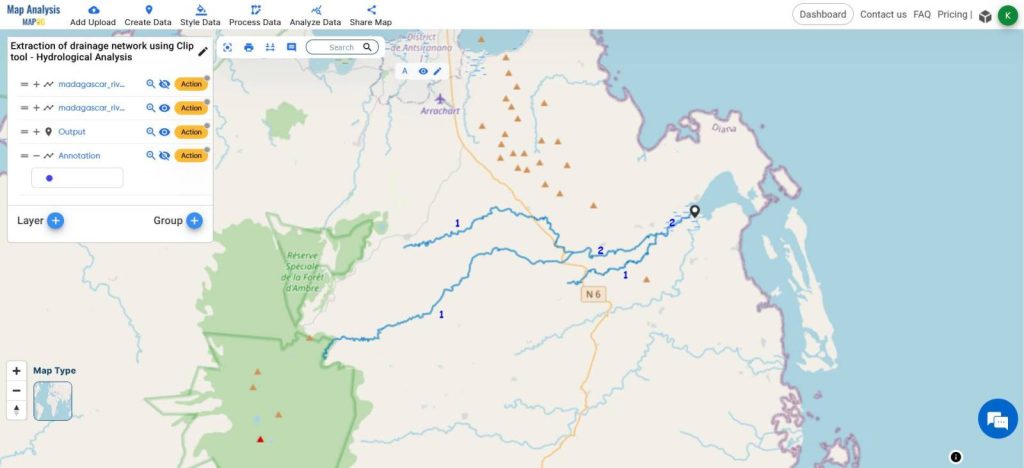
You can classify the stream orders using the annotation tool. Usually, the streams begin with 1st order streams, when two first-order streams combine, a second-order stream forms and the trend continues.
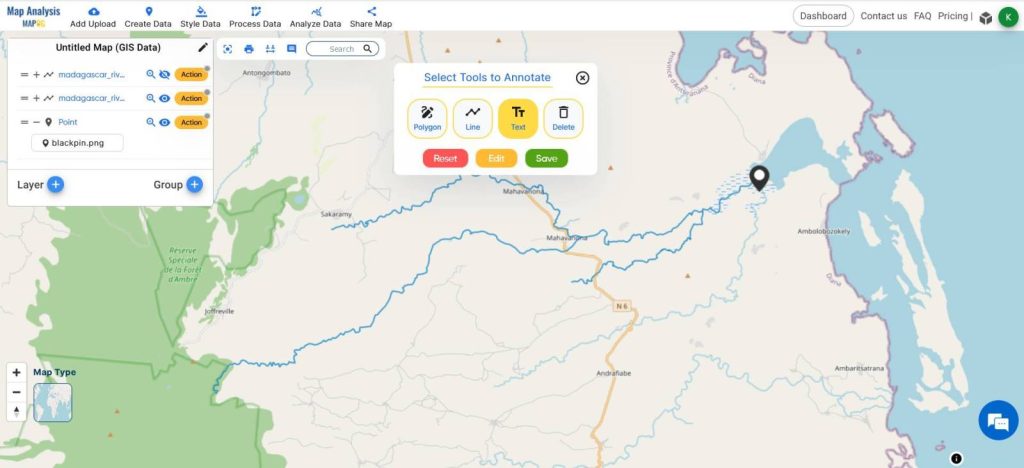
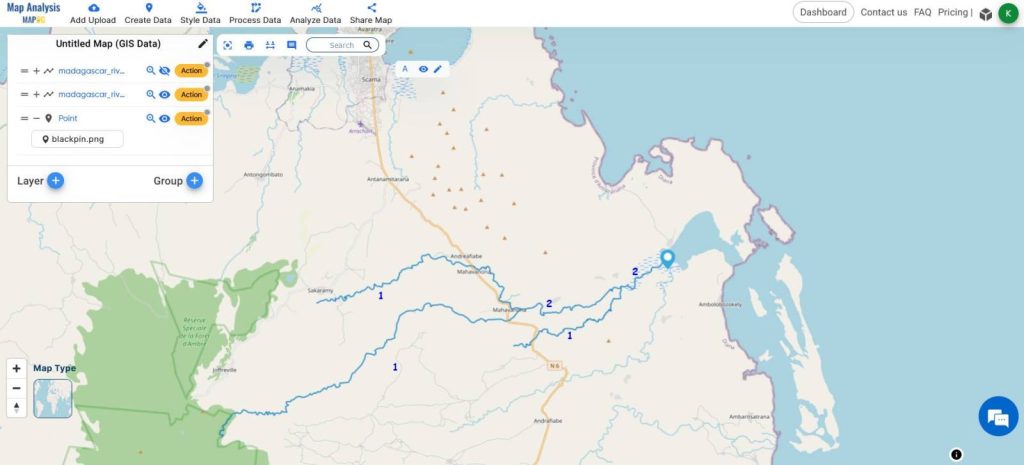
This is the Final Map.
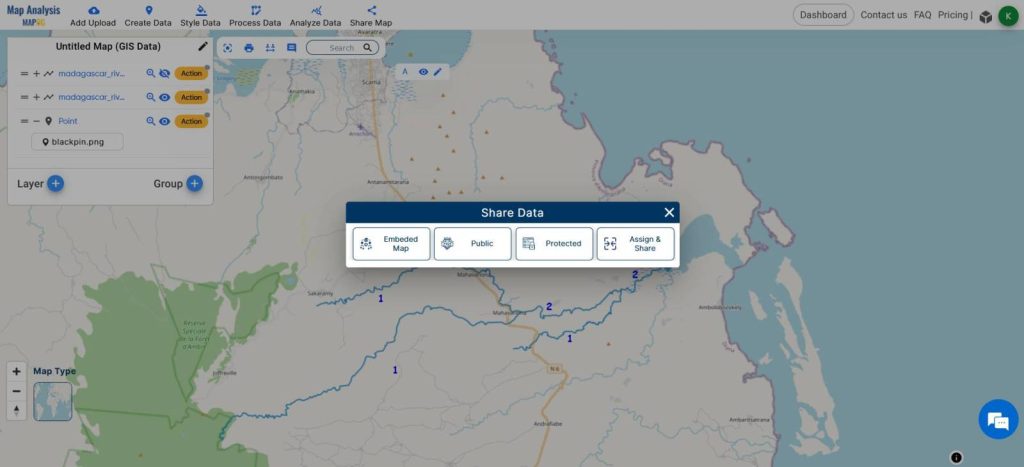
You can share the final map using the share map tool.
MAJOR FINDINGS
- The MAPOG MAP ANALYSIS helps to extract the drainage networks with the clip tool feature.
- We can label the streams using the annotate tool.
- This extraction serves as a base for many further analyses like flood assessment, ecological conservation, etc.
BENEFICIAL DOMAIN: Hydrology
In the domain of hydrology, the extraction of drainage networks holds immense significance. By employing the Clip tool within GIS software, hydrologists can swiftly and accurately delineate these networks, facilitating a deeper understanding of water flow dynamics.
Furthermore, the integration of MAP OG’s MAP ANALYSIS tool enhances the process, providing comprehensive insights into terrain characteristics and facilitating informed decision-making in water resource management. This synergistic approach not only streamlines the extraction process but also empowers hydrologists with valuable data for conducting thorough hydrological analyses.
For any inquiries or support needs, feel free to contact us at support@mapog.com to ensure seamless assistance and optimize your infrastructure protection strategies.
CONCLUSION
In conclusion, the utilization of the Clip tool for extracting drainage networks in hydrological analysis is a fundamental process with far-reaching implications. With the seamless integration of MAP OG’s MAP ANALYSIS tool, this method gains unparalleled depth, providing invaluable insights into terrain characteristics and enabling informed decision-making in water resource management. Harnessing the power of these advanced tools not only enhances workflow efficiency but also elevates the quality and accuracy of hydrological analyses. As we continue to leverage GIS and mapping technologies, we propel the field of hydrology towards innovative solutions and sustainable water management practices.
GIS DATA USED
VIEW OUR PREVIOUS BLOGS
Mapping Tourist Spots Reachable Within an Hour with Isochrone Maps
Analysis of Forest Fire and Map Risk Areas with Buffer Tool
Mapping highway Buffer and Building Overlap Analysis – Extend Roads Width
Create Map for Real Estate Developer for Best Site Selection