In this exploration, we delve into how MAPOG Map Analysis enhances transportation accessibility in urban areas through the creation of railway access maps. We’ll focus on identifying areas with limited transportation access and prioritising optimal locations for new railway stations. Explore with us as we uncover insights to foster more connected and accessible urban environments.
Key Concept to Creating Railway Access Maps: A GIS Approach
This analysis, a key concept in GIS Analysis in Urban Planning, focuses on identifying areas with limited transportation access and prioritising optimal locations for new railway stations. Discover insights that shape the transportation future of states and cities. Additionally, check out our articles on “GIS Analysis in Urban Planning: Reshaping Transportation Future Insights of state/city” and “Make Routes for Military Aerial Planning- Through Bearing angle and Distance calculation – Online Route Compass” for further insights. Stay tuned till the end of the Article for the data link.
Unlocking the potential of MAPOG Analysis for enhancing transportation accessibility in urban areas is a straightforward process that empowers city planners and transportation agencies.
Let’s walk through a step-by-step example of how we can conduct this analysis:
Step1: Data Upload:
Begin by importing the necessary datasets, including railway line data and city point data.
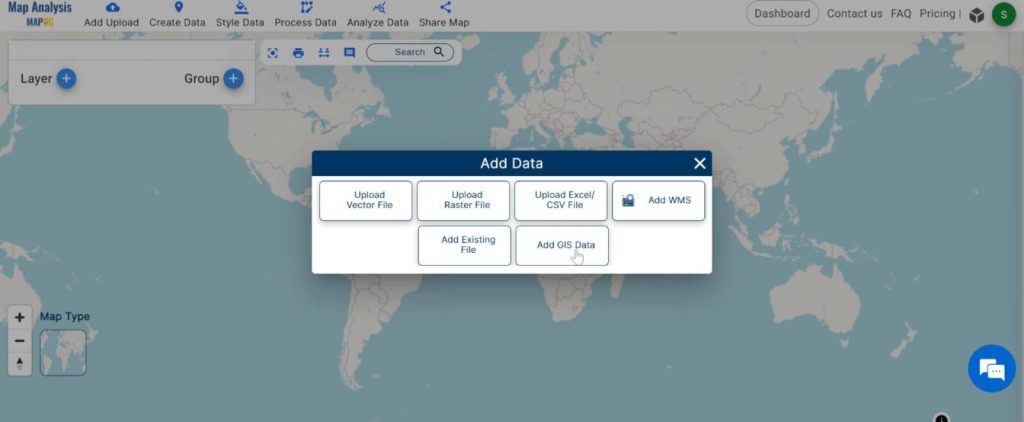
1.Click On the “Add Upload” button and choose the “Add GIS Data” option.
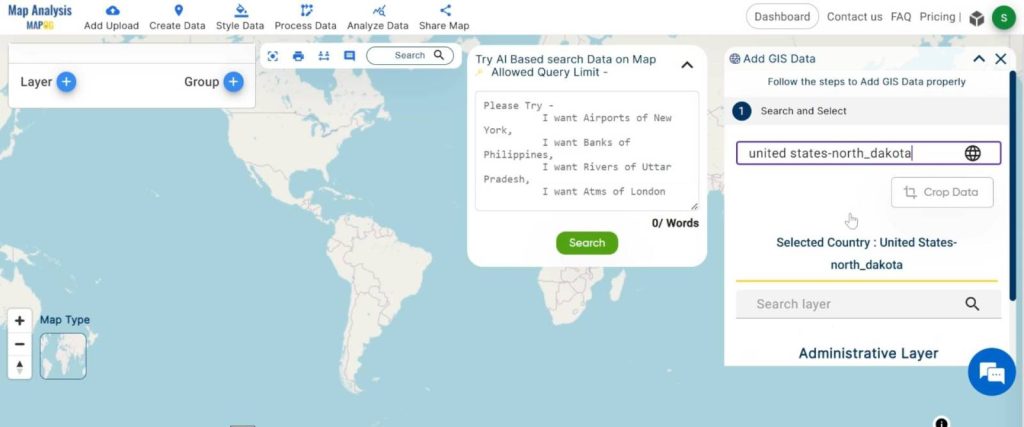
2.Search the country name
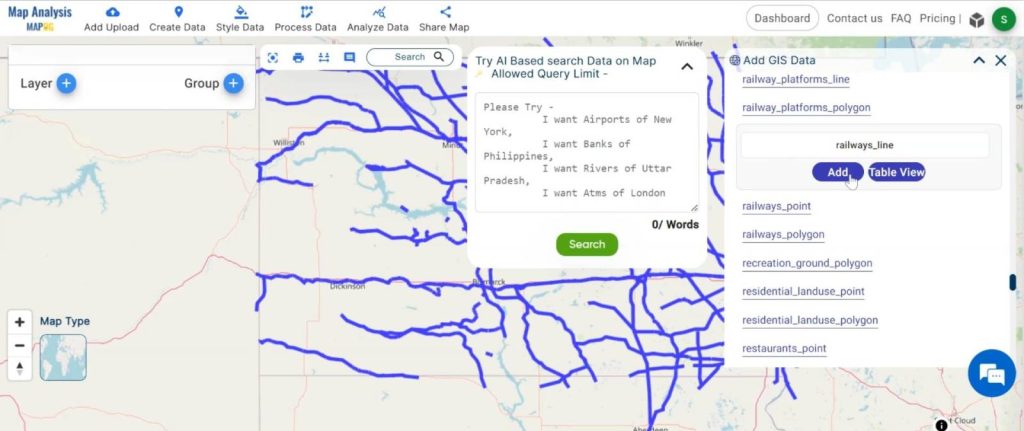
3.Add the Forest and Water Body Data. Click on the “Add” Option.
Step 2: Name the untitled map and Rename the layer:
1.Here you have to name the untitled map
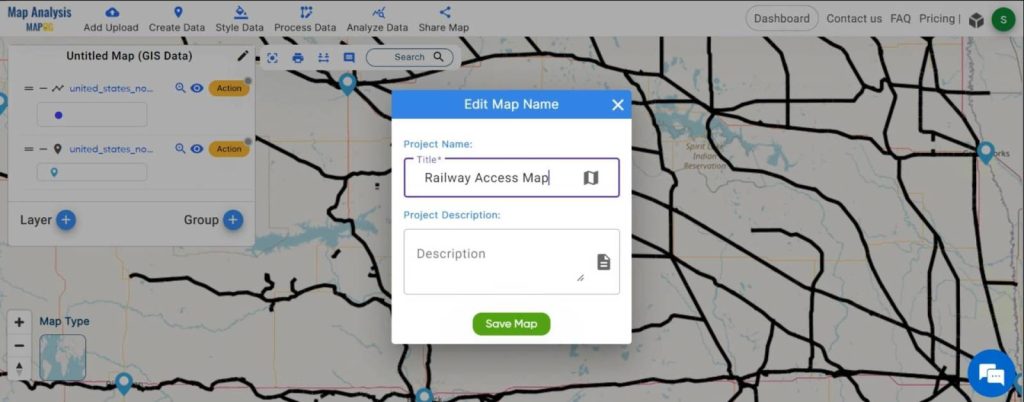
2.Rename the layer
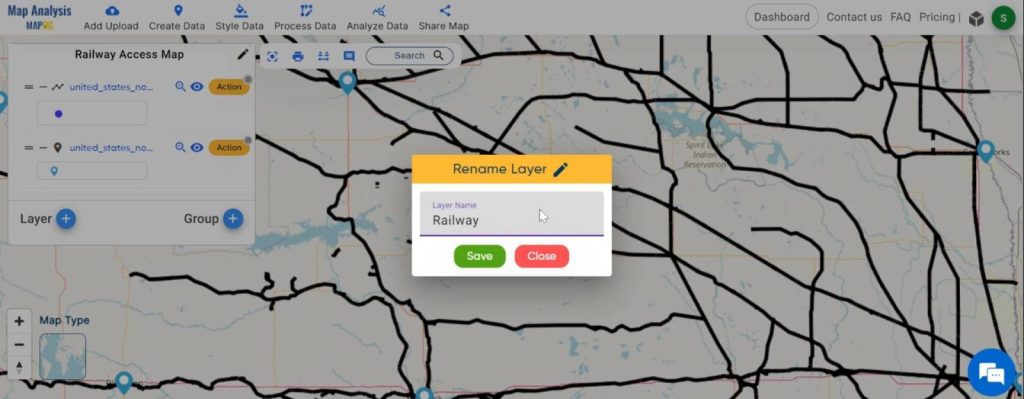
Step3: Style Adjustment:
Customise the visualisation of railway point data to ensure clear and accurate analysis of transportation networks.
1. Click on the ‘Style Data‘ button and choose the “Basic Style” option.
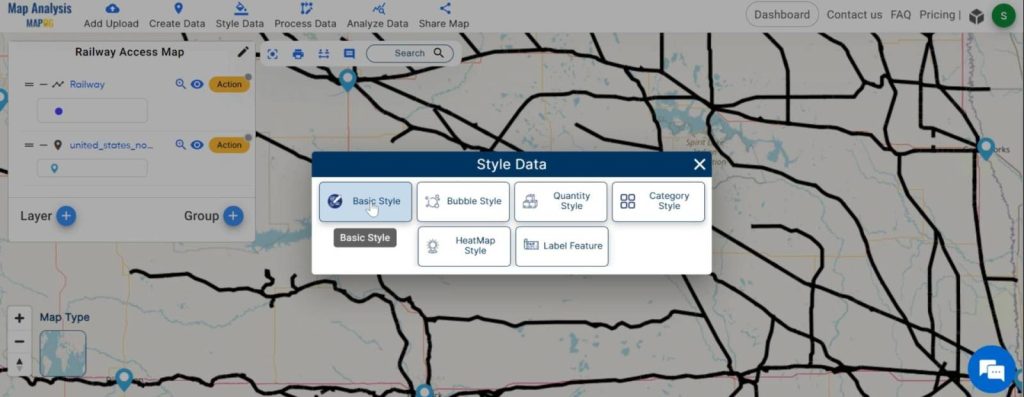
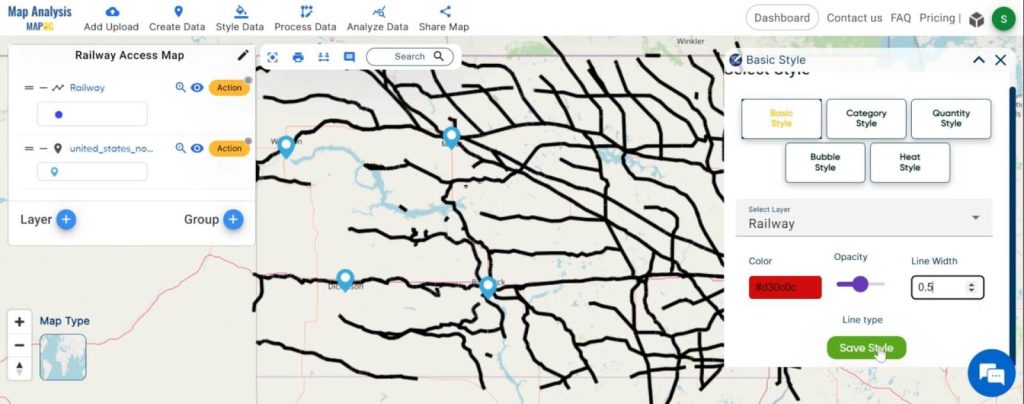
2.You can see the “Basic Style” Tool successfully opened on the right side of the screen.
Here, select the layer. then change the colour and click on the “Save Style”.
Step4: Isochrone Creation:
Generate isochrones for city points to visualise the areas reachable within specific travel times using the existing railway network.
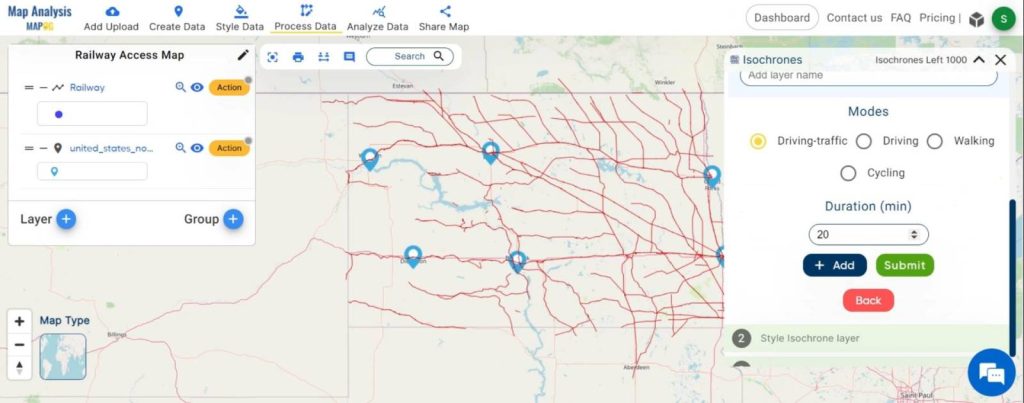
1. Click on the “Process Data” tool. And choose “Isochrones”.
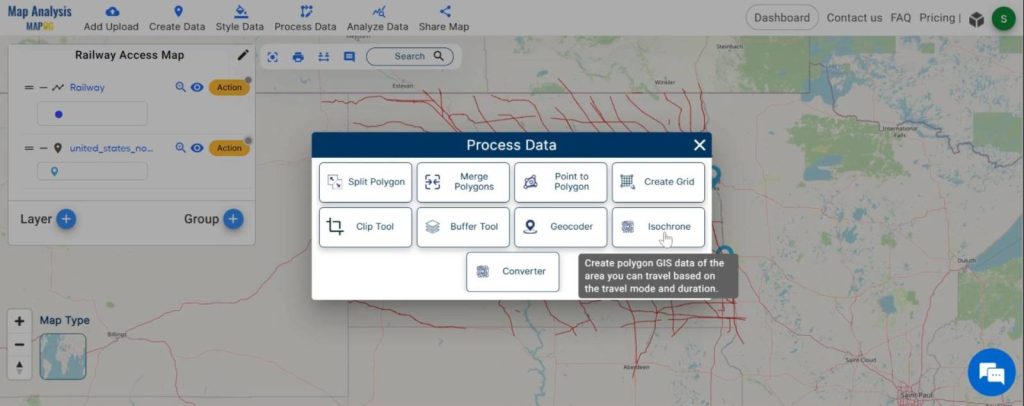
2.Here select the Layer and set Duration. Then click on the “Submit” button.
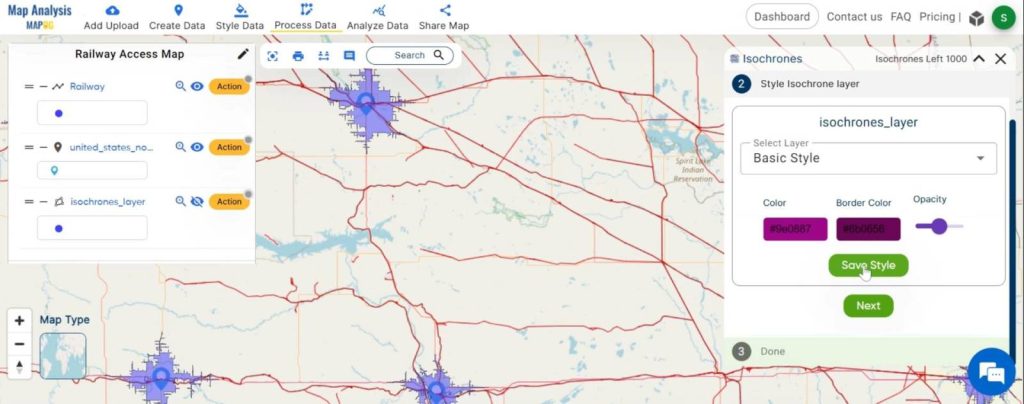
3. Now change the isochrones colour and click on the “Save” button.
Step5: Proximity Analysis:
Utilise proximity analysis to identify the nearest and most accessible railway stations from each isochrone, revealing areas with limited transportation access.
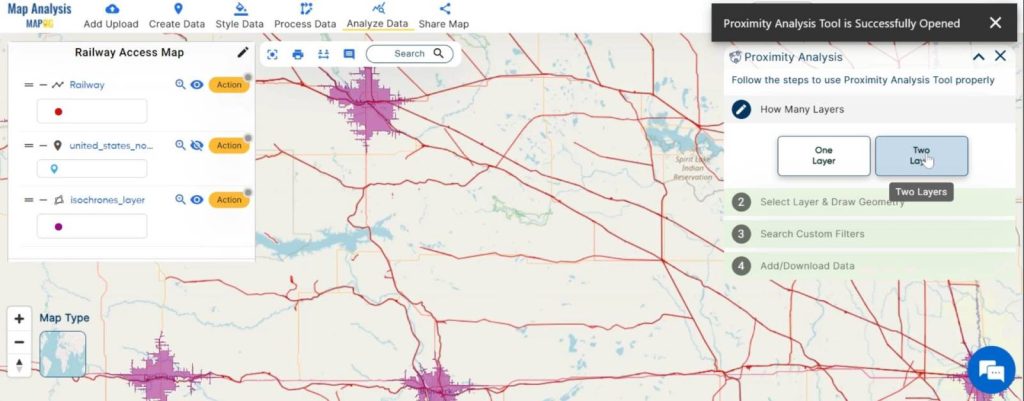
1.Click on the “Analyze Data” button and choose “Two Layer”.
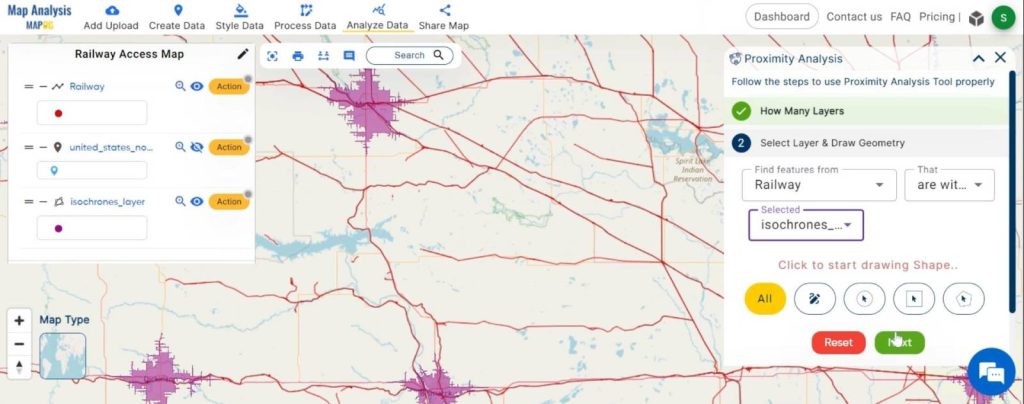
2.Here, select the finding feature and selected layer and click on the “Next” button.
3.Choose the field and write the option and click on the “Get Result” option.
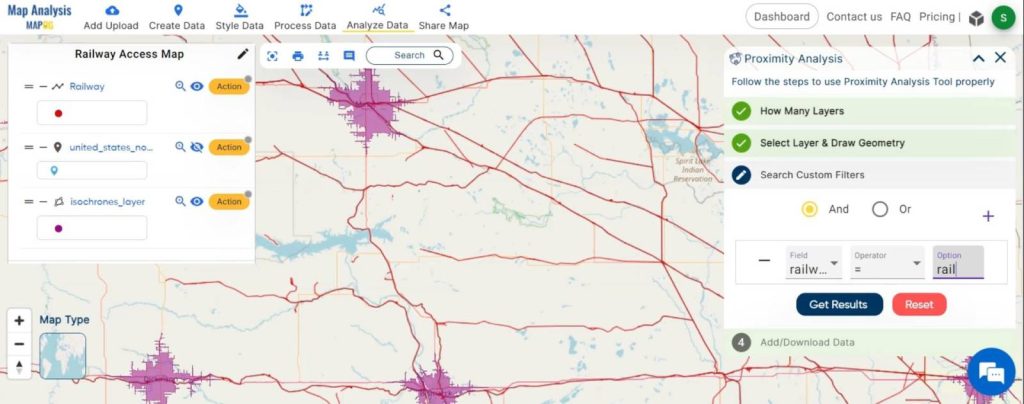
4.We can see the finding feature.
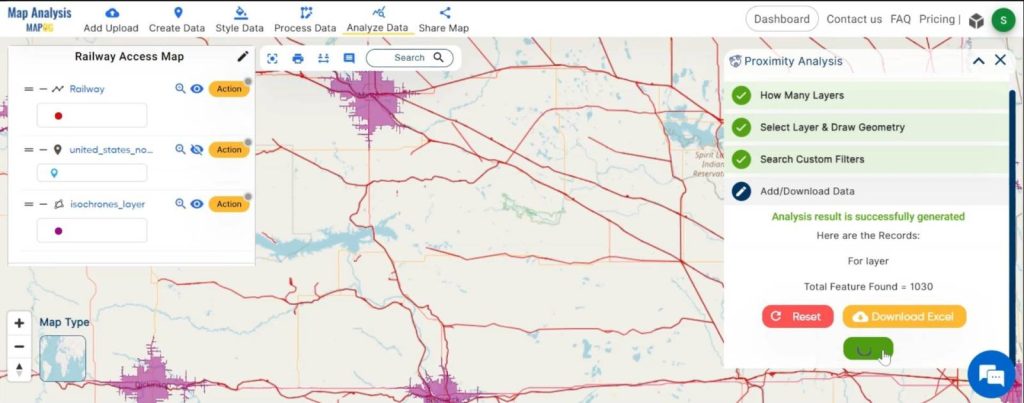
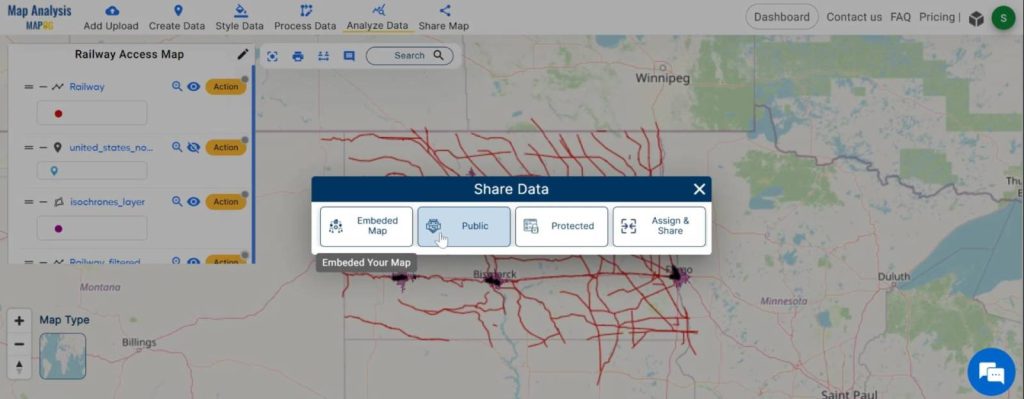
Step6: Export and Share:
Export the generated maps showcasing transportation accessibility for stakeholder evaluation and decision-making.
Major Findings:
- Identified areas within the city with limited access to the railway network, revealing transportation disparities.
- Prioritized optimal locations for new railway stations, addressing identified transportation gaps and enhancing urban connectivity.
- Improved transportation accessibility within the city, promoting smoother mobility, and reducing travel times.
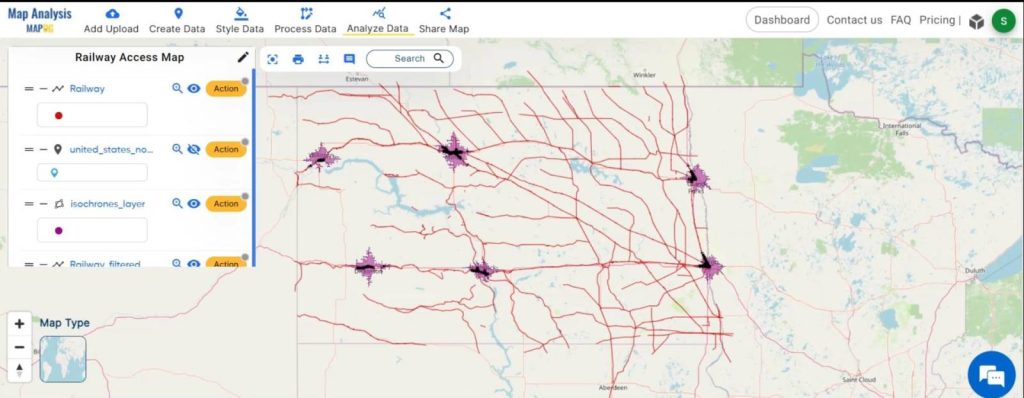
In conclusion, our analysis utilizing MAPOG techniques has provided valuable insights into transportation accessibility within urban areas. By identifying under-served areas and prioritizing optimal locations for new railway stations, we have taken significant steps towards fostering more connected and accessible cities. Through data-driven decision-making and strategic infrastructure development, we can continue to improve urban mobility and enhance the quality of life for residents. Moving forward, continued collaboration among stakeholders will be essential to implement these proposed solutions effectively and ensure sustainable urban development.
Link of the Data:
Explore the data further through our GIS Data product, uncovering valuable information for in-depth analysis and understanding.
Exploring Our Previous Blogs: