Under the heading “Hospital Facility Analysis Through Population Data” this study investigates the intricate relationship between healthcare accessibility and demographic factors. By analysing population data, this research aims to uncover disparities in hospital access, shedding light on critical insights essential for advancing healthcare equity and strategic resource allocation.
Key Concepts to create Hospital Facility Analysis with Population Data
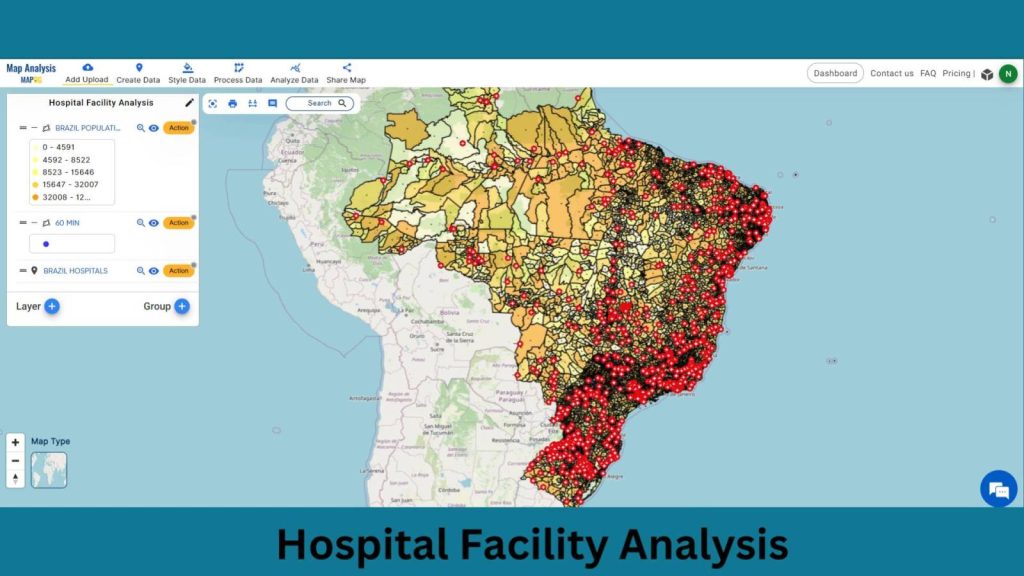
The Hospital accessibility Analysis output map, created using MAP O G, visually depicts coverage of health facilities, providing detailed hospital information. Join us as we walk you through the process of making this effective map on the MAPOG. Let’s get started!
As the narrative unfolds, venture into the realm of urgent response with “Fast Emergency Response: Using GIS and Isochrone Maps for 10-Minute Ambulance Arrival“
Steps to create Hospital Facility Analysis with Population Data
Step 1: Upload Vector Data
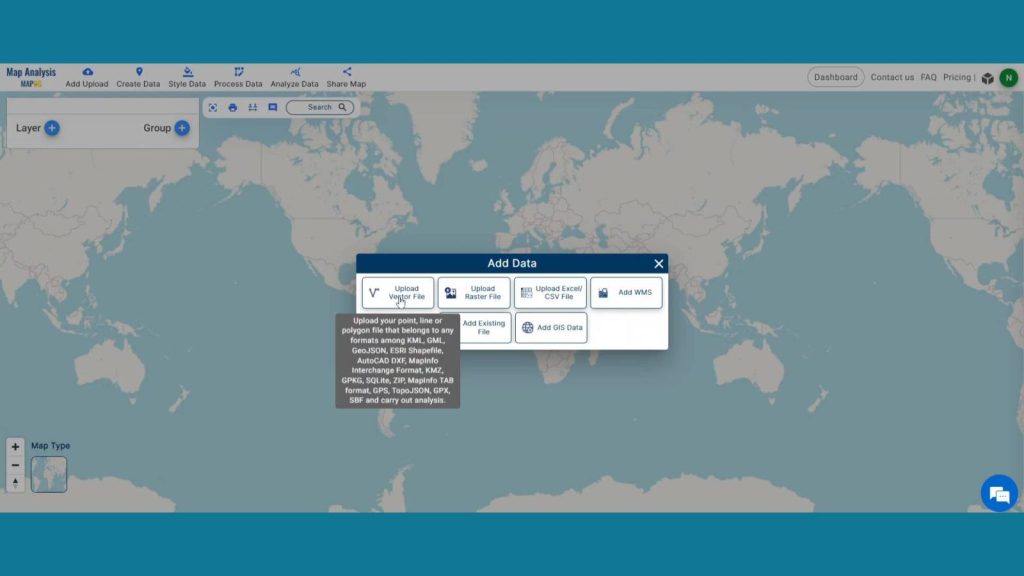
First, navigate to the Map Analysis interface. Then click on the “Add upload” button in the upper left corner. A dialogue box will open. Click on “Upload Vector Data” to add data.
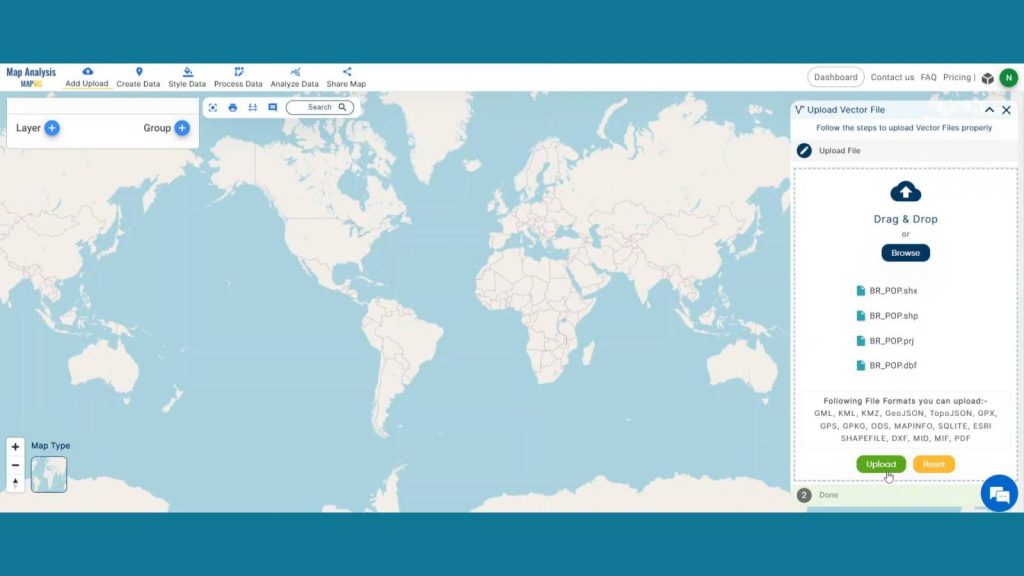
Then browse and upload your base data. Here I have used a Municipality Boundary with population data of a country.
Step 2: Upload Excel/CSV File
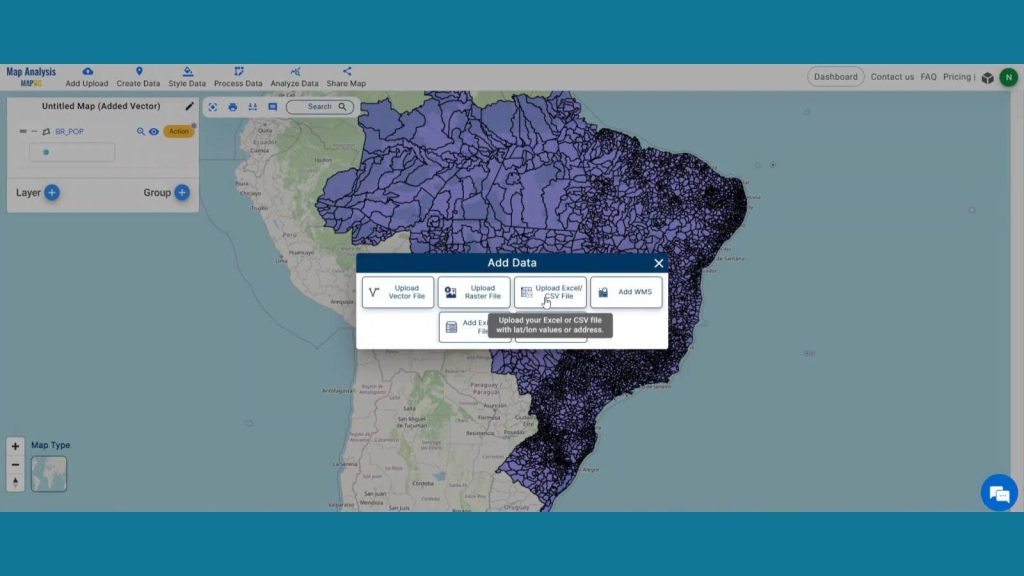
In another way you can also upload your Excel or CSV file and do your personal analysis. To do that first go to the Add upload section then press Upload Excel/CSV Files.
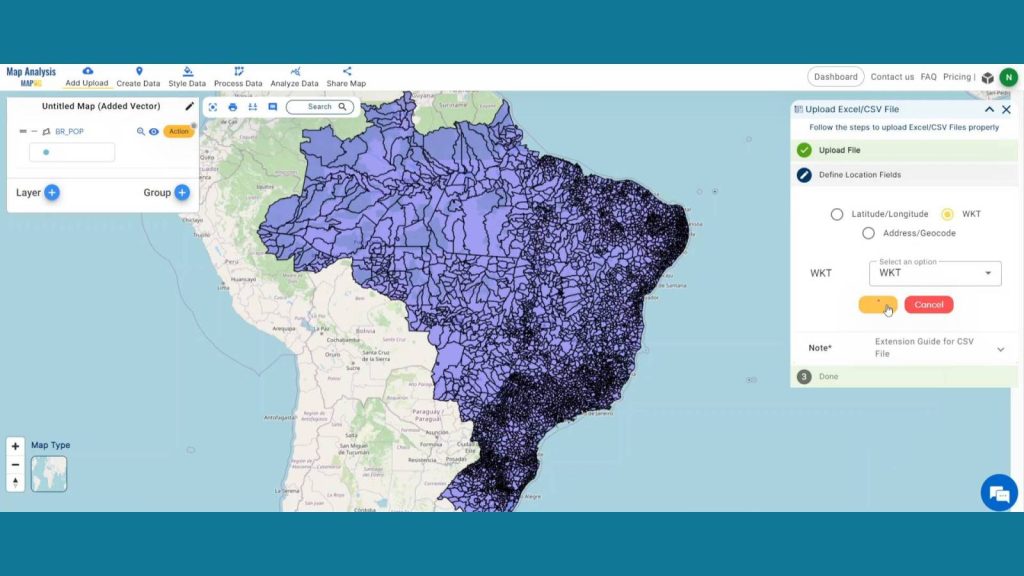
Now, Browse and upload your Hospital Data. Then Select the locational attribute provided in excel. Here In excel file WKT attribute is used, so select WKT and choose WKT from the drop down section and publish the layer.
Then select the Basic style data option and set a color and size for hospital point layer. Then save the style.
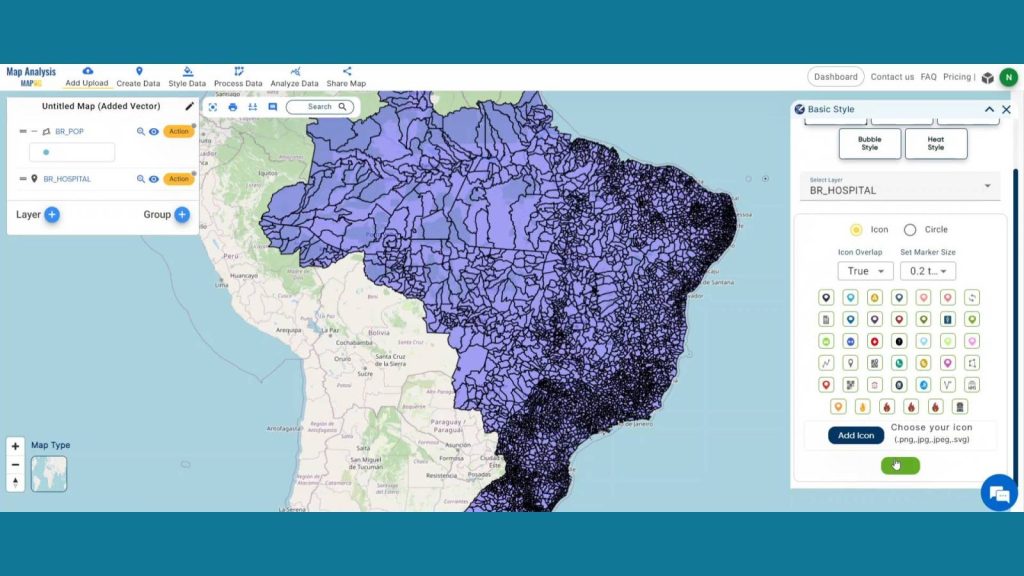
Step 3: Rename Layer
Now, click on the action button of the municipality layer and click on the pencil icon to Rename the layer to “Population”. The same way renames the Hospital point layer as Hospital.
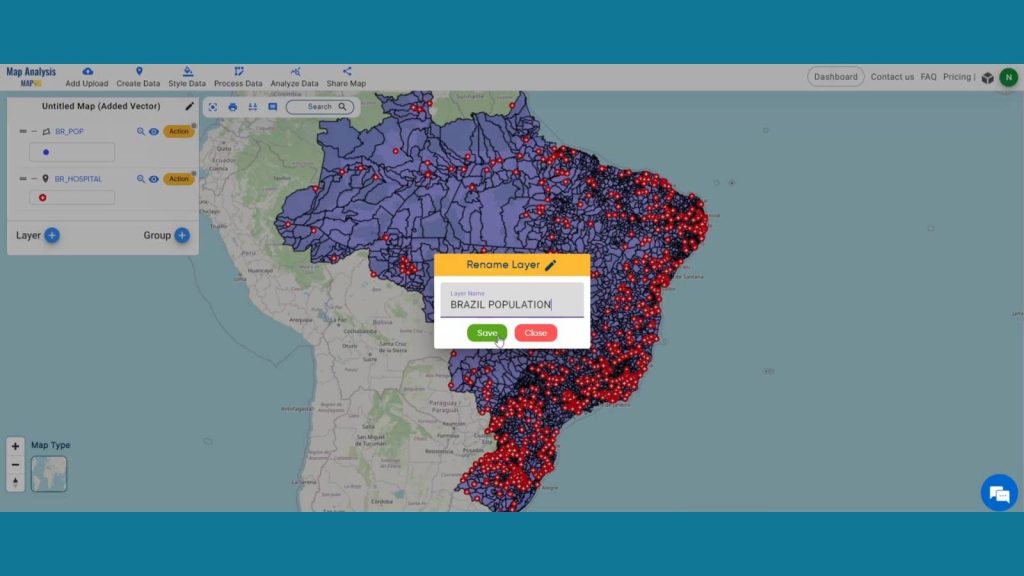
Step 4: Save Project
Now, click on the pencil icon situated right after the “Untitled Map” text to save the project. In the dialogue box write proper name and description that describe the project accurately. And click on save map option. Your project will be saved.
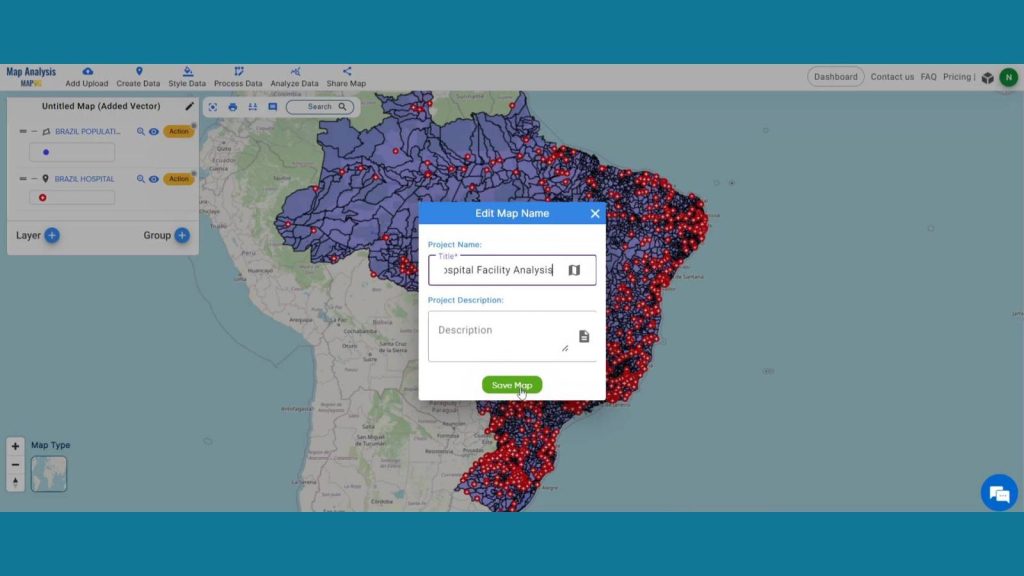
Step 5: Add Thematic Style
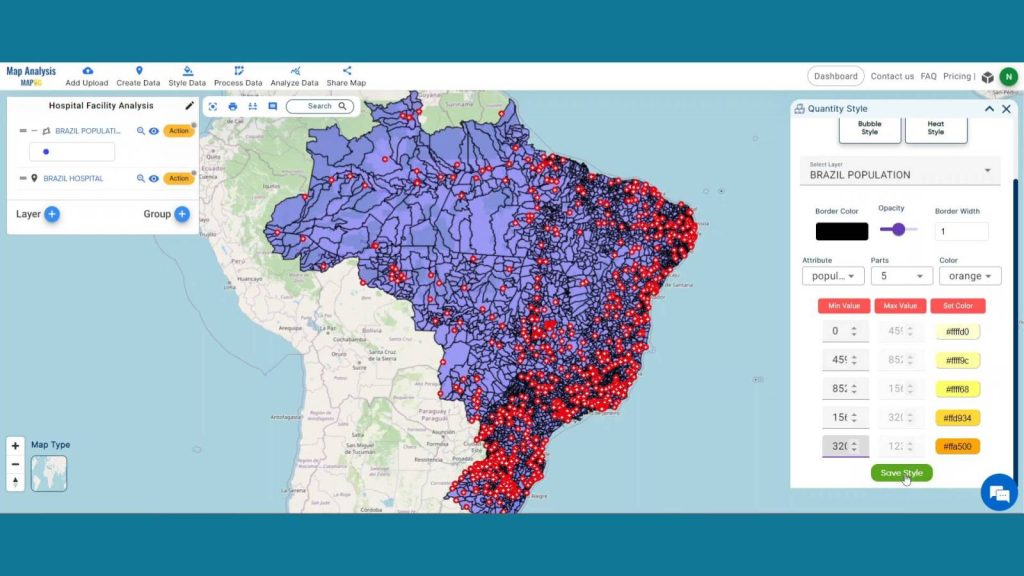
Enhance the visualization of the layer using the Quantity Style option. Now select the style data option from the header and select quantity style from there.
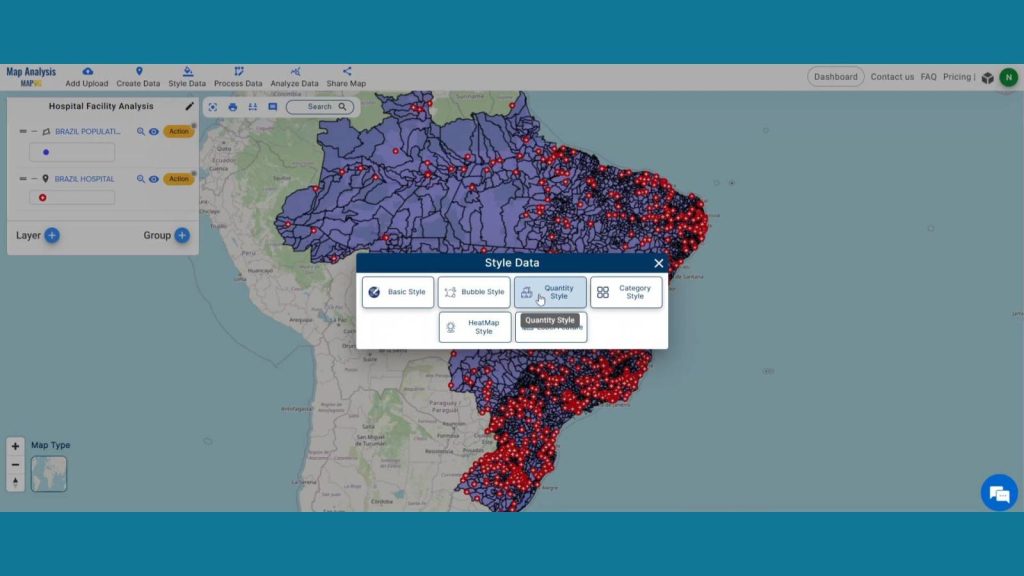
In the select layer option select the population data. Then in the attribute section select the population and arrange the parts and colors as you desire. Then save the style.
Step 6: Create Isochrones
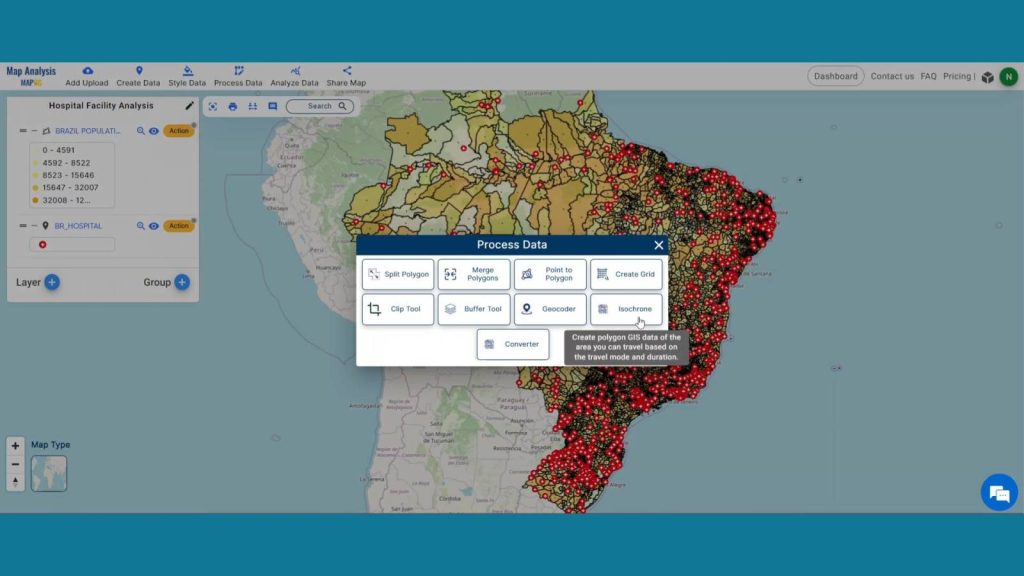
We will now use isochrones to visualize the areas that are reachable within 60 minutes from hospitals. Click Process Data from the header and select Isochrones to accomplish that.
Unlock the secrets of your city’s hidden gems with “Mapping Tourist Spots Reachable Within an Hour with Isochrone Maps” and discover how isochrone maps reveal tourist spots just a stone’s throw away, perfect for spontaneous adventures within an hour.
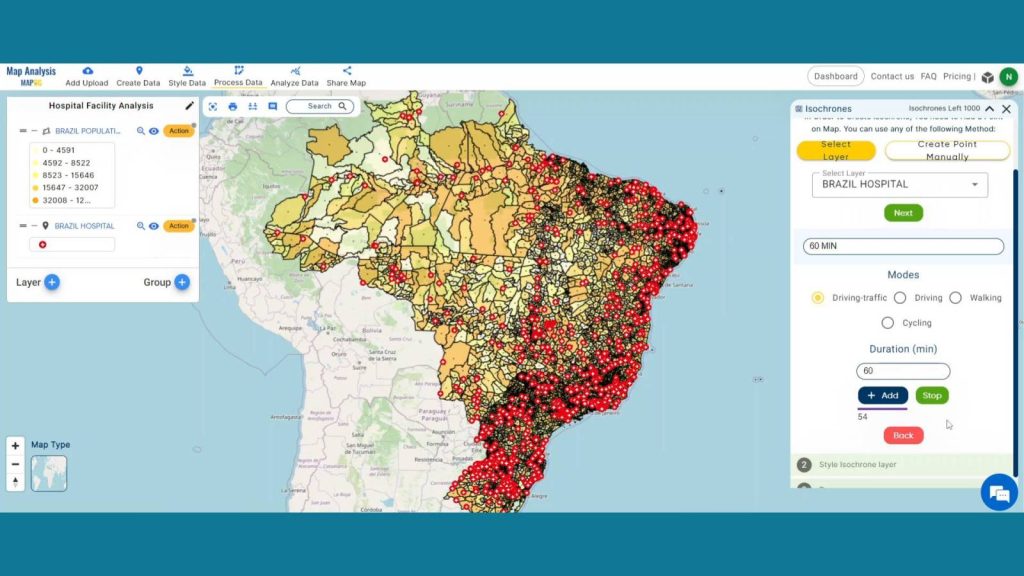
Next in the select layer option select the Hospital layer and after that select the duration time as 60 minutes and mode as drive-traffic and your isochrones will be prepared.
Step 7: Results & Analysis
The analysis revealed significant disparities in hospital accessibility across demographic groups and geographic regions. Areas with higher population densities often exhibited better access to hospitals, while rural and low-income communities faced challenges. Even some high populated areas are not getting benefits of health care. This underscores the need for targeted interventions to improve healthcare equity and access for underserved populations.
Begin your journey by uncovering the secrets of “Protecting Wetlands: Guide to Create GIS Map for Nature” where GIS emerges as a stalwart defender of fragile wetland ecosystems.
Major Findings
Determine the Underserved Areas: Pinpoint regions lacking adequate healthcare access for targeted resource allocation.
Improved Reaction to Emergencies: Improve response times and critical medical assistance through strategically positioned facilities.
Planning for Strategic Infrastructure: Inform the development and placement of healthcare facilities for optimized accessibility.
Domain and Industry
This map is an effective tool for managing public health management, urban planning, and other related fields.
Conclusion
In conclusion, the analysis underscores the critical role of population data in understanding and addressing disparities in hospital accessibility. By leveraging this data, policymakers and healthcare stakeholders can develop targeted interventions to improve healthcare equity, ensuring that all populations have equitable access to essential medical services. Contact us at support@mapog.com with any questions or concerns. This is a big step in the direction of a more knowledgeable, sustainable, and effective future.
Questions
1. How does population density correlate with hospital accessibility in urban versus rural areas?
2. What demographic factors contribute most significantly to disparities in hospital accessibility across different regions?
3. Can GIS analysis identify areas with the highest need for additional healthcare infrastructure based on population data?
4. How does the distance to the nearest hospital vary among different socioeconomic groups within a given area?
5. Are there specific geographic barriers, such as rivers or mountains, that significantly impact hospital accessibility for certain population groups?
Here are some other blogs you might be interested in