As urban areas expand and encroach upon natural habitats, the potential for conflicts between humans and wildlife increases. Understanding and mitigating these risks is important for both human safety and wildlife conservation efforts. MAPOG serves as an invaluable tool in this attempt, enabling the identification and mapping of vulnerable settlements near forests or wildlife habitats. This article explores how MAPOG can be leveraged in mapping wildlife risk for identifying vulnerable settlements near forest.
Key Concept- Identifying Vulnerable Settlements near forest
The buffer tool in MAPOG serves to delineate the surrounding area of forests where wildlife attacks may occur. Through the utilisation of the proximity analysis tool, settlements situated within these areas near forest prone to wildlife attacks can be identified and extracted, contributing to enhanced safety measures. Furthermore, we invite readers to delve into additional articles covering various aspects of forest and wildlife conservation available on our blog, such as “Analysis of Forest Fire and Map Risk Areas with Buffer Tool” and “Mapping Tiger Attack Hotspots – Create an Online Map and Share”. At the end of the article, you will find the links to the GIS data we have utilised here, enabling you to replicate this analysis.
Follow the below process Step-by-step for identifying vulnerable settlements near forest
Step 1: Open Map Analysis
Navigate to Map analysis interface from MAPOG platform.
Step 2: Upload data
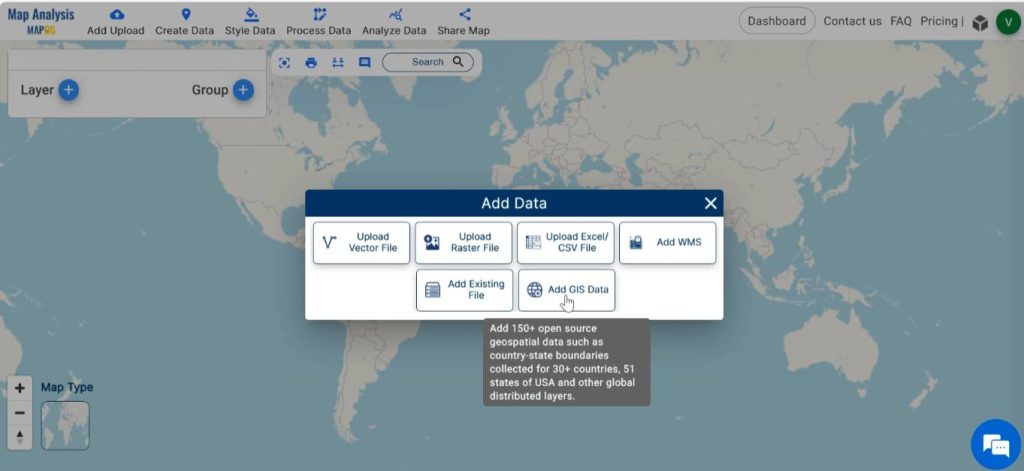
Begin by adding all the data required. For this click on the Add Upload option from the menu bar at the upper left end, and then go to the Add GIS Data option.
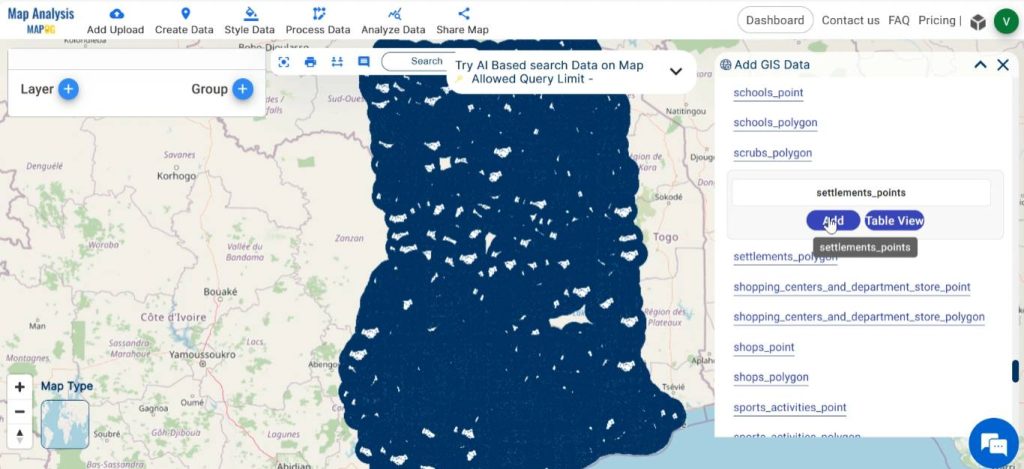
Select the country of your interest. From the built-in GIS data, search for and Add Settlement points and Forest polygon. Table view option facilitates the preview of the data table of the chosen layer.
Step 3: Save map
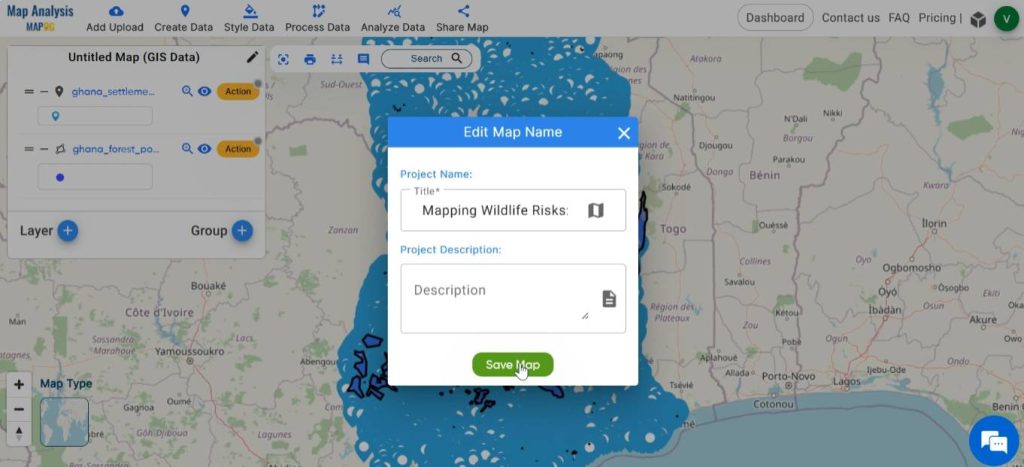
Then save your map with a suitable name. For this, click on the pencil icon near the “Untitled Map” text. Enter a suitable name, and if desired, provide a brief description of your project. Finally, save the map by clicking on the “Save Map” button.
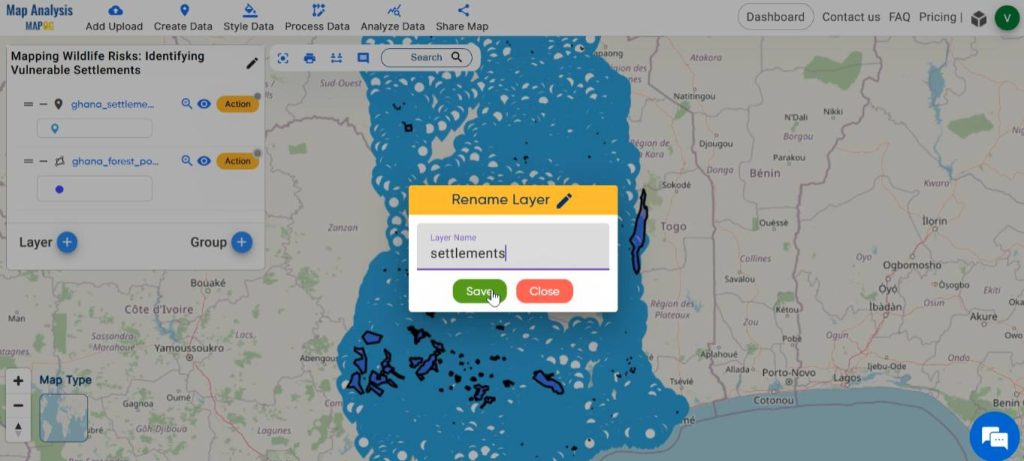
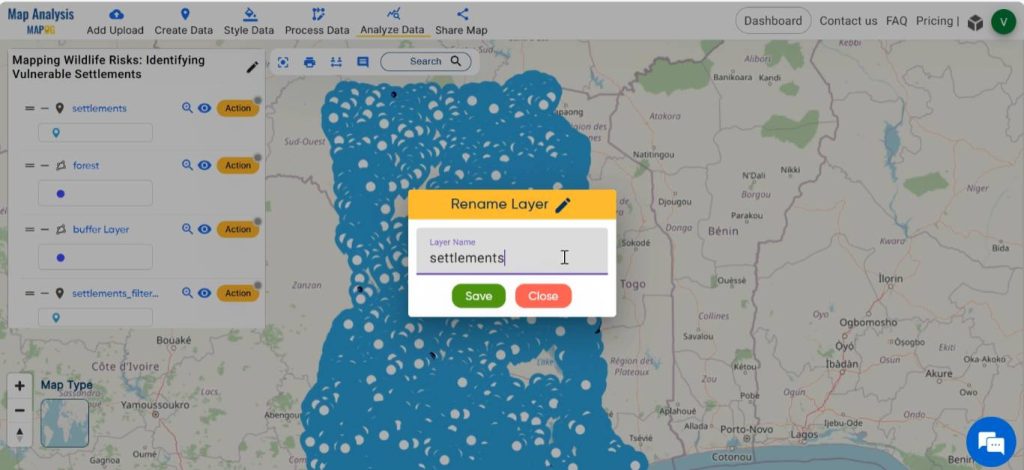
Step 4: Rename Layer
Rename the added layers by clicking on Action near the layer, followed by the pencil icon. Enter a suitable name. Then, click on save.
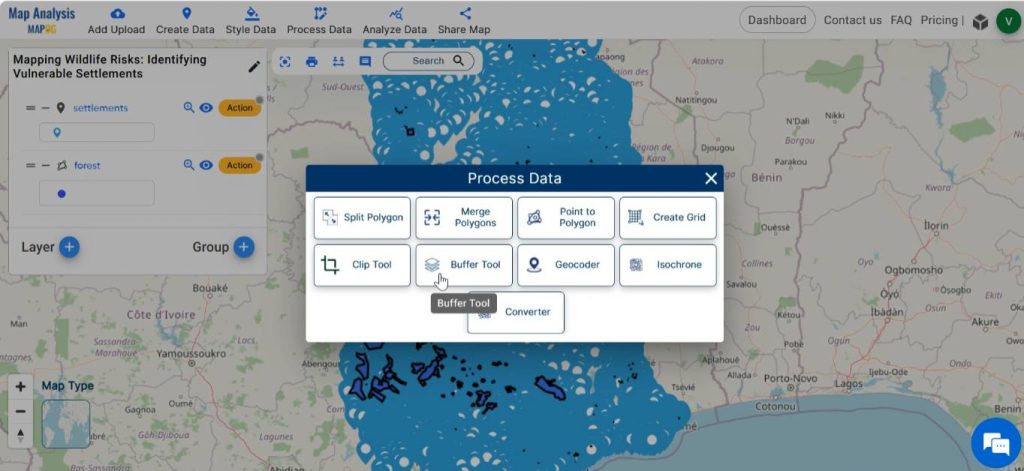
Step 5: Create buffer zone
To delineate the area around forest, which is susceptible to wildlife attack, create a buffer zone around forest polygons. For this, click on Process Data and select the Buffer tool.
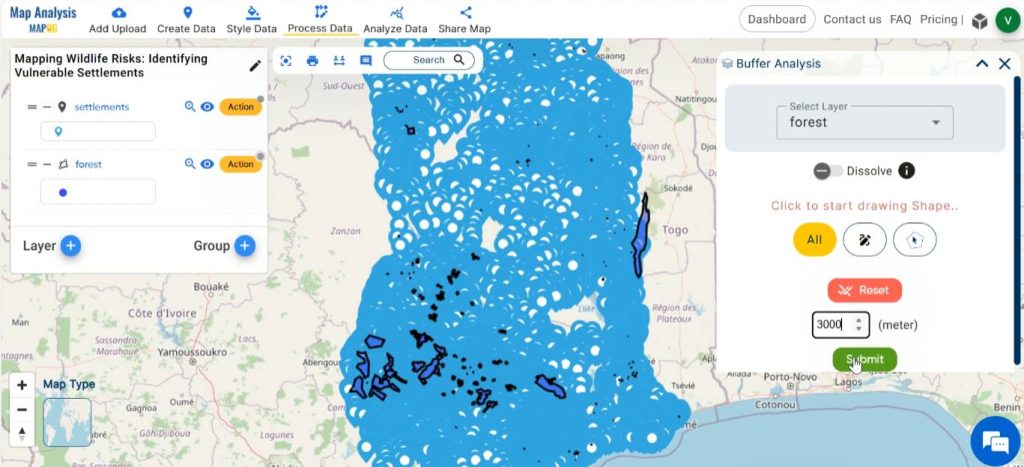
Select the forest layer in the given tab. Enter a suitable value as the range of the buffer zone. Then click on Submit.
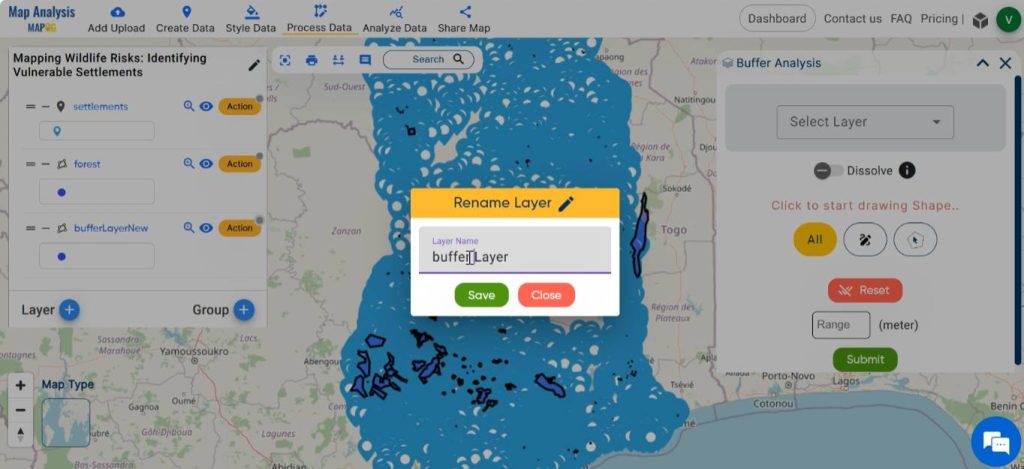
Rename the buffer layer by selecting the pencil icon from Action.
Step 6: Identify Vulnerable Settlements near forest
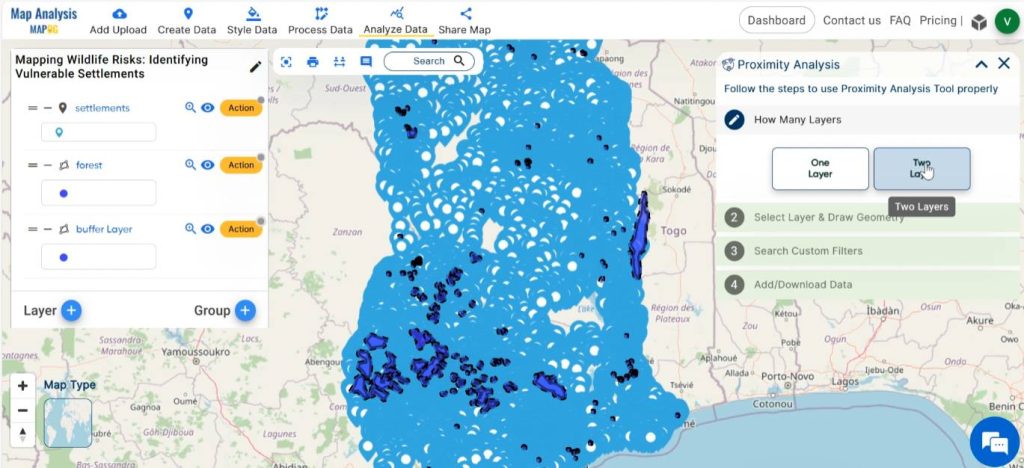
Next, we can identify and filter out the settlements located within the wildlife attack vulnerable regions near forests. In order to do this, select Analyze Data from the menu bar. Now the proximity analysis tool is opened, select Two Layer option.
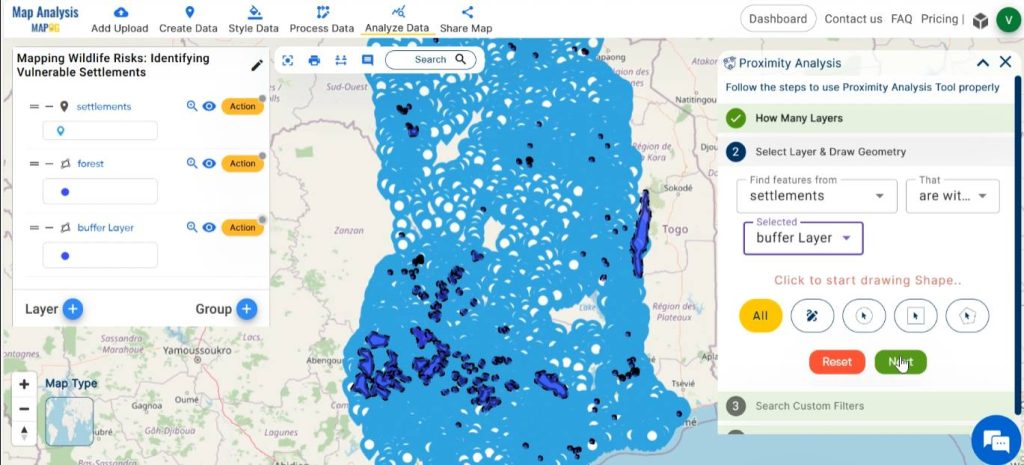
In the “find features” tab, choose the settlement layer. Next, Specify the option “that are within”. In the following tab, select the buffer layer. For completing the analysis, click on Get Results.
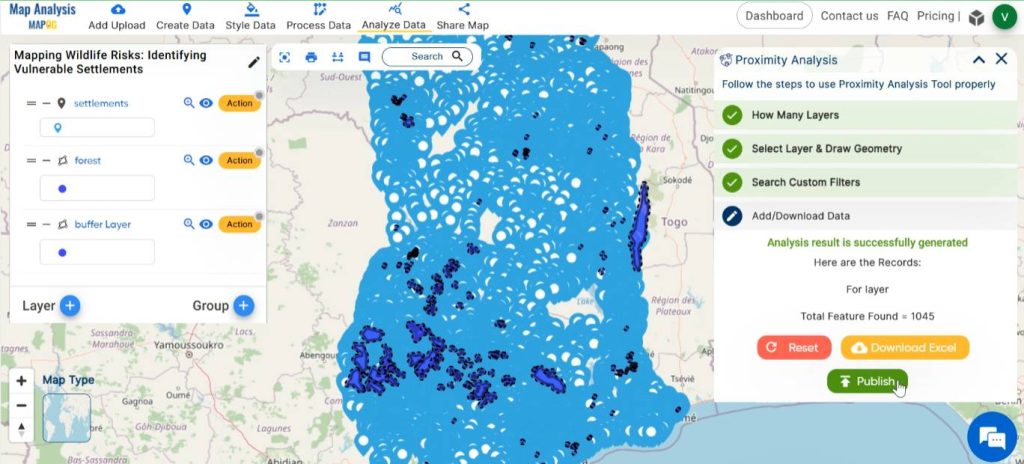
The number of results of this analysis is given as ‘Total Feature Found’. The result can be obtained in two ways: either as an excel file by clicking on “Download Excel” or can be published into the map using the “Publish” button.
Rename the filtered-out layer with a suitable name.
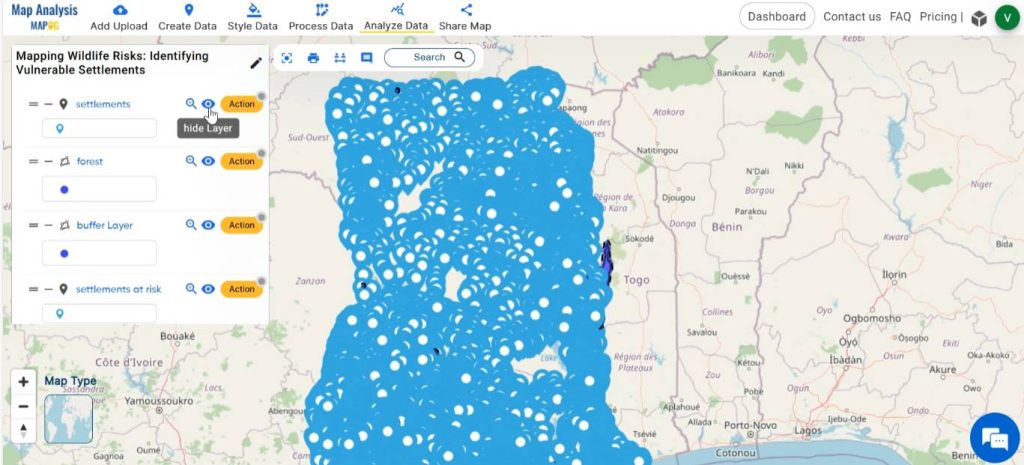
Step 7: Enhance the map
For a better visual understanding, at first, hide the settlements layer.
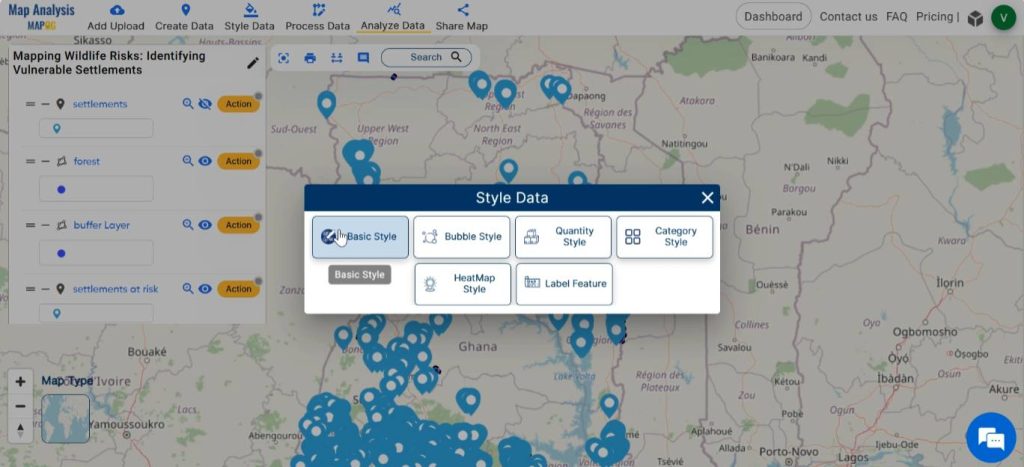
Enhance the visual appearance of the map by styling the layers with different and appealing colours. In order to do this, click on Style Data and select Basic Style.
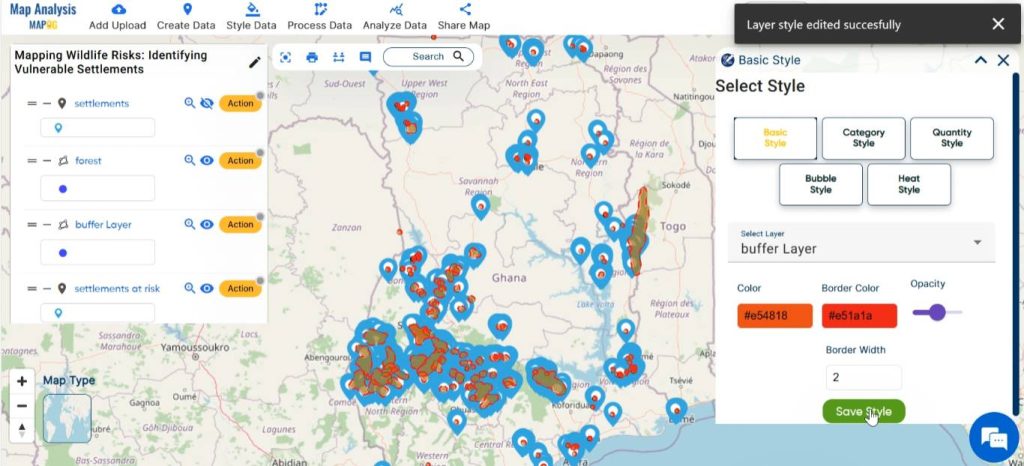
Select the layer to be styled, then choose the suitable colour gradient for the layer from the available colour palette. Save your changes by clicking on Save Style.
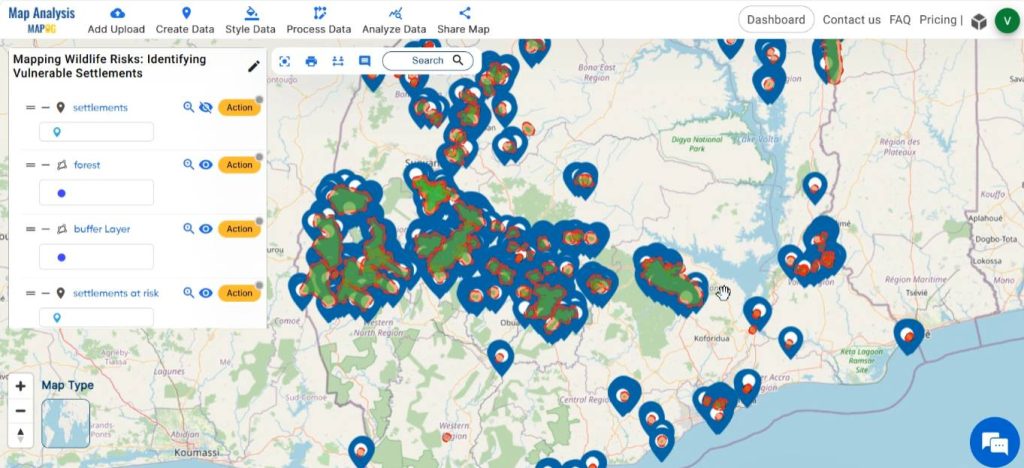
Finally, we have created a map which points out the settlements in the vicinity of forest which are likely to be susceptible to wildlife attack.

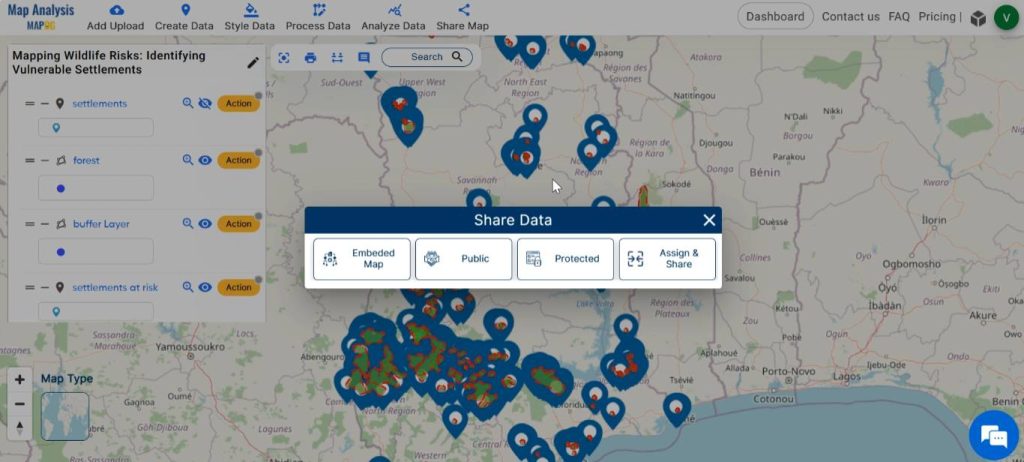
Step 8: Share the Map
Using the Share tool, share the map with your friends or post it on social media.
Major Findings–Identifying Vulnerable Settlements near forest
- Identification of High-Risk Areas: The map delineates regions where human settlements and forest habitats intersect, pinpointing areas of heightened vulnerability to wildlife interactions.
- Assessment of vulnerability: The map highlights settlements facing a greater likelihood of wildlife encounters, thus facilitating a comprehensive understanding of potential risks.
- Strategic planning insights: The map offers valuable insights for strategic planning and resource allocation aimed at mitigating wildlife-related threats.
Industry and Domain
- Local Communities: Residents living in settlements identified as at-risk, thus benefit from increased awareness and preparedness for wildlife encounters.
- Wildlife Conservation Authorities: These organisations benefit from targeted intervention strategies that help minimise human-wildlife conflicts.
- Government Agencies: By identifying vulnerable settlements, these agencies can implement preventive measures that reduce the need for emergency response and compensation for damages.
- Planners: Planners can use this information to inform land-use decisions and urban development plans, ensuring that settlements are designed and located in ways that minimise conflicts with wildlife.
Conclusion– Identifying Vulnerable Settlements near forest
Mapping wildlife risks using MAPOG is a powerful approach to understanding and addressing the complex dynamics of human-wildlife interactions. Moreover, by leveraging MAPOG buffer tool and proximity analysis, researchers and policymakers can identify vulnerable settlements, assess the factors driving conflict, and develop targeted strategies for risk mitigation and conservation.
GIS Data Links
Explore more content on our blog:
Protecting Wetlands: Guide to Create GIS Map for Nature
GIS Analysis in Urban Planning: Reshaping Transportation Future Insights of state/city
Fast Emergency Response: Using GIS and Isochrone Maps for 10-Minute Ambulance Arrival