In the dynamic realm of e-commerce, optimizing last-mile delivery is paramount for customer satisfaction and market competitiveness. E-Commerce Logistics Isochrone Analysis Mapping Strategy, facilitated by tools like MAPOG, plays a pivotal role in refining logistics operations and elevating delivery efficiency. By strategically mapping e-commerce delivery networks using isochrone analysis, businesses can gain valuable insights into coverage areas and facilitate route optimization, ensuring timely and efficient deliveries. Visit the MAPOG website today to explore the power of strategic mapping in revolutionizing e-commerce logistics.
Key Concept For E-commerce Isochrone Analysis Mapping Strategy:
In e-commerce delivery optimization, understanding delivery networks, utilizing isochrone analysis, and minimizing delivery time and cost are crucial. Settlement points indicate demand distribution. Incorporating various isochrone variants, such as driving and cycling, ensures flexibility in route planning for efficient delivery operations. Find the Links which are used in this work,at the end of the blog. Check out our other blog “Mapping EV Charging Station Accessibility with Isochrone Analysis“
Process For E-commerce Delivery Network Strategy Mapping:
Step 1
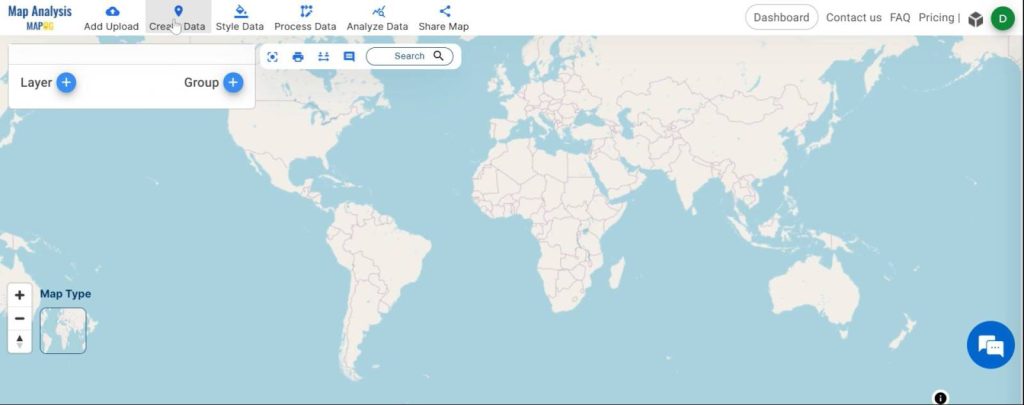
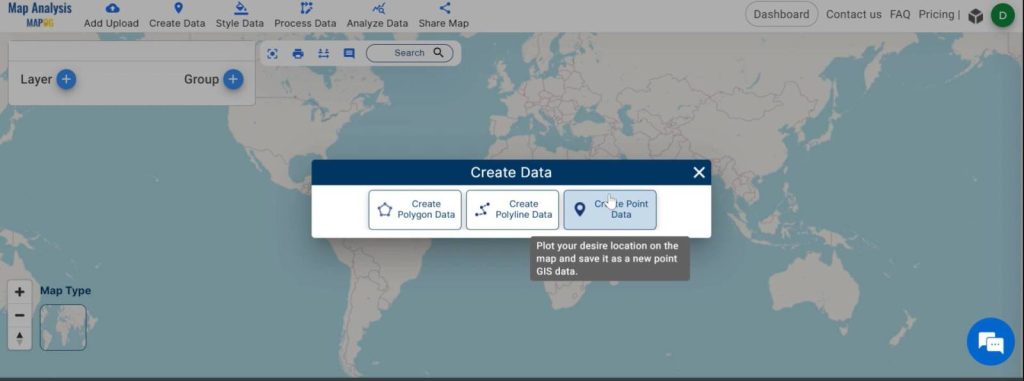
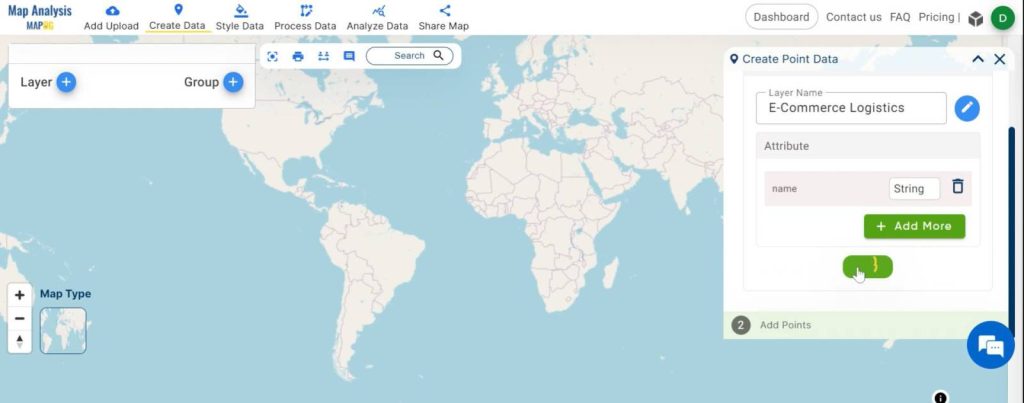
Open the MAPOG map analysis interface first. Then navigate to “Create Data” from the menu toolbar and select “Create Point Data“. Give a name to the layer, then save it, your point layer is ready.
Step 2:
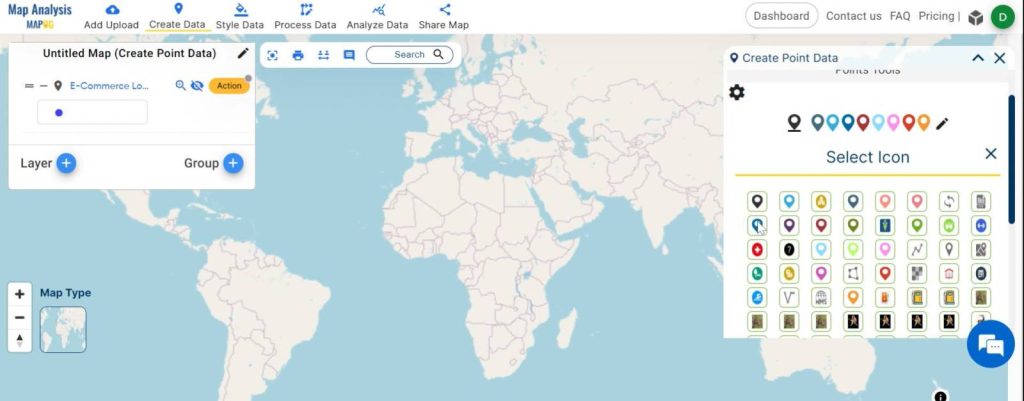
After that, you can put point features. First, select the icon from the Create Point data tool. Now you can put points to the map.
Step 3:
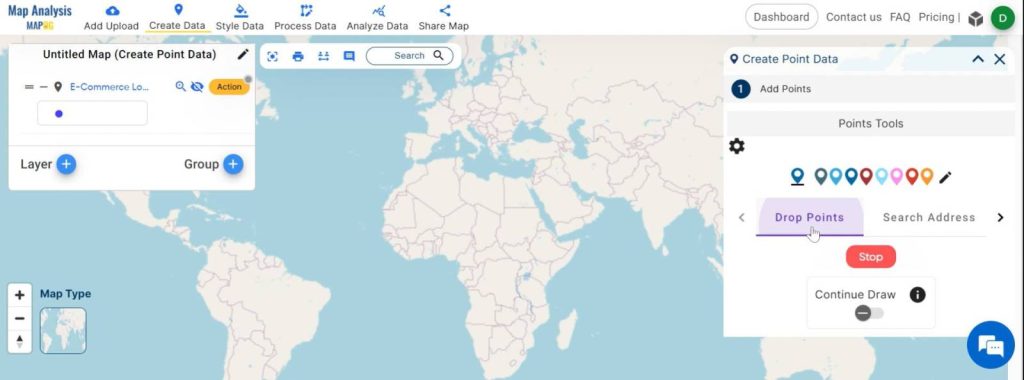
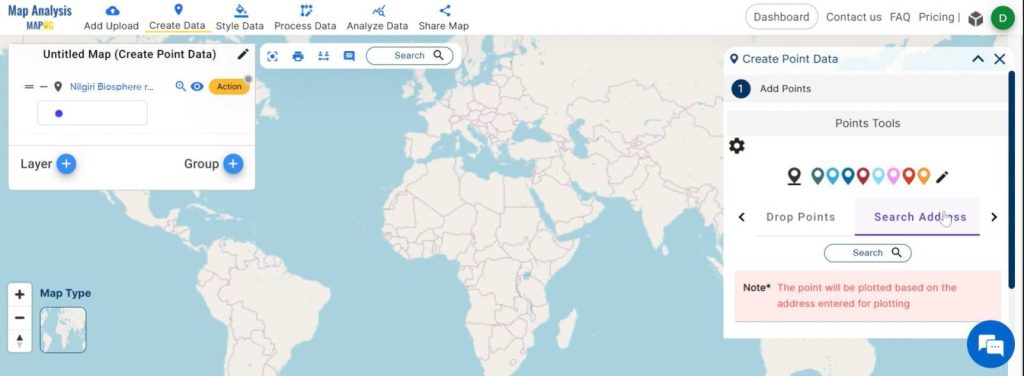
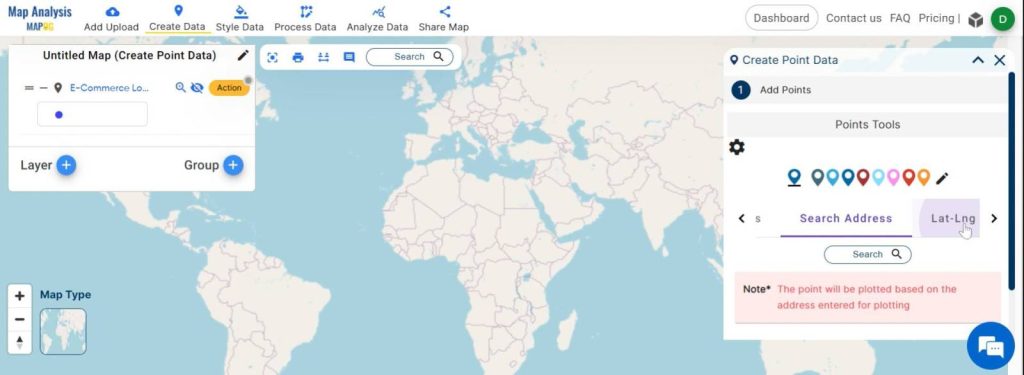
There are three different modes to put the point on the map.
- Drop Point: Manually place the point on the map.
- Search Address: Enter PIN codes or addresses to locate the place.
- Latitude or Longitude: Input specific latitude or longitude values to find the desired location.
Here, we are plotting the e-commerce logistic centers randomly, so we choose the drop point option.
Step 4:
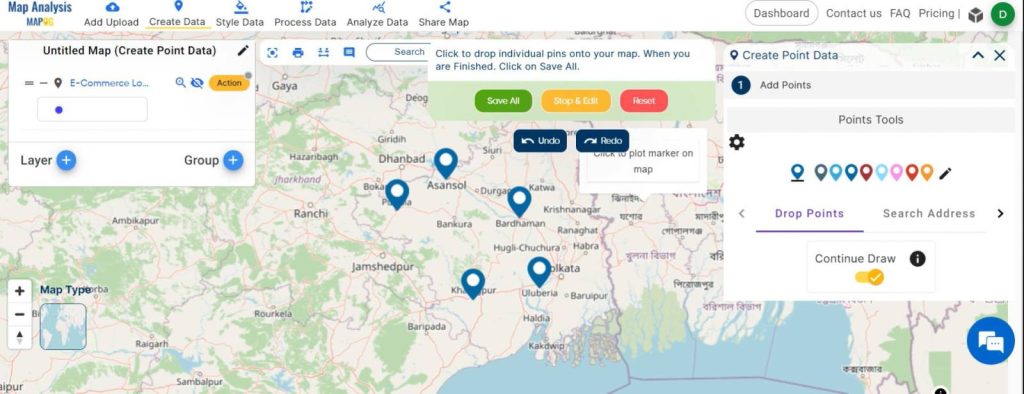
Now switch on the continue Draw option. Then, put all the point features wherever you want. After putting all the points, click “ Save all”. Your point features are added now.
Step 5:
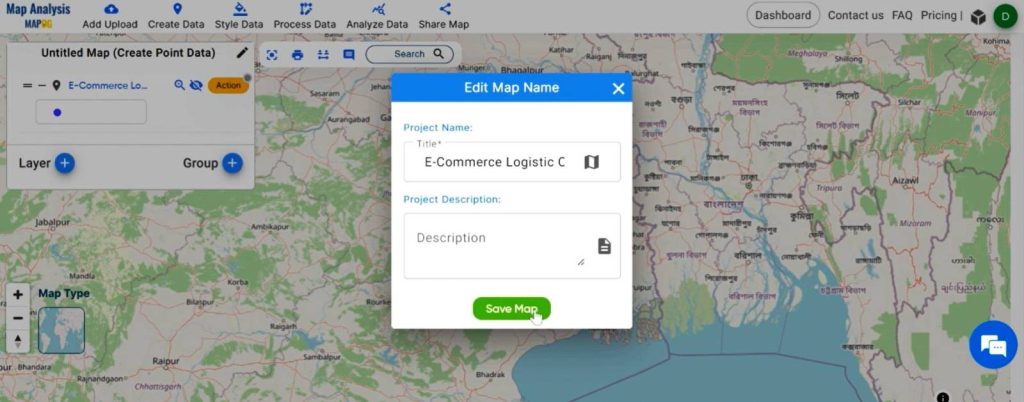
After that, give a name to the untitled Map from the Edit Map Name. Then click “Save map”.
Step 6:
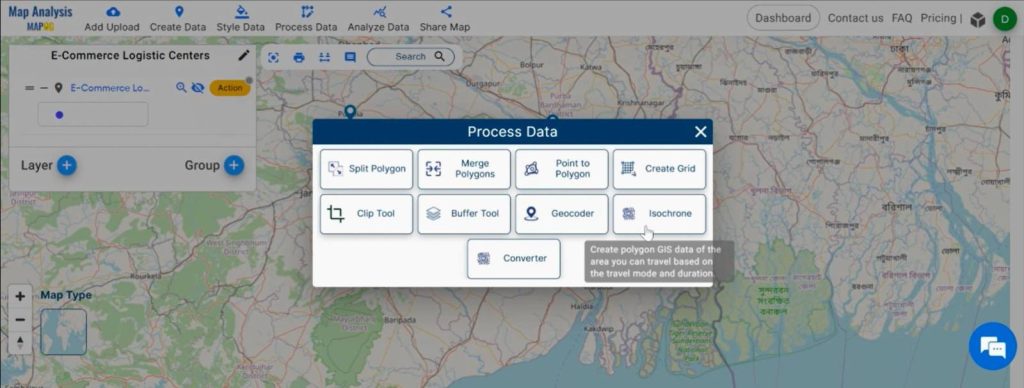
Now, to put isochrones, first, go to “Process Data”, then click “Isochrones”. Here select the layer first, where you want to create the isochrones. It must be a point layer.
Step 7:
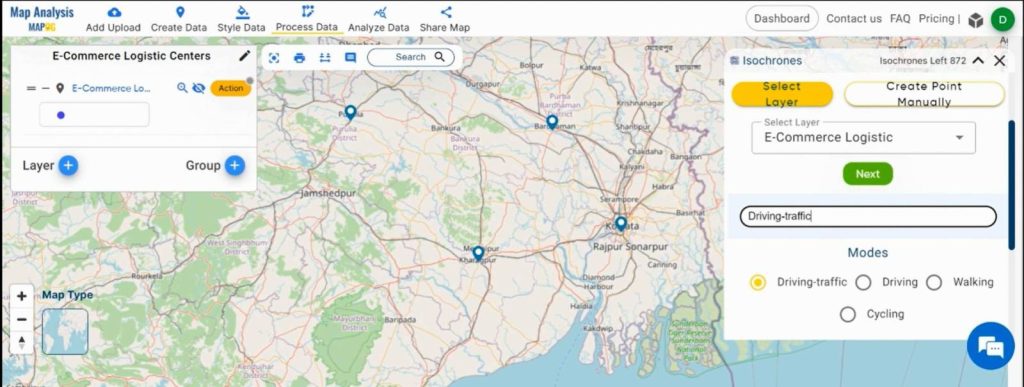
Then, give a name to the isochrone layer by the mode of the isochrone like -Driving-traffic. Then select the mode.
Step 8:
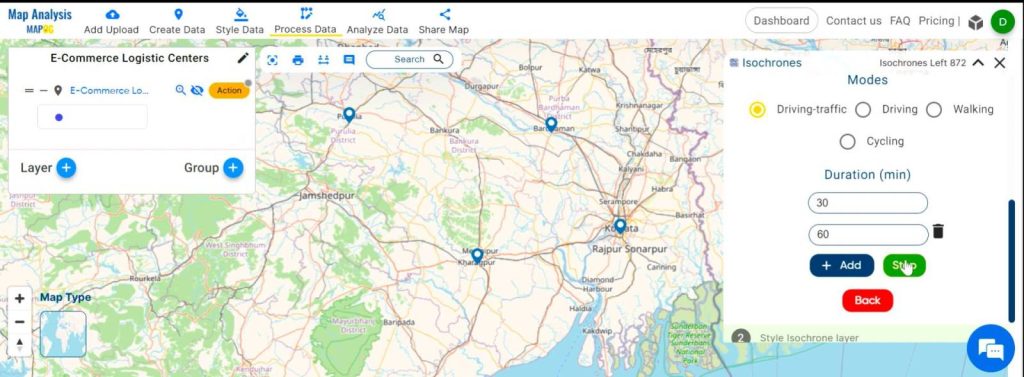
Then, put the time of 30 minutes, then press add, and put another time of 60 minutes. then click submit. Here we create two different isochrones with the same mode.
Step 9:
Now, style the isochrone. First, select the style type as category style. Then you can customize the colour as per your choice. Last click “next”. The isochrones are successfully added now.
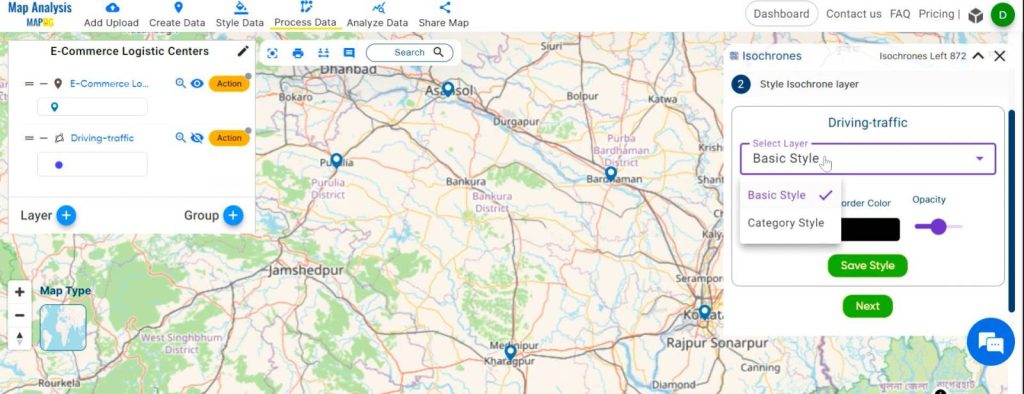
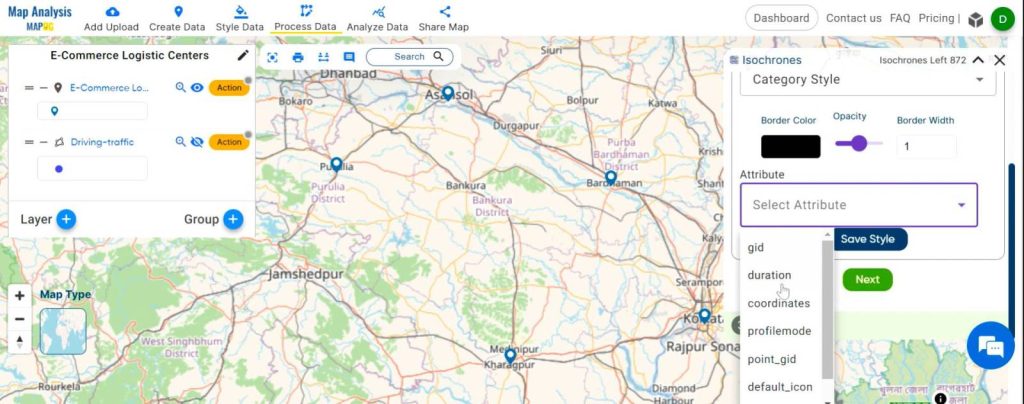
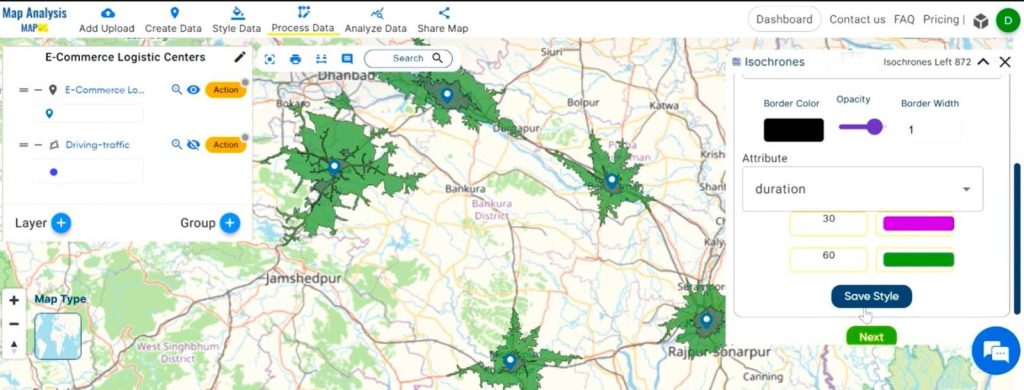
Step 10:
Now, go to add more isochrones. And repeat the same process only change the mode to cycling. And set the time for 15 minutes and 30 minutes.
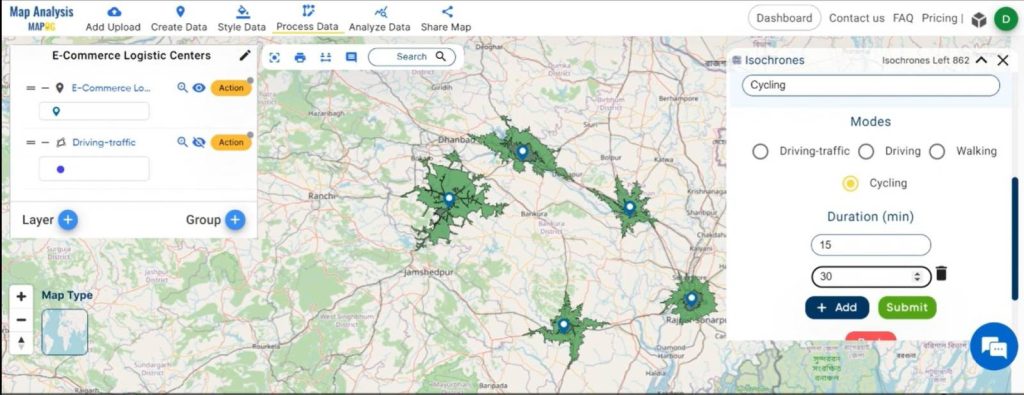
Step 11:
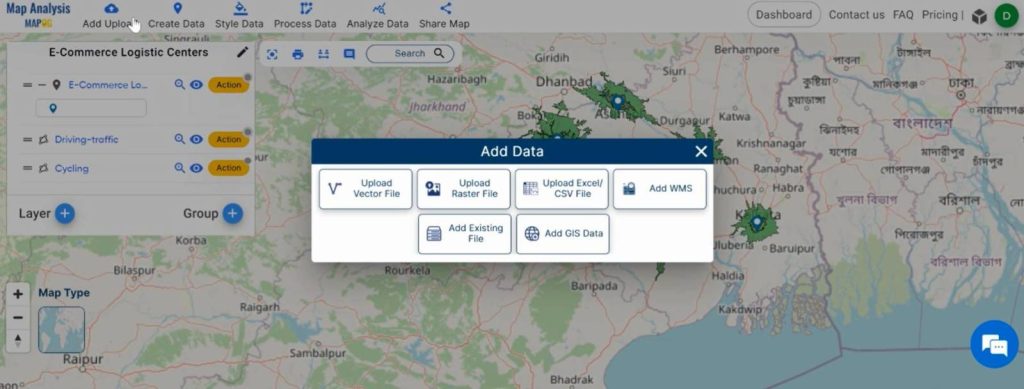
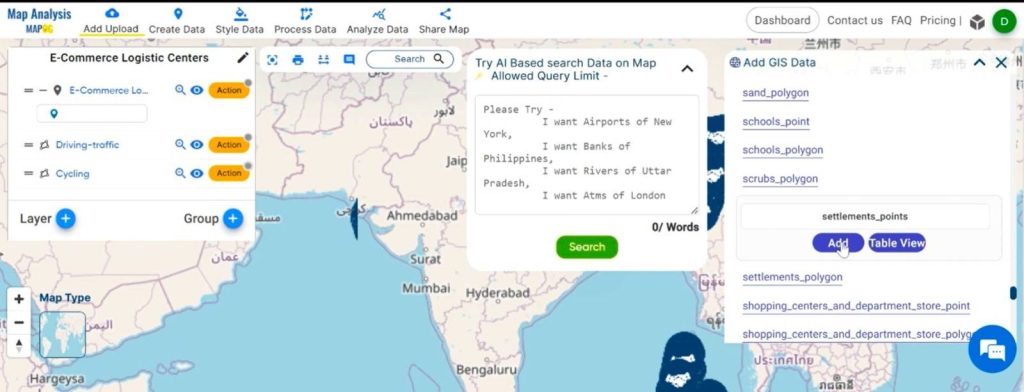
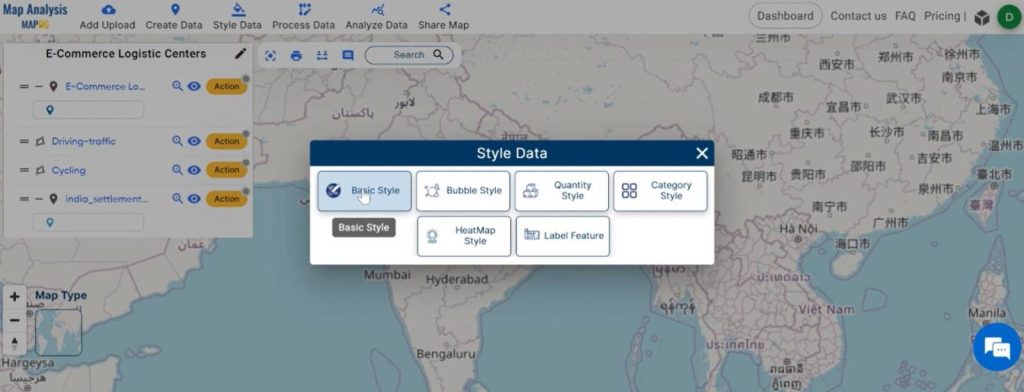
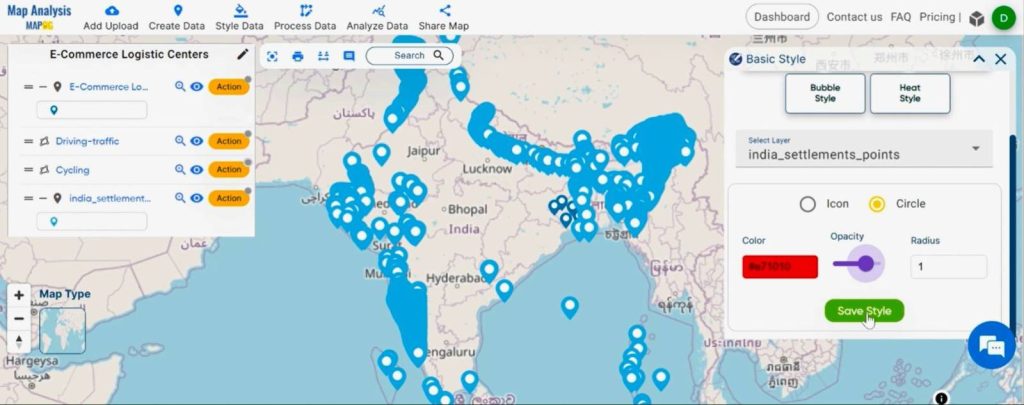
Now, Proceed to “Add Upload” and select “Add GIS Data” to incorporate settlement points. Then, to give style to the data, first go to “Style Data”, then “Basic Style”. You can choose different icons or circles from here. In this work, we put circles for better understanding, select the “Circle” option, customize the color, and the radius of the circle, and then click ‘Save style’.
Step 12:
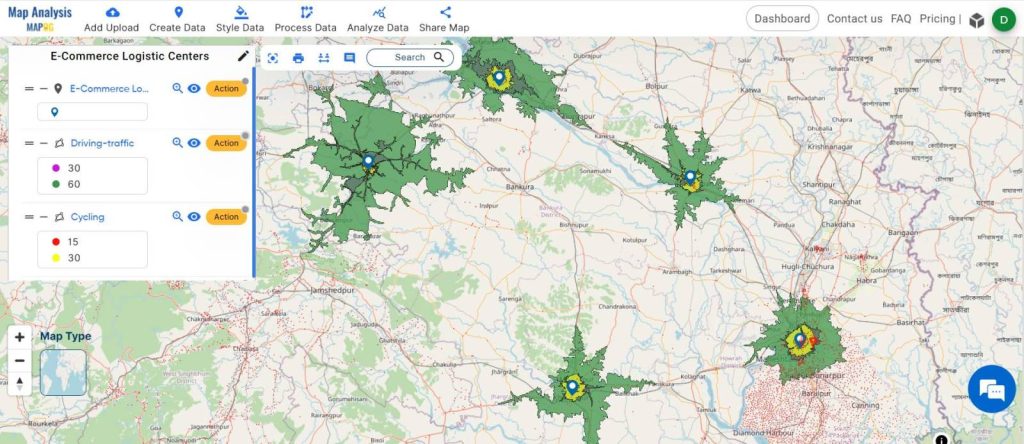
The final map is ready now. It visually represents settlement points, e-commerce logistic centers, and their respective isochrones. Each logistic center is surrounded by isochrones denoting 30-minute and 15-minute cycling distances and 30-minute and 60-minute driving distances, aiding in route optimization and delivery efficiency. Here, with the steps provided above, we have achieved E-commerce Logistics Isochrone Analysis Strategy Mapping
Major Findings:
Utilizing isochrone analysis, four travel scenarios were identified: 30-minute driving, 60-minute driving, 15-minute cycling, and 30-minute cycling.
- The 30-minute driving isochrone ensures rapid order fulfillment in close proximity to logistic centers.
- The 60-minute driving isochrone expands delivery coverage across a broader region within an hour.
- The 15-minute cycling isochrone offers eco-friendly delivery options, reducing carbon emissions.
- The 30-minute cycling isochrone enhances urban delivery accessibility, catering to cycling preferences.
The inclusion of settlement data enriches the analysis by providing insights into population distribution and demand density, crucial for optimizing delivery routes and ensuring effective coverage.
Industry and Domain:
- E-commerce: Strategic mapping ensures timely order fulfillment, boosted by settlement data insights into local demand.
- Logistics: Optimized routes and resource allocation reduce last-mile delivery costs, informed by settlement data on demand distribution.
- Retail: Efficient delivery boosts customer loyalty; settlement data guides tailored delivery strategies.
- Urban Planning: Settlement insights inform infrastructure design, enhancing city efficiency and resident satisfaction.
- Competitiveness: Strategic mapping, fueled by settlement data, drives faster, reliable delivery services, ensuring market edge.
1 thought on “Strategic Logistics Mapping: Optimizing E-commerce Delivery with Isochrone Analysis”