In the vast landscape of Geographic Information Systems (GIS), the meticulous process of mapping settlement features stands as a cornerstone of urban planning, environmental assessment, and resource management. Settlement features, ranging from individual households to sprawling cityscapes, serve as critical focal points in understanding human habitation patterns and societal dynamics.
With the help of MAPOG Map Analysis, we explore the nuanced process of transforming physical settlements into digital representations.

KEY CONCEPTS
Our goal is to create a map of distinct surface features with the help of the Points Data Tool from the MAPOG Map Analysis. A point vector is a type of vector data model used to represent discrete geographic features as points with specific locations on the Earth’s surface. Point tool in GIS has many uses like Create a Map: Filter Camping Spots in a Region Within – Points in polygon and Create Map, and Analyze: Optimizing Bank Branch Locations.
Steps for Digitizing Surface Features Using Points tool
Below are the steps to follow to create a map of Spatial features using Points:
- Open Map Analysis
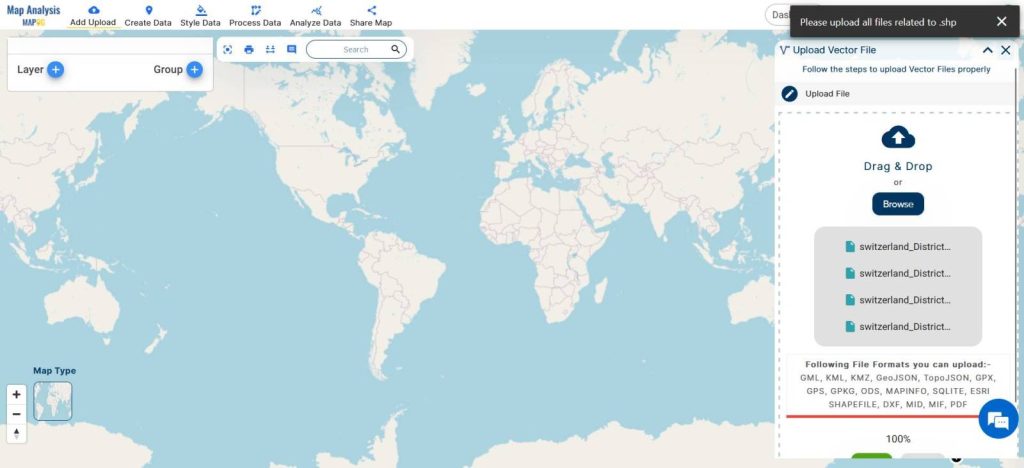
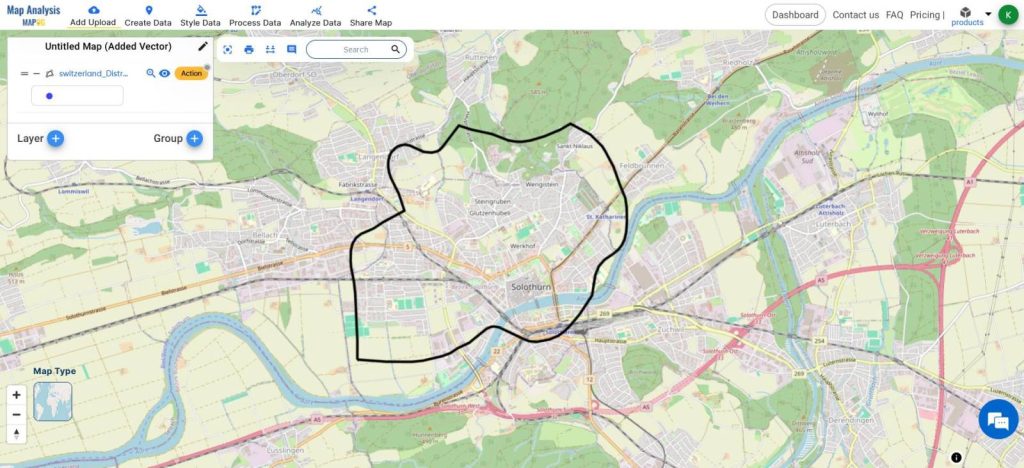
- Upload your Boundary Layer using the Upload Vectors
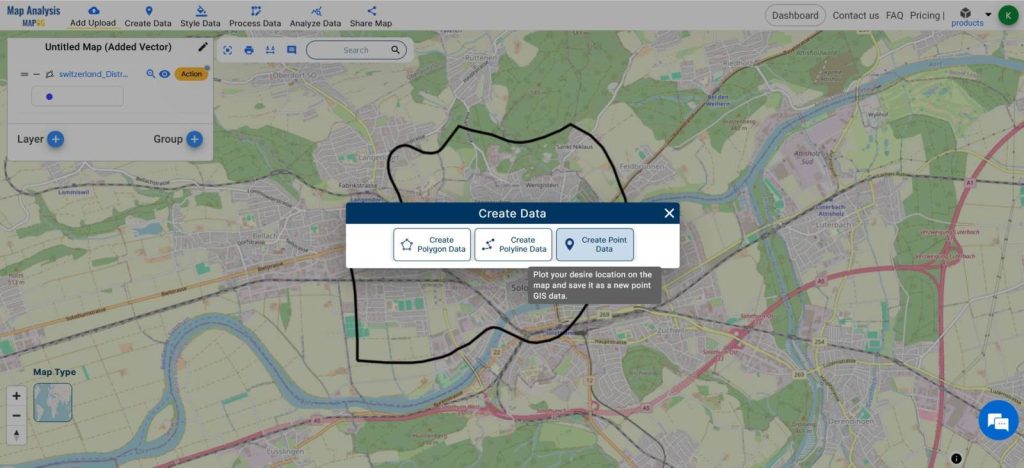
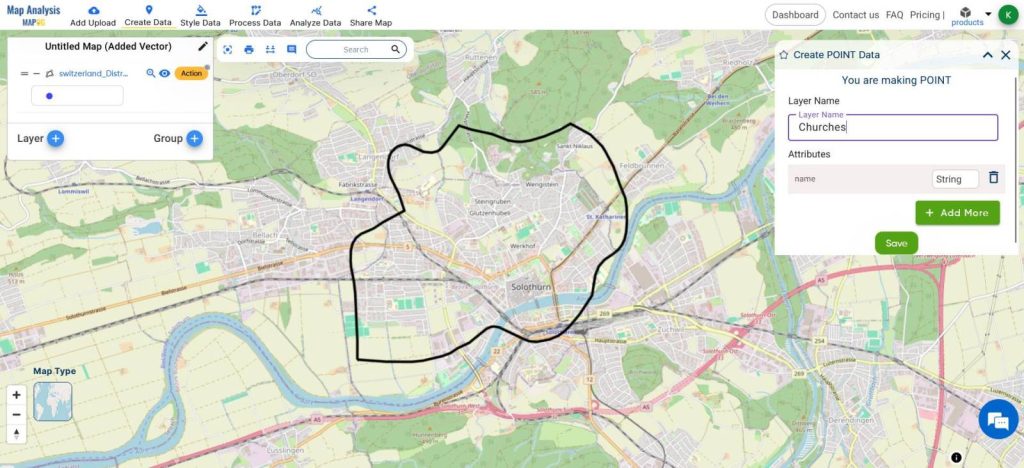
- From the Create Data tool, select Create Point Data.
- Write the Layer Name and click Save
- Enable Continue Draw and Drop points on all the specific features
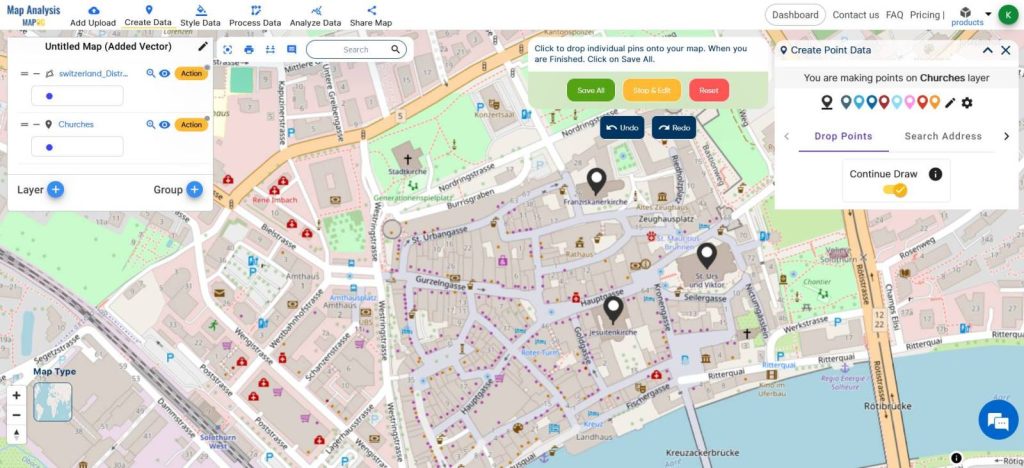
- Click Save All
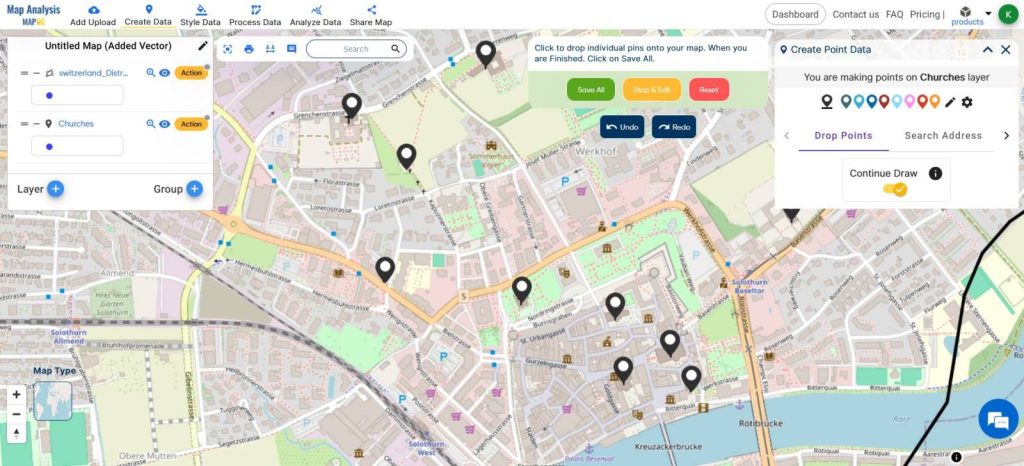
- Repeat the step for other features
- Change the icon styles using Basic Styles from Style tools
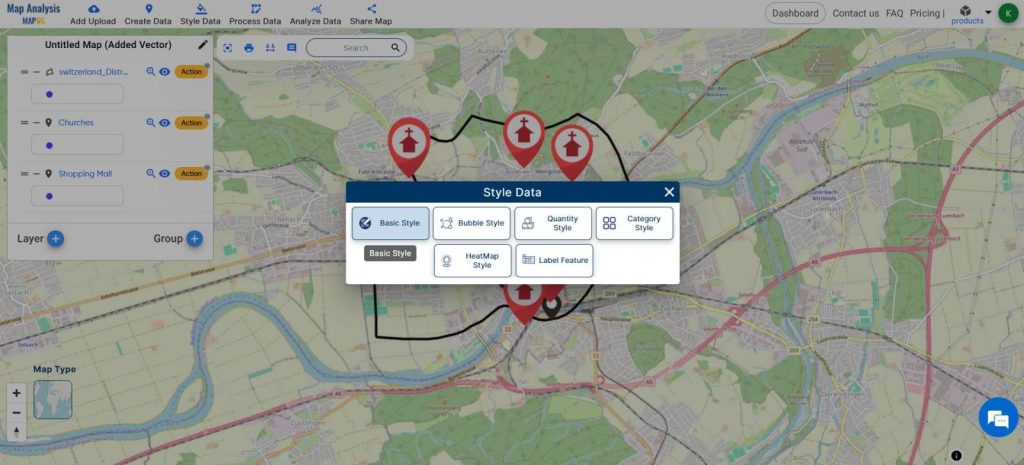
- Add your custom icons using the Add Icon feature
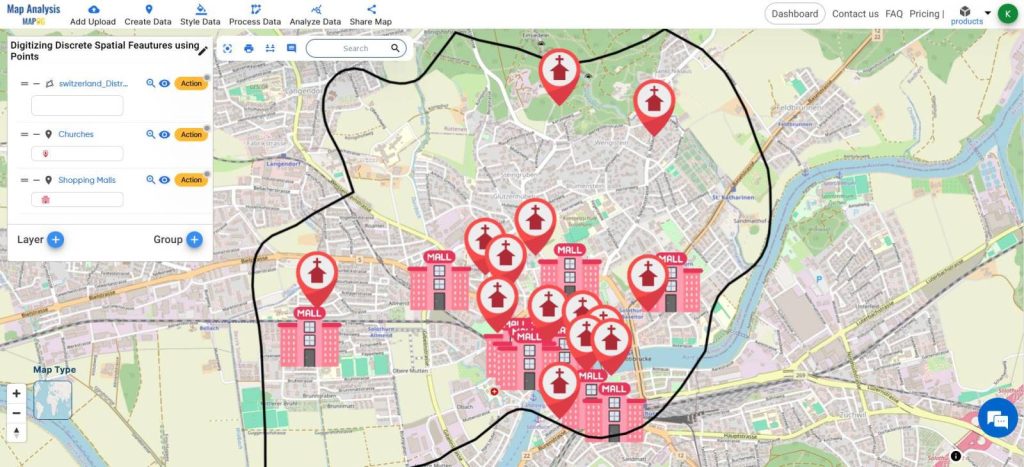
This is the Final Map
This map gives us the details on the spatial position of the Churches and Shopping Malls in the study area. This data can be used by Policymakers to decide on proper urban planning and management like
- Drainage channels
- Waste Disposal
- Electricity connections etc.
MAJOR FINDINGS
Digitizing churches and shopping malls using point tools in MAPOG MAP ANALYSIS reveals spatial distribution patterns, population densities, and commercial hubs within the city.
- Strategic Drainage Planning:
- Policymakers can strategically plan drainage channels by utilizing this data.
- These plans can accommodate potential congregation points during heavy rainfall events.
- Efficient Waste Disposal Allocation:
- The data allows policymakers to allocate waste disposal facilities efficiently.
- Allocation can be based on population centers and commercial activity patterns identified through the digital mapping of settlement features.
- Prioritized Electricity Connections:
- Policymakers can prioritize electricity connections based on the spatial distribution of commercial and community activity.
- Areas with high concentrations of such activities can be identified using digital data.
- Effective Urban Planning and Management:
- Overall, this approach ensures effective urban planning and management.
- By leveraging the insights provided by digital mapping, policymakers can facilitate sustainable development in urban areas.
BENEFICIAL DOMAIN: Urban Planning and Infrastructure Management
- Urban Planning: Utilizing digitized data of churches and shopping malls aids in identifying population centers, commercial hubs, and land use patterns.
This facilitates informed decisions on zoning, transportation, and public services allocation for efficient urban development. - Infrastructure Management: The analysis of digitized points equips policymakers with the ability to prioritize infrastructure investments, including drainage channels, waste disposal facilities, and electricity connections.
It facilitates optimal resource allocation, thereby enhancing urban resilience against challenges such as flooding and population growth.
For any inquiries or support needs, feel free to contact us at support@mapog.com.
CONCLUSION
Conclusively, the integration of MAPOG MAP ANALYSIS for digitizing churches and shopping malls provides a base for Urban planning and Infrastructure Management.
This approach empowers policymakers to effectively address urban challenges, allocate resources efficiently, and foster sustainable development for resilient and vibrant cities.
VIEW OUR PREVIOUS BLOGS
Create Map, and Analyze: Optimizing Bank Branch Locations
Mapping EV Charging Station Accessibility with Isochrone Analysis
Strategic Logistics Mapping: Optimizing E-commerce Delivery with Isochrone Analysis