What are isochrones?
Isochrones are geographical representations that depict areas reachable within a certain time frame from a specific location. They are a valuable tool for assessing accessibility and planning transportation infrastructure. Here, demonstrate how to create isochrones through MAPOG, with the example of Isochrones: Railway Stations Accessibility Analysis.
What is the benefit of this?
The benefit of isochrones lies in their ability to illustrate travel time and accessibility. By analyzing isochrones, we can quickly identify areas that are easily reachable within a given time frame.
Key Concept For Isochrones: Railway Stations Accessibility Analysis:
Isochrones serve as visual aids, depicting travel times and accessibility patterns. By analyzing isochrones, stakeholders gain insights into areas easily reachable within defined timeframes, facilitating informed decision-making in resource allocation and infrastructure development. Check the required data links at the end of the article. Check out our blogs on E-commerce Delivery Network Strategy Mapping.
Process For Isochrones: Railway Stations Accessibility Analysis.
Step 1:
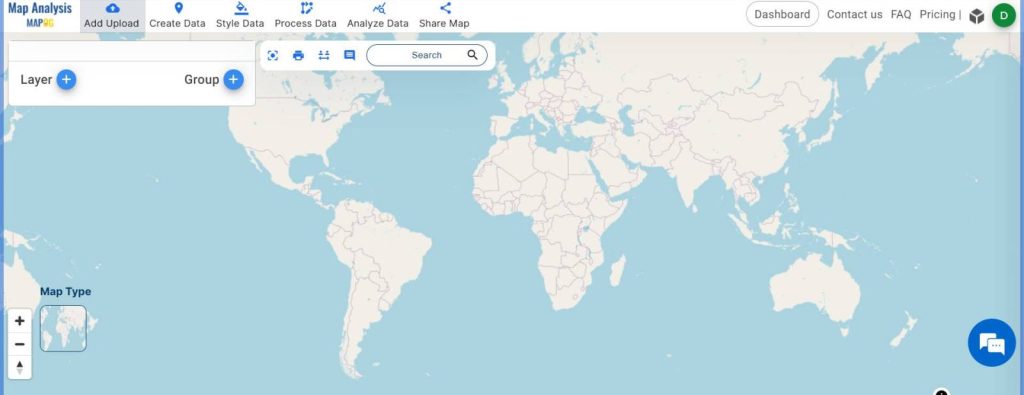
Access MAPOG Map Analysis Interface:
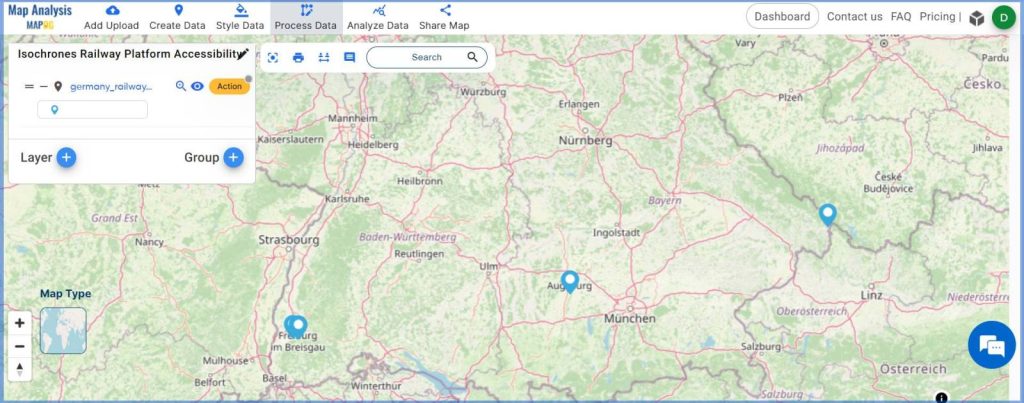
Begin by opening the MAPOG Map Analysis interface first.
Step 2:
Incorporate Railway Platform Data:
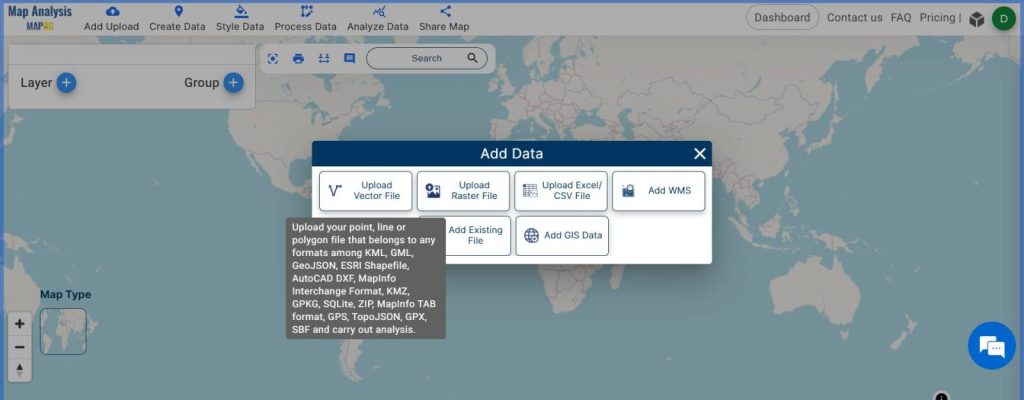
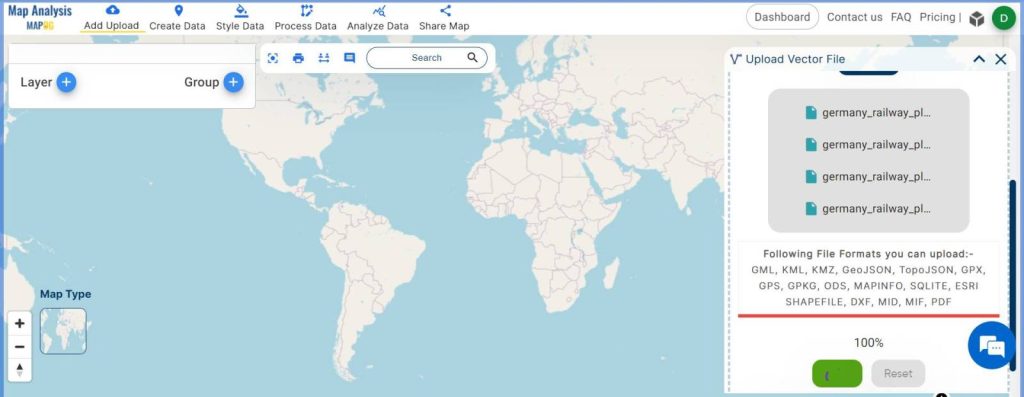
Navigate to ‘Add Upload‘ and select ‘Upload vector file‘ to integrate railway platform data. Then, Browse and select the vector data from the system. After that, click “Upload”.
Step 3:
Name the Map:
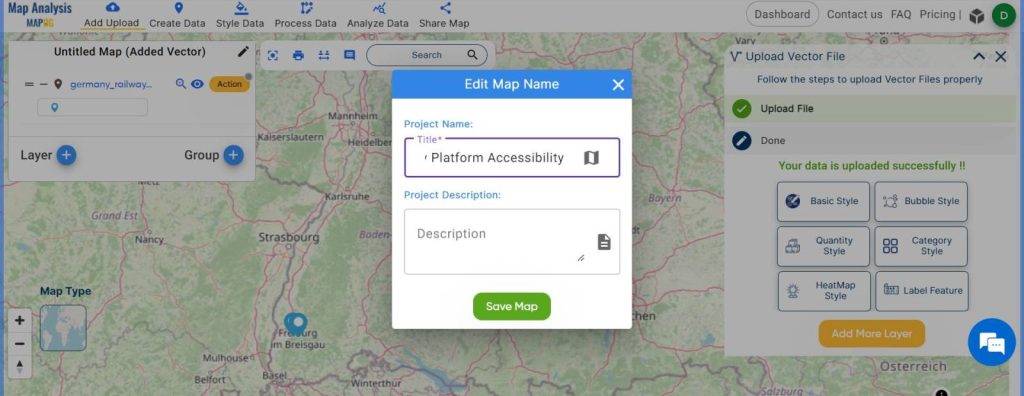
Then, Give a name to the untitled map From “Edit Map Name” and then, click “Save Map”.
Step 4:
Incorporate Isochrones:
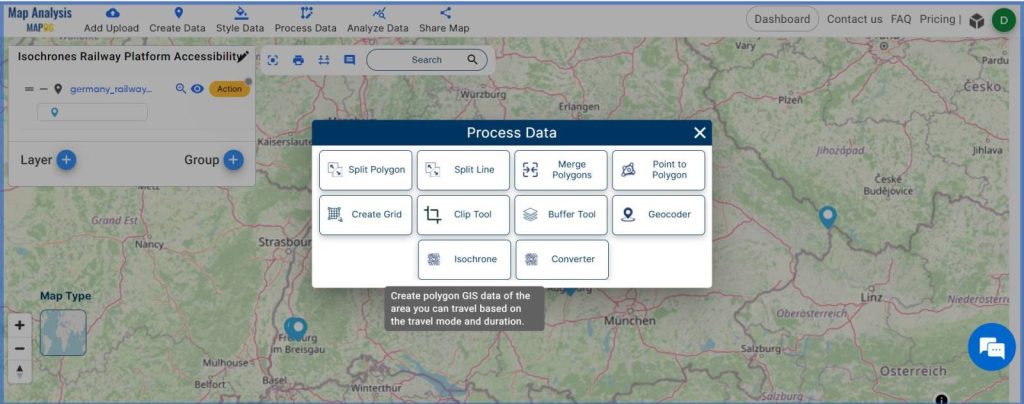
After that, Proceed to ‘Process Data‘. Then, select ‘Isochrones.’
Step 5:
Set Parameters:
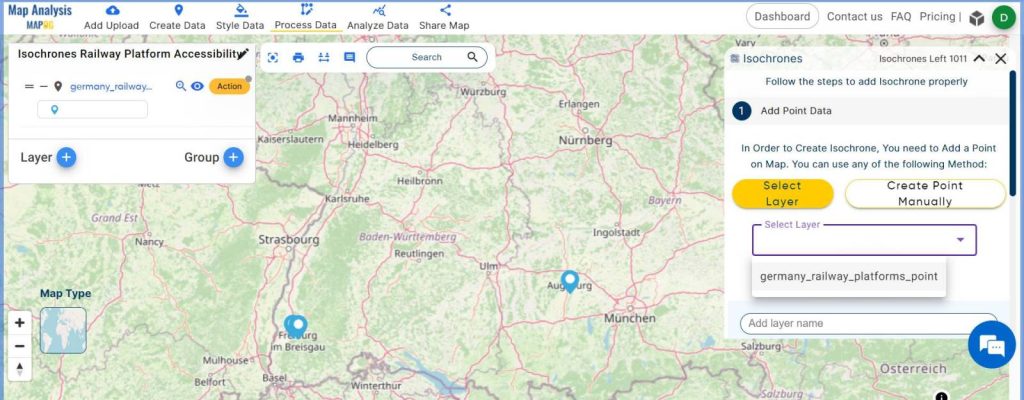
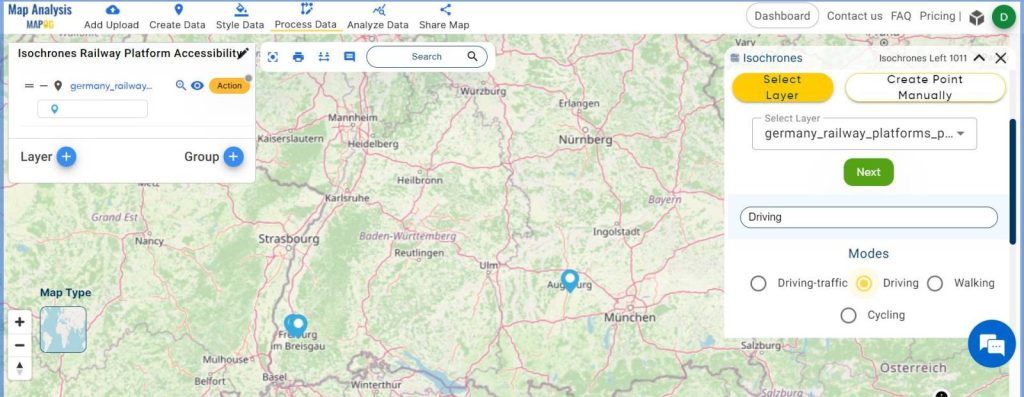
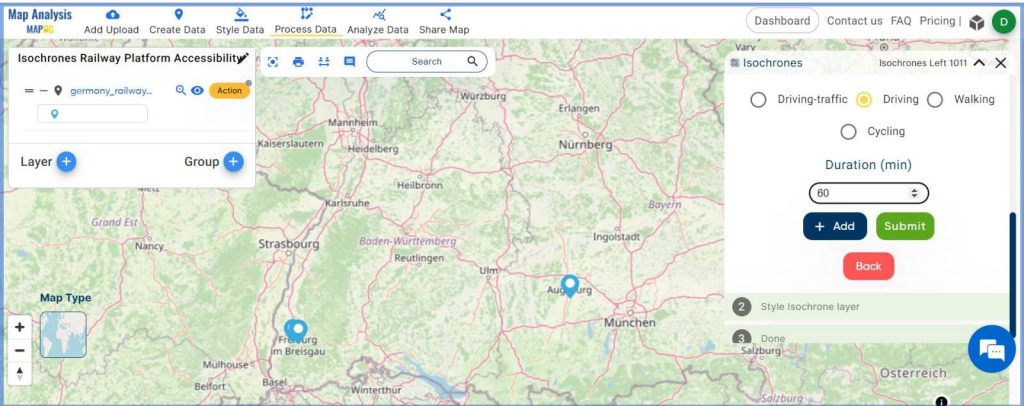
Then, choose the layer for isochrone creation, specify the mode (e.g., driving), and set the desired time frame (e.g., 60). For this work choose 60 minutes for driving.
Step 6:
Style the Isochrones:
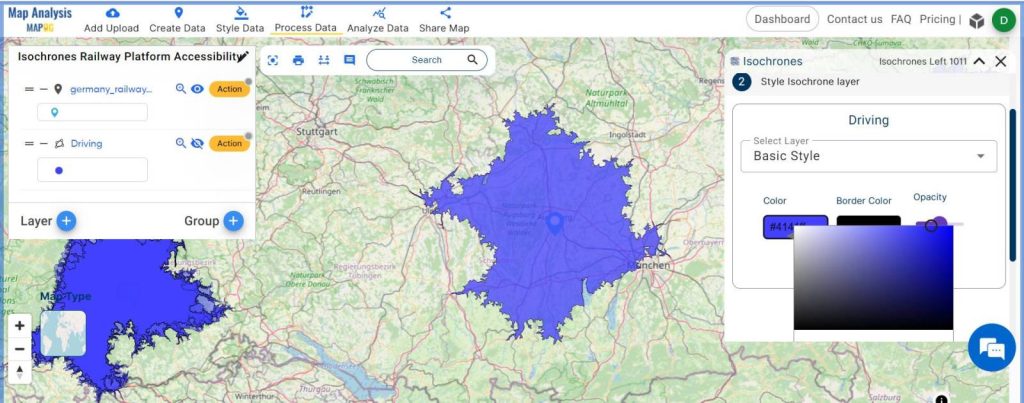
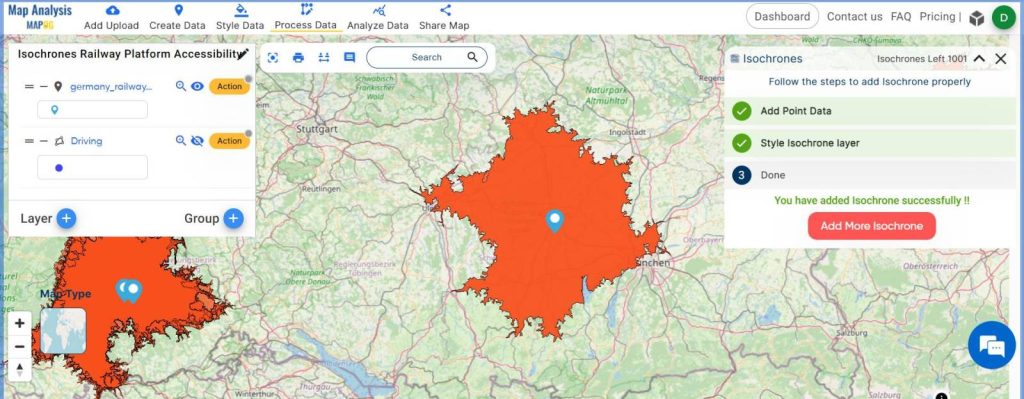
After that, customize the color of the isochrones as per your own choice.
Step 7:
Repeat Process:
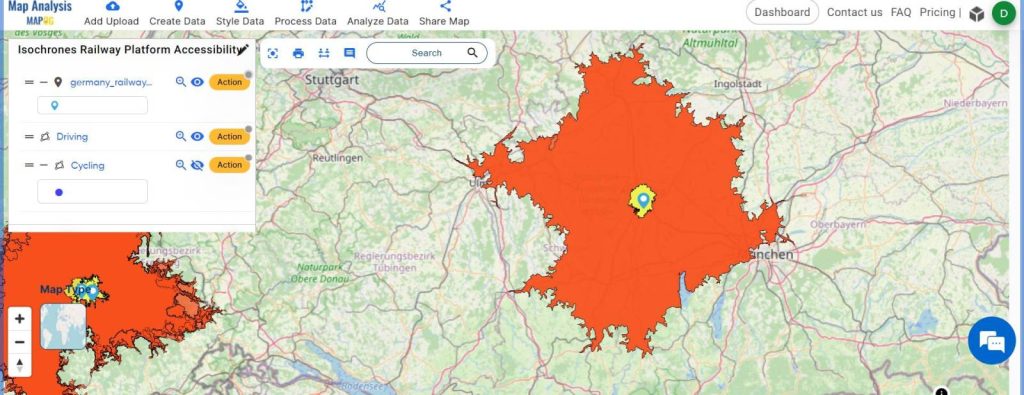
Then click on “Add more isochrones” to add another isochrones, here choose cycling mode and set the time for 30 minutes.
Step 8:
Final Output:
The generated isochrones provide visual representations of accessibility for each railway station, aiding decision-making in transportation planning.
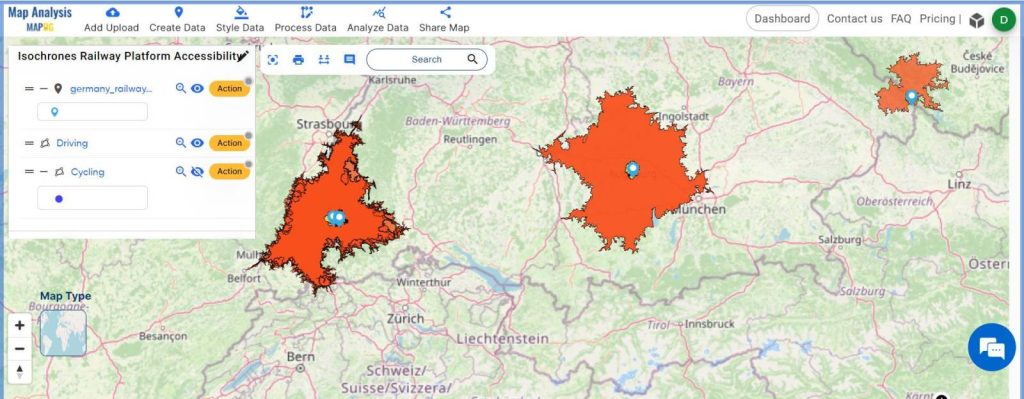
Major Findings:
- Understanding Access: Isochrones help us see how easy it is to reach places using different transportation methods, showing where connectivity might be lacking.
- Improving Infrastructure: By looking at how accessible train stations are, we can decide where to improve things like roads or public transit to make it easier for people to get around sustainably.
Industry and Domain:
- Transportation Industry:
- Railway Operators: Isochrone analysis assists railway operators in understanding accessibility patterns to optimize service delivery and infrastructure development.
- Urban Planners: Urban planners utilize isochrones to identify areas with limited connectivity and prioritize investments in transportation infrastructure for improved accessibility.
- Multi-Industry Application:
- Isochrones extend beyond transportation, benefiting industries such as real estate, delivery services, tourism, and urban development.
Conclusion For Isochrones: Railway Stations Accessibility Analysis:
Isochrones are handy tools for checking how easy it is to get to places using different types of transportation. With tools like MAPOG, we can create and study these isochrones to see how accessible public transit hubs, like train stations, are. By knowing this, people in charge can make smart choices to improve public transportation and make it easier for everyone to get around, which is good for the environment too.