In the present scenario of data-driven decision-making, understanding population demographics is paramount across various domains. One tool that stands out in this regard is the Excel attribute tool of MAPOG GIS Platform. This tool enables users to seamlessly integrate Excel population data with spatial data, providing valuable insights into demographic trends. The importance of this tool cannot be overstated, as it allows for comprehensive analysis and visualization of population distributions. Explore this article to enhance your knowledge in Renewable energy- Create Map – DIGITIZING SOLAR, HYDROELECTRIC, WIND AND BIOMASS POWER PLANTS – RENEWABLE ENERGY
Key Concept of Joining the Excel Population Data
The key concept behind integrating Excel attributes with MAPOG lies in merging the attributes of two datasets: the spatial data representing geographic boundaries (such as country polygons) and the attribute data (such as population figures) stored in Excel spreadsheets. The link for GIS data is available at the end of this article.
The Article on Digitalization of Road Networks by Drawing Line on Map allows you to explore more with MAPOG.
Steps for Joining the Excel Population Data
Step 1 Upload the data
Navigating to the MAPOG map analysis tool, add the GIS data for our needs.
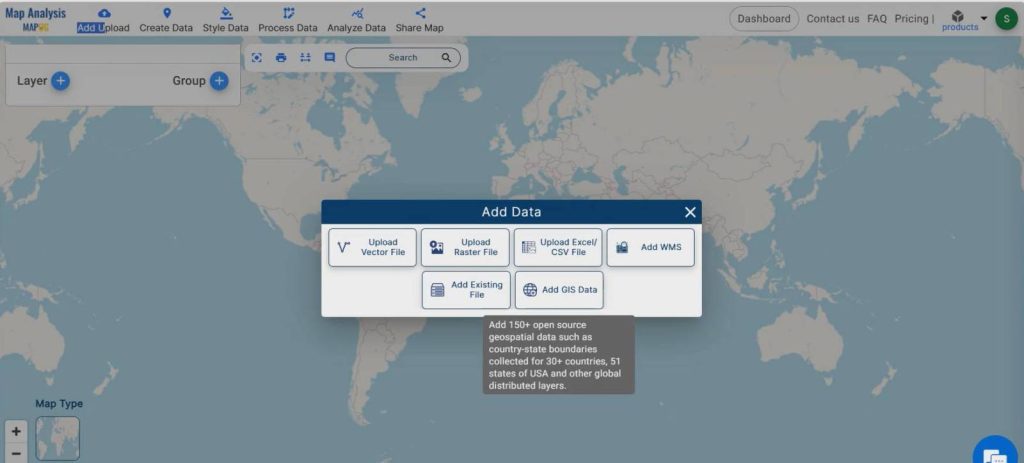
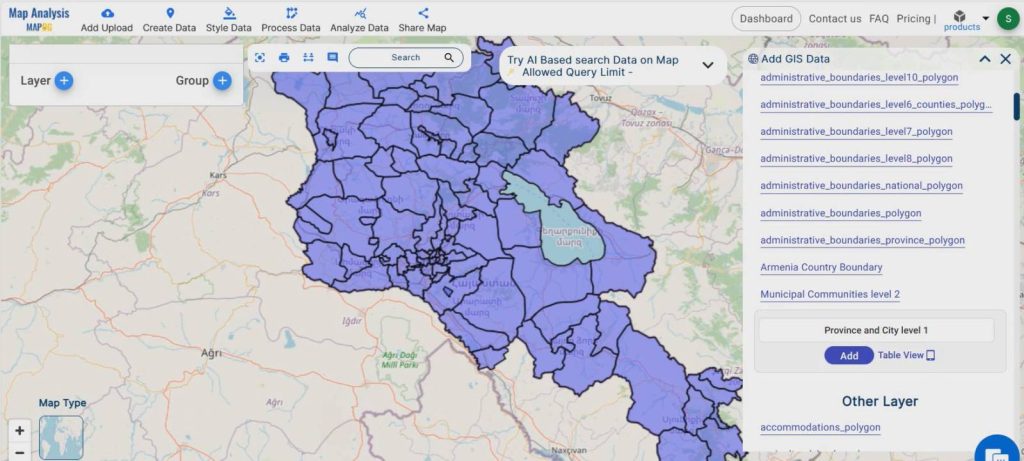
Transitioning to the MAPOG Map analysis tool, proceed to the Add Upload option, then select Add GIS Data and choose a country. Afterwards, scroll down to locate the City-level data and add it to the layer. If possessing data for the region of study, proceed to upload the data to MAPOG as an excel file, vector file, or raster file.
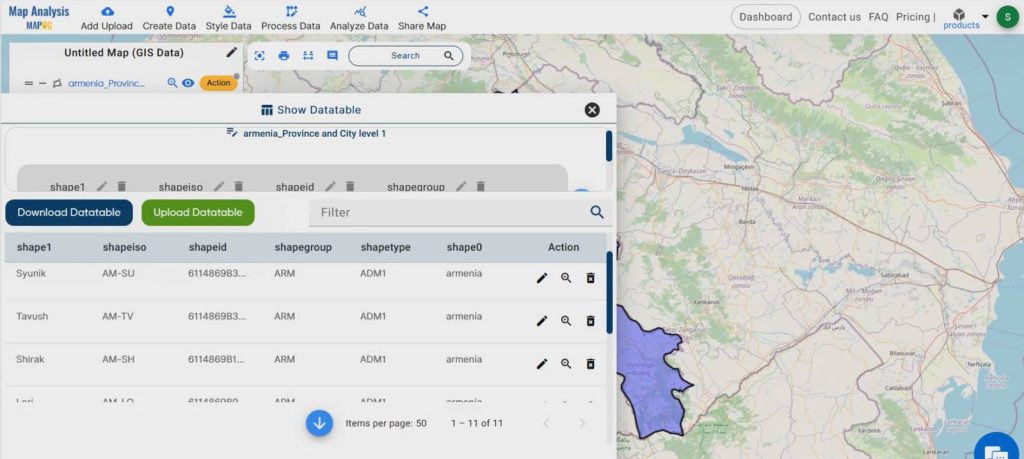
By clicking on the action button and selecting the “show data table” option, you can check the data table to visualize the attributes of the added data. Additionally, you can edit the name of the field showing the city for better understanding.
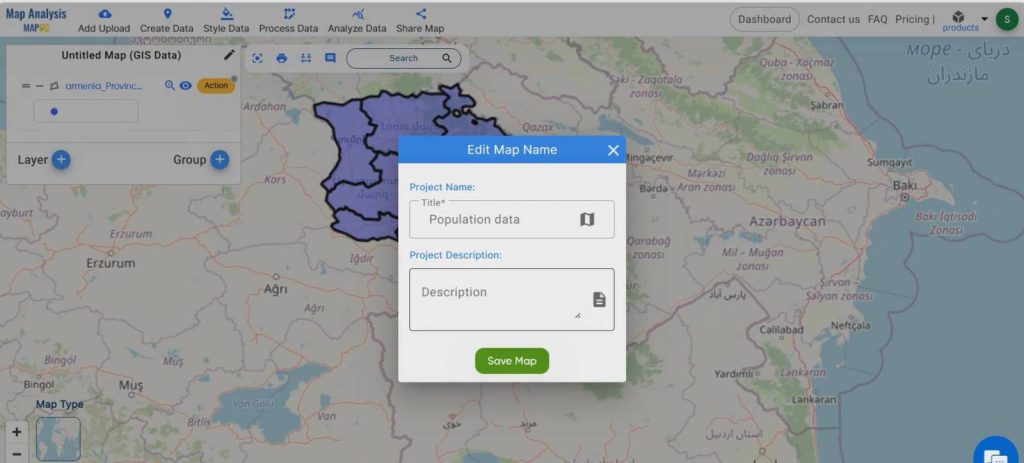
Step 2 Project Title
Give the title of the project instead of an untitled one. You can also provide a description of your project in the description box.
Step 3 Excel Attributes-Add population data
The population data for this country is available as an Excel file (showing Excel sheet). To add this file to the MAPOG platform using the Excel attribute option, start by moving to the Analysis data menu.
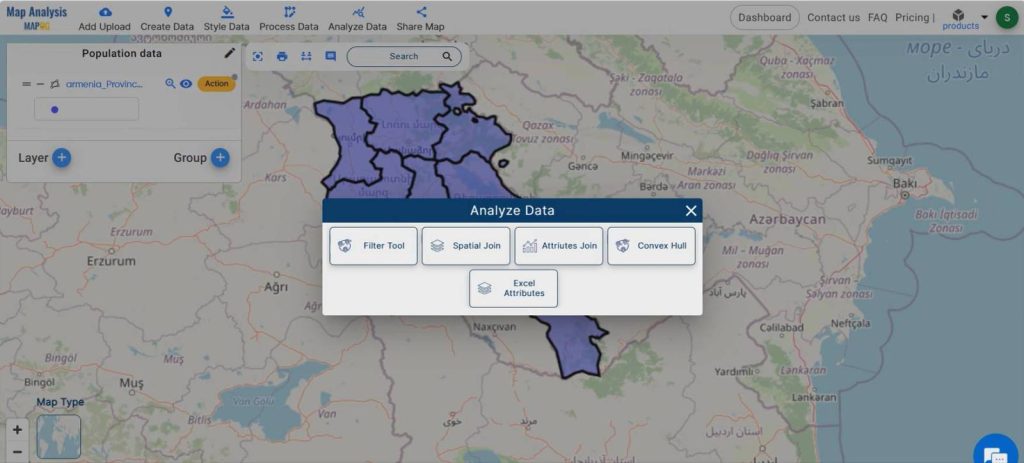
Once there, select the excel attributes option and upload the Excel file containing population data of major cities of this country. Then, select the data to be joined and also select the target feature as the country city level data that was already added from MAPOG data, and select the target attribute as city name.
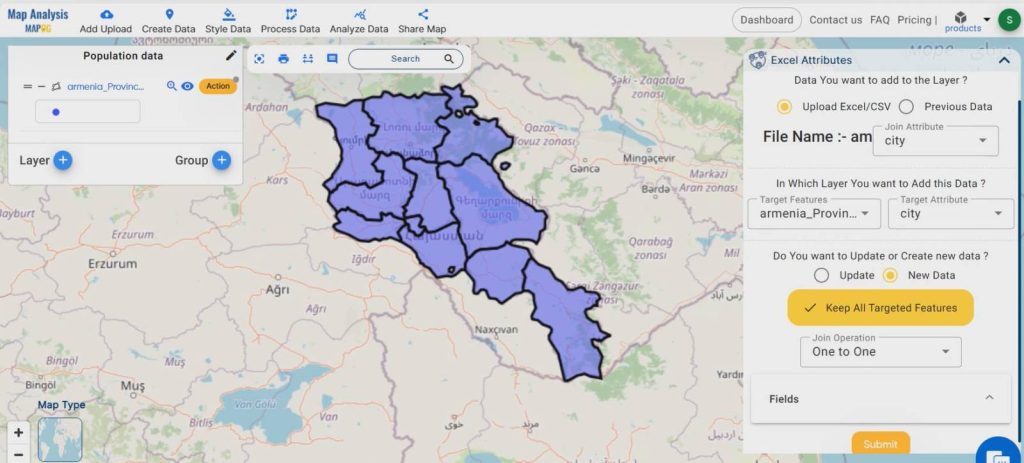
Next, click on the new data option and press the keep all targeted features option. After that, select the one-to-one data joining option and tick the fields that are needed to be joined. Finally, submit the data. The layer is successfully added.
Check the data table of this newly added data layer . The attributes of both data are there in this data layer.
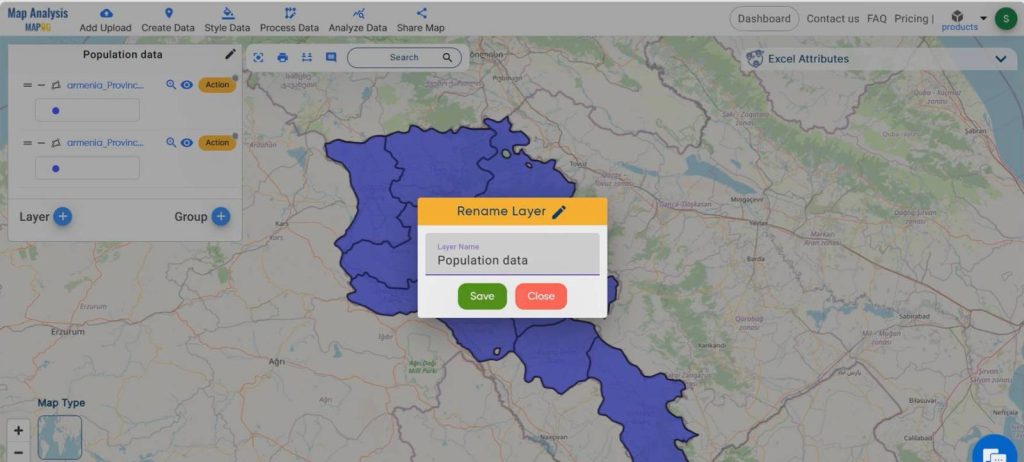
Step 4 Rename layer
Click on the action button to rename the layer as population data, then edit the layer name. Utilize category styling options to assign variant colors to different cities. Select the attribute “city” and proceed to change the colors.
Step 5 Category Styling
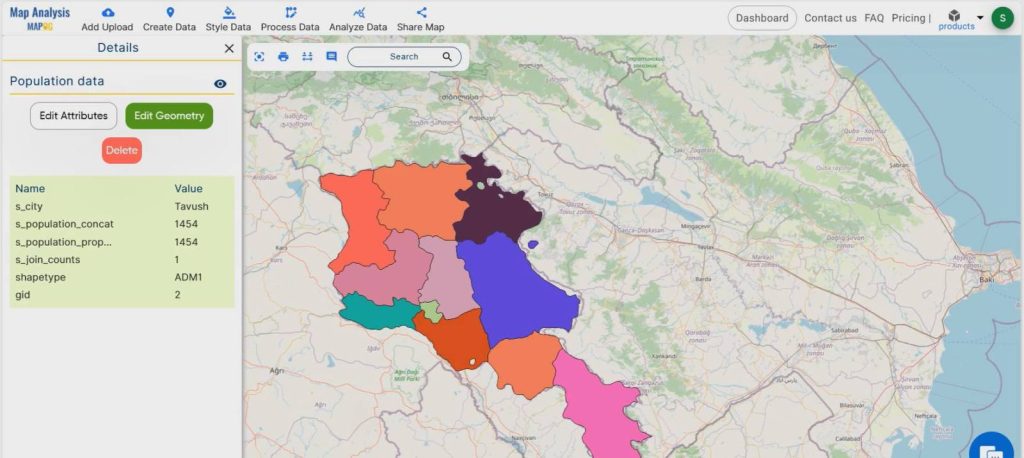
To visualize the data based upon the City, move on to the action button associated with the data layer, then select the category style. Choose the data layer, then adjust the border color, width, and opacity according to our requirements.
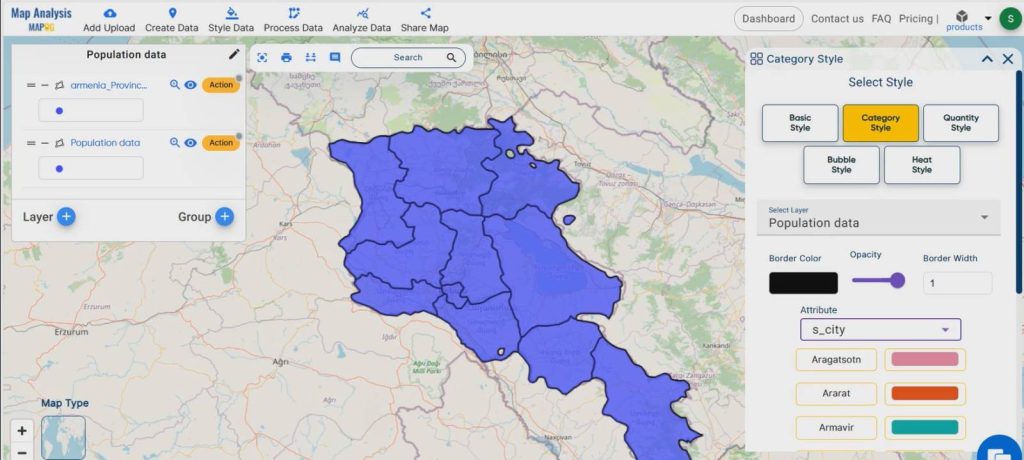
Select the attribute as s_city( which indicates the name of cities) and configure the color gradients before submitting it. Click on each city to view the details added.
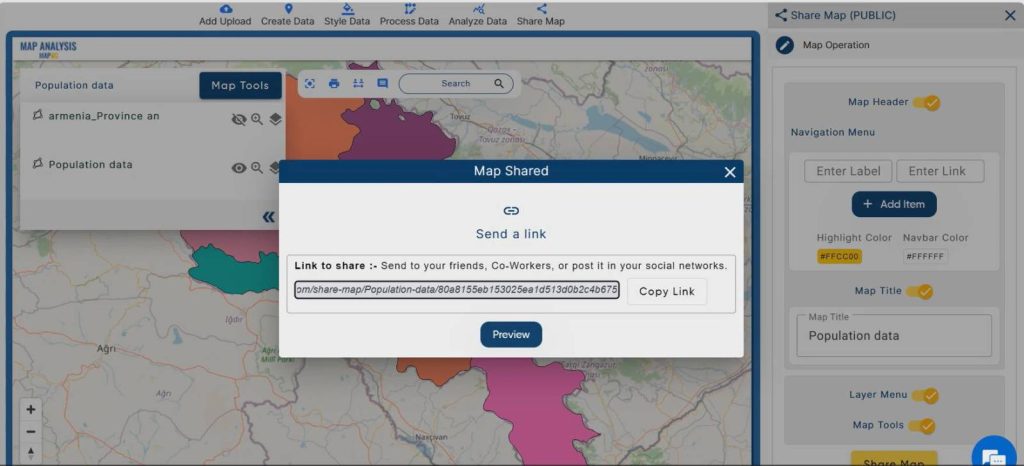
Share the map
Share the map to the public using the share data menu.
Major Benefits
- Identification of high-density population centers becomes easier.
- Demographic trends and patterns are easily identifiable.
- Regional disparities in population distribution are highlighted.
- Urbanization dynamics are clearer.
- Population density variations across different regions are apparent.
Domain and Industry
The integration of Excel attributes with MAPOG primarily belongs to the domain of demography and population analysis. It finds application in various industries and sectors where understanding population demographics is essential for decision-making in urban planning, public health, market research, environmental management, emergency management, and social sciences.
For more application of MAPOG in urban planning, go through the article- GIS Analysis in Urban Planning: Reshaping Transportation Future Insights of state/city
Conclusion
The Excel attribute tool of MAPOG GIS Platform offers a powerful solution for integrating and analyzing demographic data. By merging Excel attributes with spatial data, users can gain valuable insights into population distributions, trends, and patterns. This tool not only enhances decision-making capabilities but also finds application across a wide range of industries, making it an indispensable tool for demographic analysis.
GIS Data- City Level Data