In the fast-paced world of urban logistics, the ability to understand and optimize travel times is essential for businesses like food and grocery delivery services. One powerful tool in their arsenal is isochrone analysis. Isochrone Analysis: Mapping Travel Times, Let’s explore what isochrones are, how they work, and the significant impact they have on streamlining delivery operations.
Key Concept to Mapping Travel Times
Isochrones are lines on a map that connect points reachable within the same amount of time from a central location. They essentially represent travel time contours, showing areas that can be reached within specific timeframes. Additionally, articles like “Creating Travel Guides: Mapping with GIS Buffer Zones” and “Creating GIS Solutions for Urban Agriculture Map” offer deeper insights into GIS applications.
MAPOG Map Analysis, a simple tool designed to simplify the creation and interpretation of travel maps.
Implementing isochrone analysis in GIS follows a systematic approach, enabling analysts to delineate travel time contours effectively and enhance spatial analysis. Let’s delve into the process:
Step1: Data Integration:
Begin by integrating geographic data into GIS software, including information on transportation networks, points of interest, and any relevant demographic data.
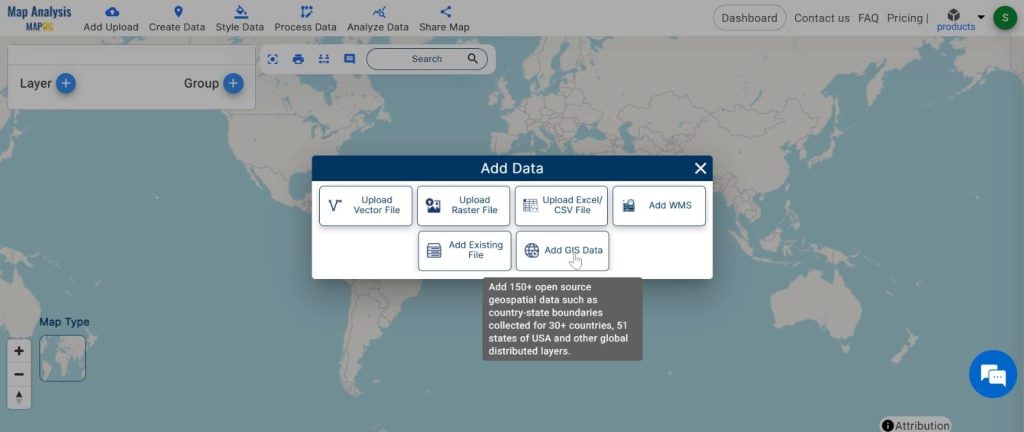
1.click on the “Add Upload” button and choose the “Add GIS Data” tool.
2.here select the search the country name.
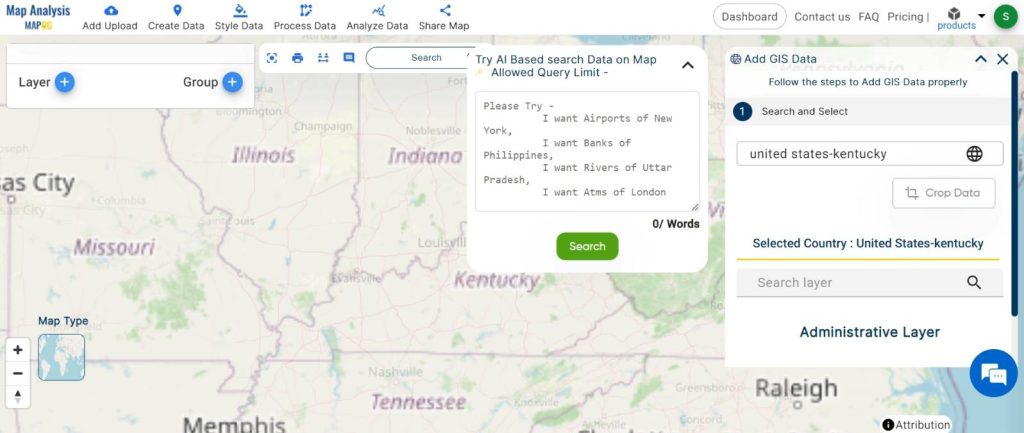
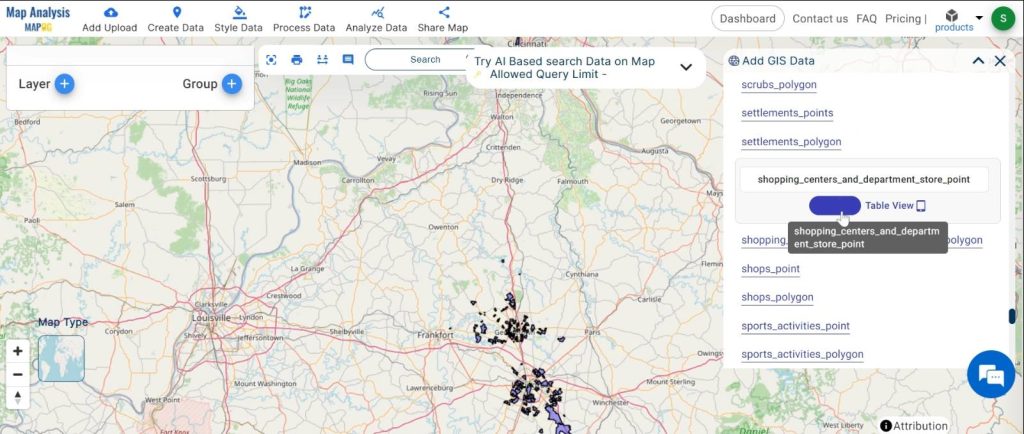
3. now add the layer.
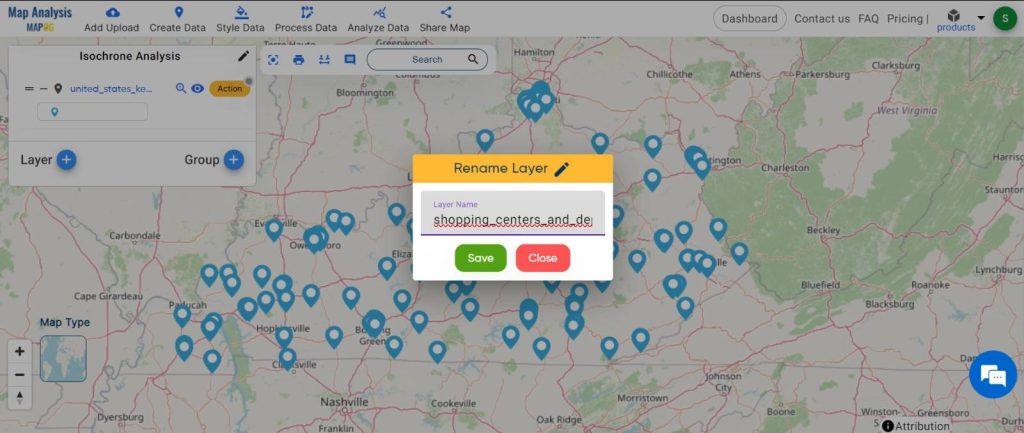
Step2: Name the untitled map and Rename the layer:
1.Here you have to name the untitled map
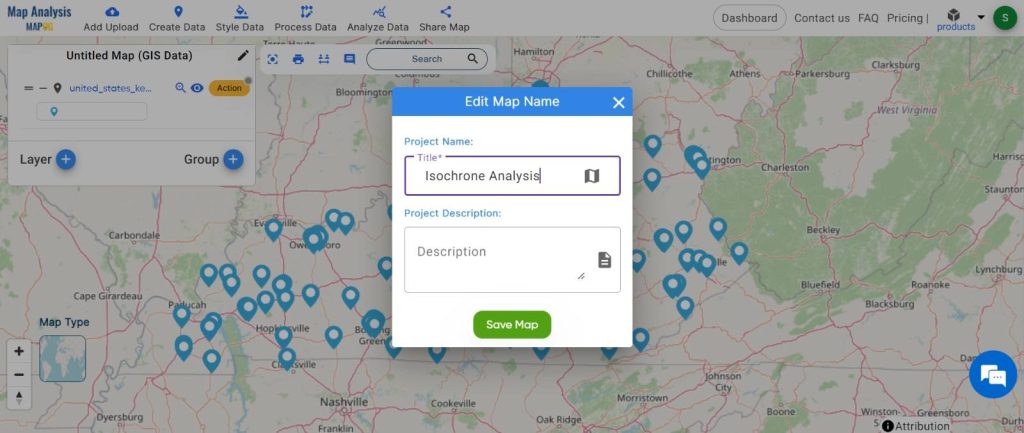
2.Rename the layer
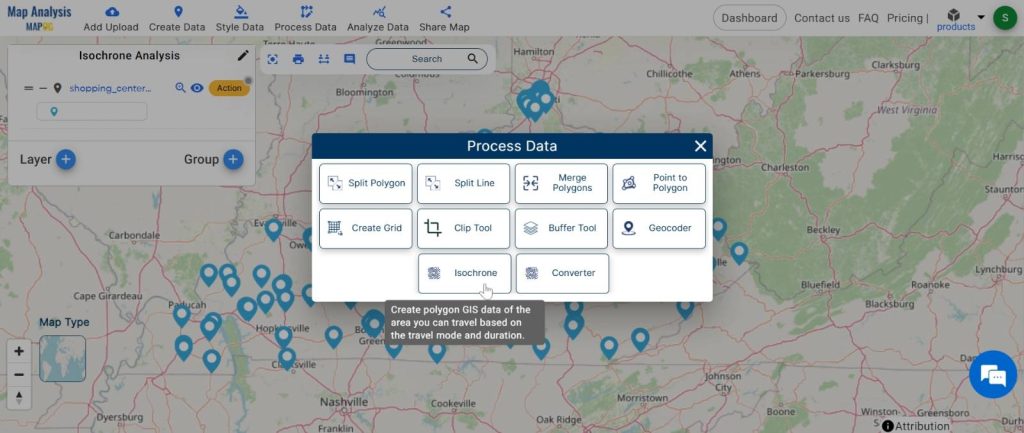
Step3: Isochrone Generation:
Utilize specialized tools within the GIS software to generate isochrones. These tools calculate travel times from a central location using various transportation modes and predefined time intervals.
1. Click on the “Process data” button and choose “Isochrones”.
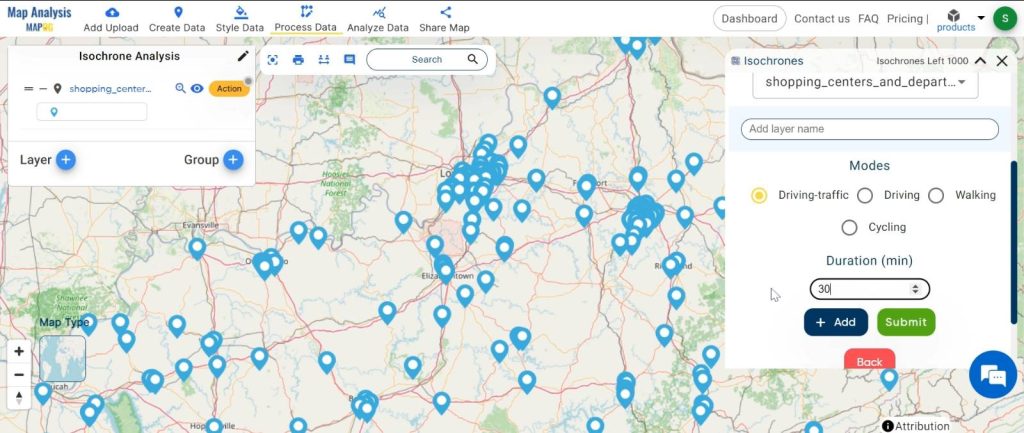
2. Here select the layer and set the duration 30 minutes.
And click on the “submit” button.
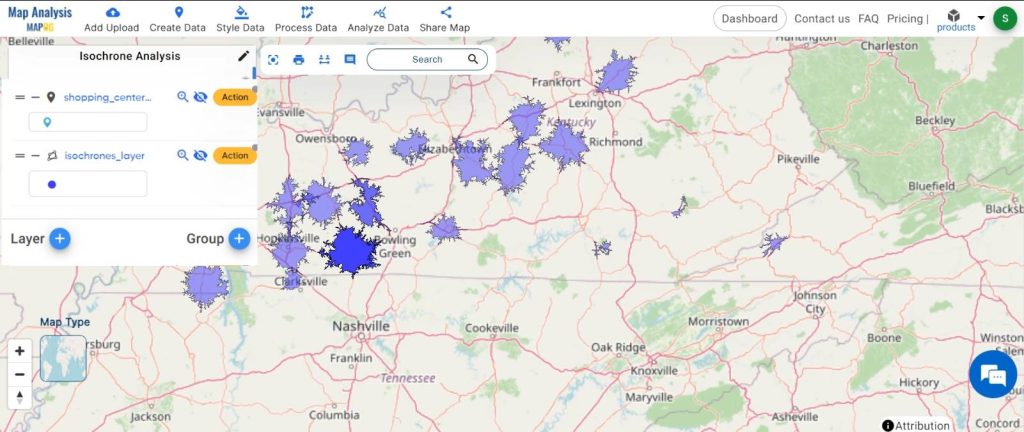
Step4: Visualization and Share:
Visualize the generated isochrones on the map, using color gradients or contour lines to represent different travel time intervals. This allows for easy interpretation and communication of results.

Major Findings:
- Isochrone analysis identifies optimal service areas for businesses, enhancing customer reach and resource allocation efficiency.
- It evaluates transportation network efficiency, aiding in route optimization and infrastructure planning.
- Isochrone analysis supports emergency response planning by identifying areas reachable within critical timeframes, improving preparedness and response times.
Domain and Industry:
The domain and industry applications of isochrone analysis encompass various sectors, including: Logistics and Delivery Services, Urban Planning and Development, Emergency Services
In conclusion, isochrone analysis in GIS offers valuable insights across industries, from optimizing routes to improving emergency response. Its simplicity and effectiveness empower decision-makers to enhance efficiency and better serve communities.
Link of the Data:
Explore the data further through our GIS Data product, uncovering valuable information for in-depth analysis and understanding.