Welcome to our exciting adventure through the world’s busiest cities! “Mapping Busiest Cities: A Visual Analysis”, We’ll be using maps to explore the vibrant energy of urban life and its significance in city planning.
Key Concept to Mapping Busiest Cities: A Visual Analysis
Our mission is to employ Map Story, an innovative tool, to create maps illustrating the bustling activity of cities. This visualisation aids in understanding urban dynamics and guides future planning efforts. Alongside this guide, datasets will be provided for practical application. Additionally, articles like “Creating Travel Guides: Mapping with GIS Buffer Zones” and “Creating GIS Solutions for Urban Agriculture Map” offer deeper insights into GIS applications.
MAPOG Map Story, a simple tool designed to simplify the creation and interpretation of travel maps.
Embarking on an Urban Analysis involves a structured method, enabling planners to comprehensively understand and plan for city dynamics. Let’s explore the step-by-step process:
Step 1: Add the Data:
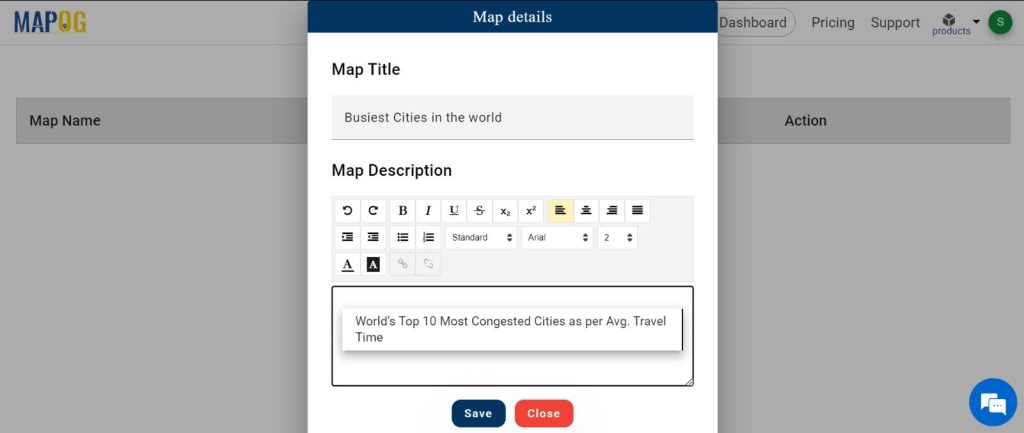
making a map and giving it a name and description.
Click on the “Create” button

and set the map name and description.
Step 2: Add points:
Include their level of activity, name, and color code for clarity.
1.click on the “Create story” button and choose “Add Point”.
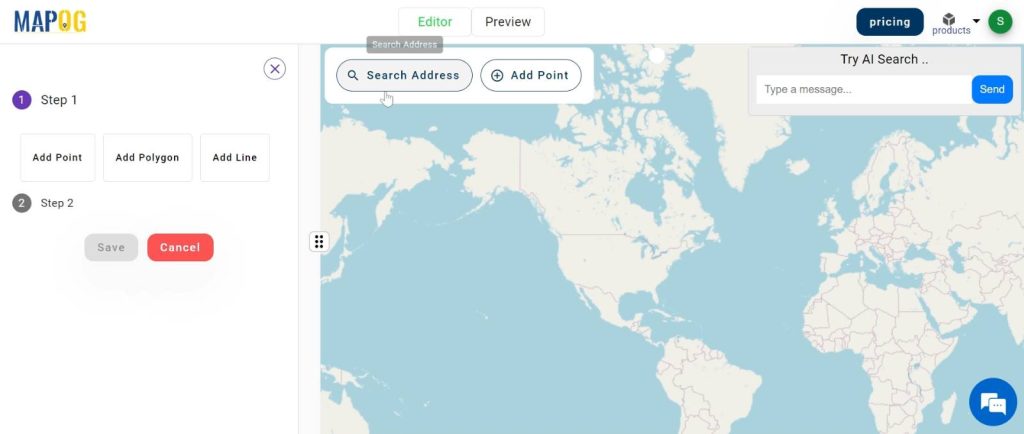
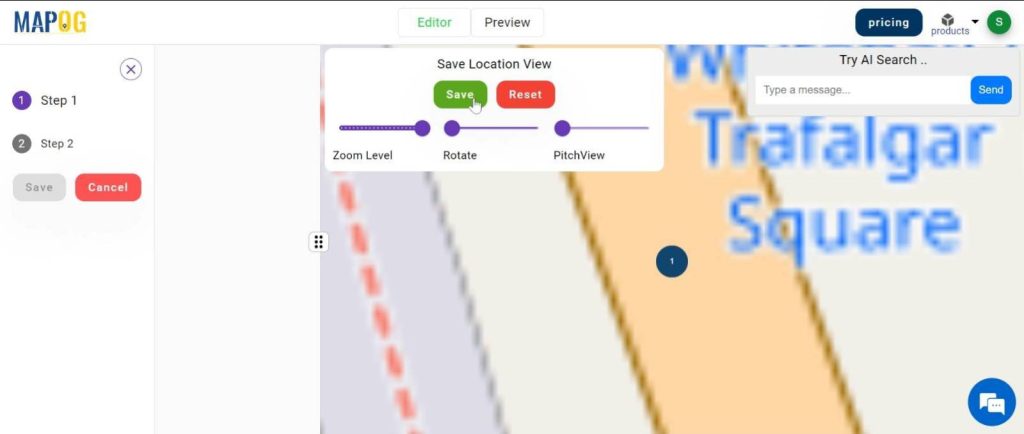
2.now search the address and plot the point. Click on the save button.
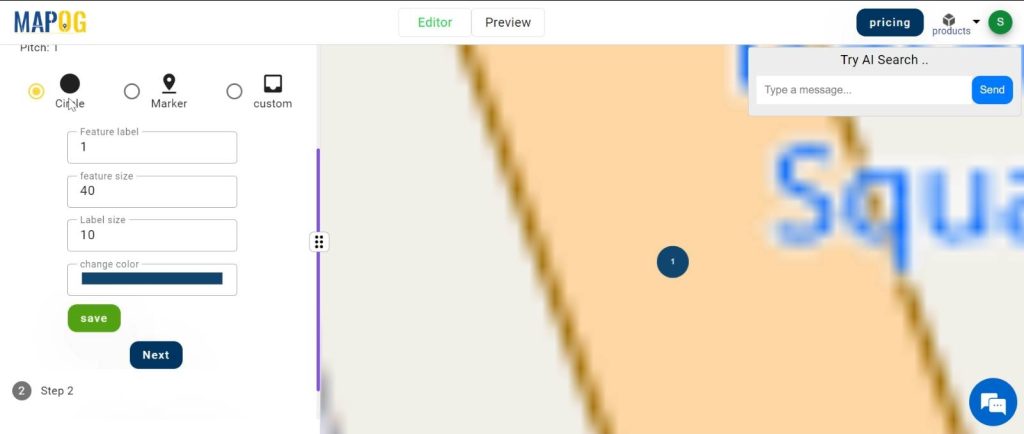
3.here, you can customise the point.
The 3 options are Circle, Marker and custom. Choose any of them and set the level feature and colour. And click on the “save” button.
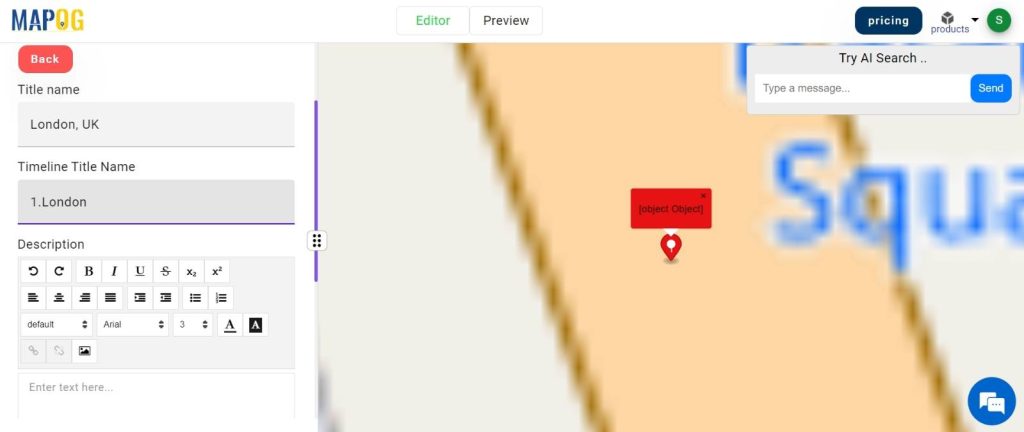
4. Next, add the point title. Also you can add the time title name.
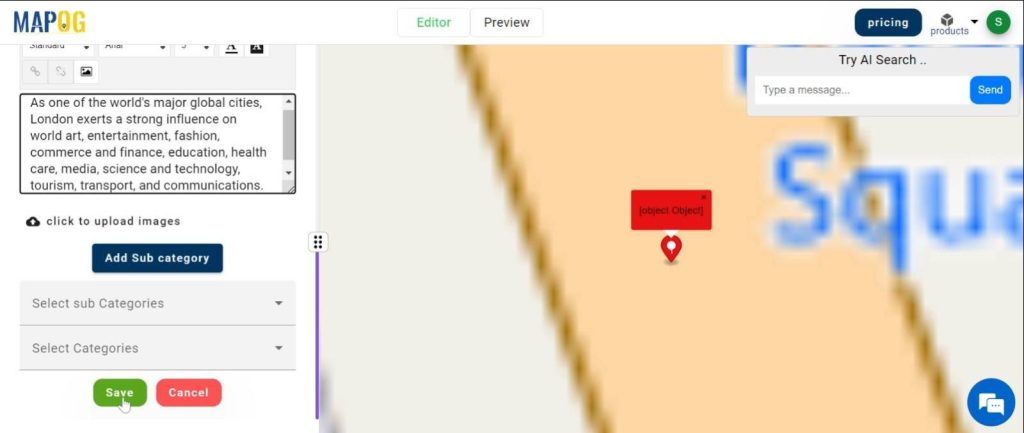
Add descriptions and also you can add the image for the point.
5.click on the save option.
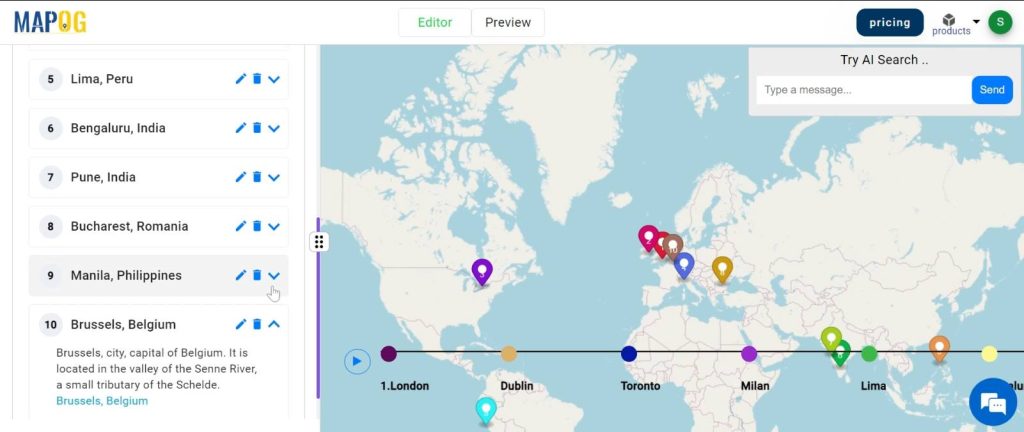
Similarly add the other cities points.
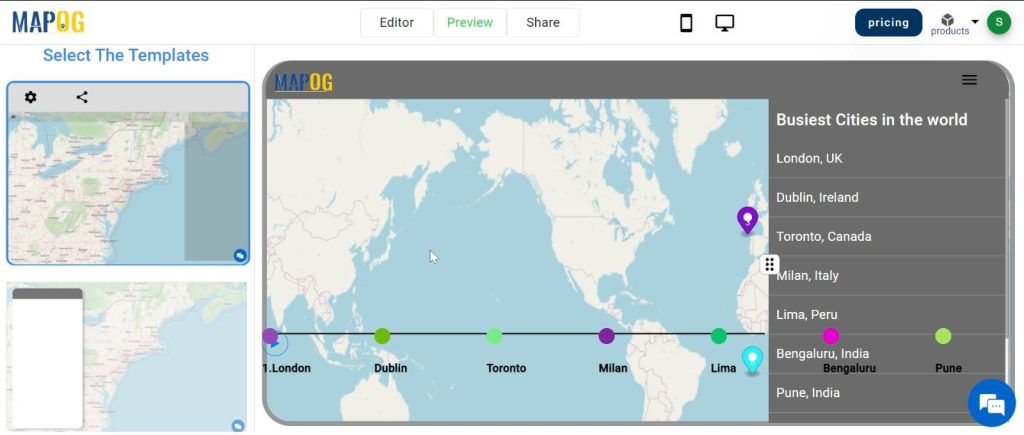
Step 3: Preview the map:
visualise the details then share it with others to explore.
Major Findings:
Our map unveils the pulsating energy of cities, offering insights into their diverse activities and growth patterns. Each revelation paints a vivid picture of urban life’s multifaceted nature.
Mapping bustling cities empowers us to plan for vibrant, inclusive urban spaces that cater to the needs of all inhabitants. As we conclude our journey, let us carry forward the lessons learned, shaping cities that thrive and flourish.