Mapping the rivers within a state is crucial for understanding their interaction with other geographical features. Using the MAPOG Map Analysis platform, you can easily visualize these intersections.
The Cross Intersection tool helps you identify where rivers cross roads, railways, and boundaries, providing valuable insights for environmental monitoring and urban planning.
Discover how MAPOG can simplify your mapping tasks and enhance your analysis.

KEY CONCEPTS
Our goal is to create a simple and interactive map of Rivers within a state boundary using the Cross Intersection tool of the MAPOG Map Analysis.
Learn more about mapping rivers here Create a Category Style Map – Mapping Rivers in different Colors
Steps for Creating a Map through Cross Intersection
Below are the steps to follow to create the map
- Open Map Analysis
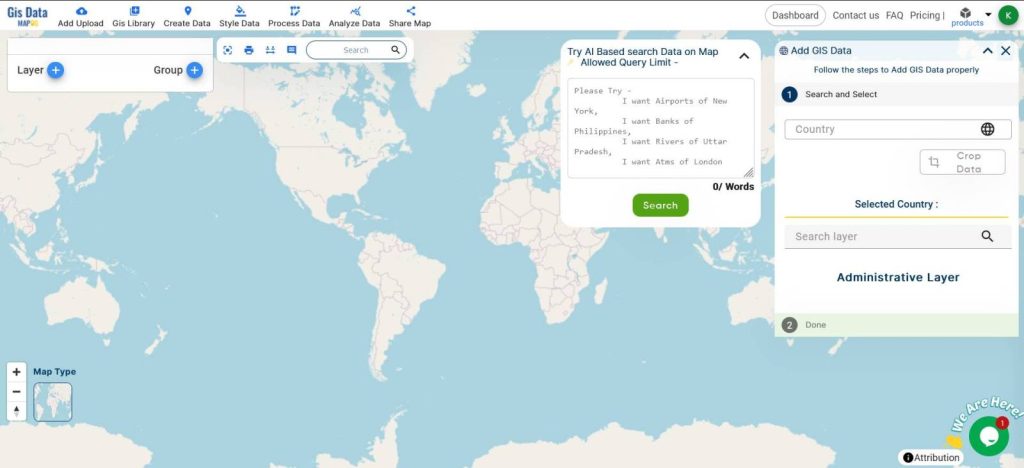
- Click on GIS Libraries
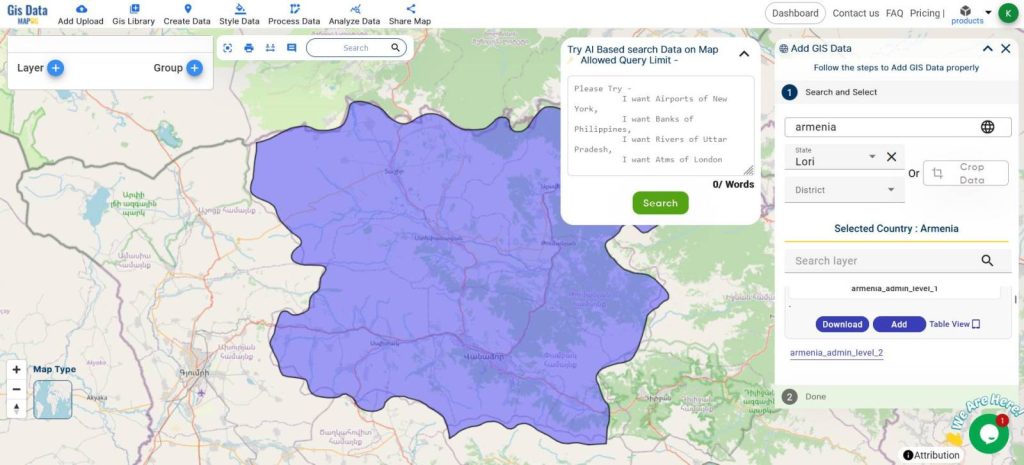
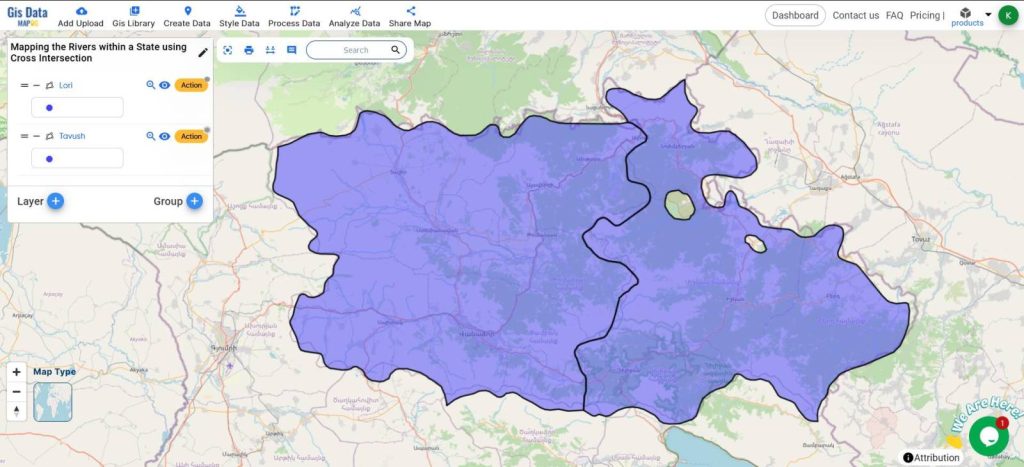
- Add the Admin Boundaries of the target States
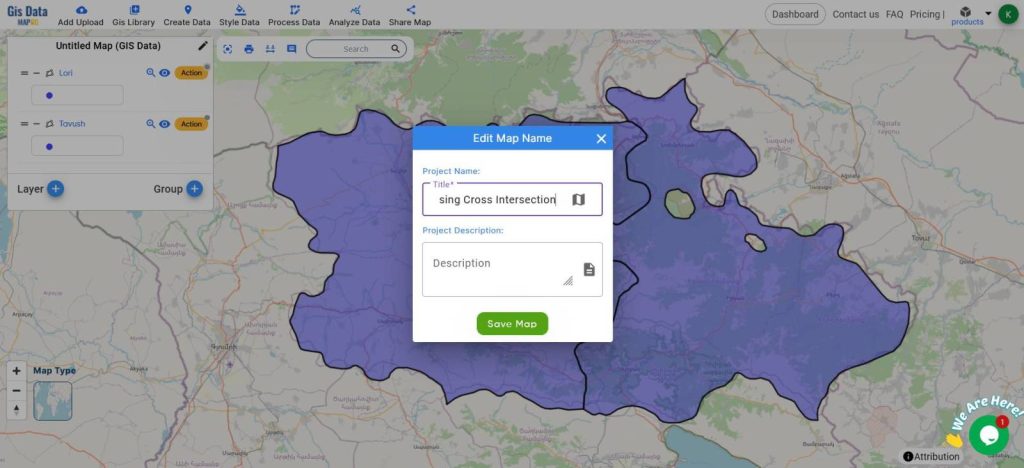
- Rename the Map
- This is how it should look after adding the Admin boundaries
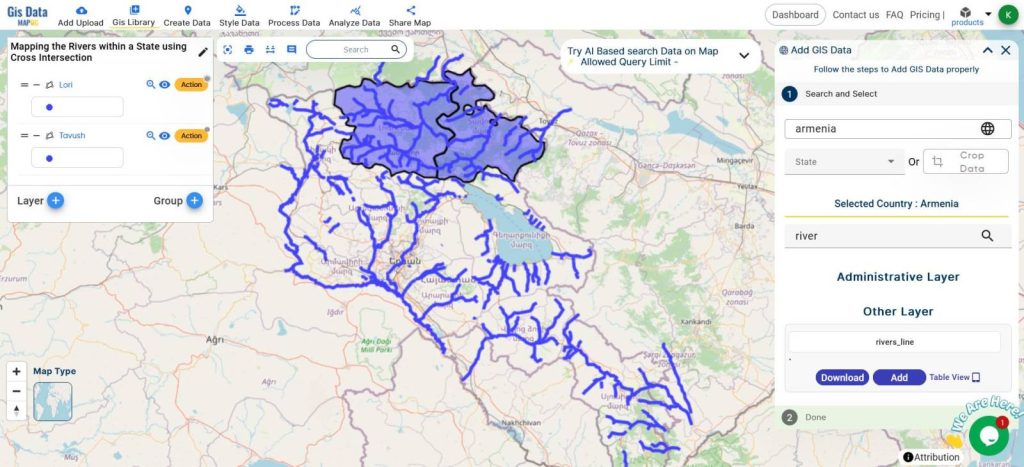
- Also, Add the River Lines Data
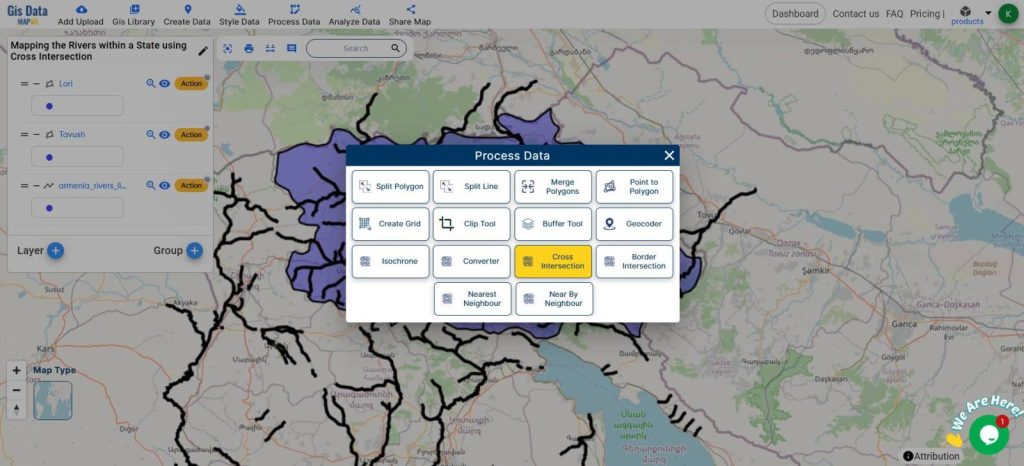
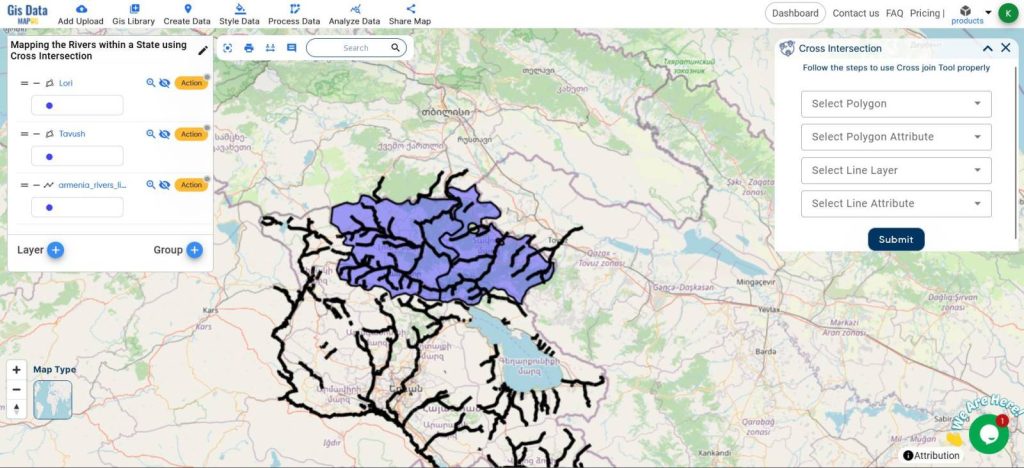
- From the Process Data, click Cross Intersection
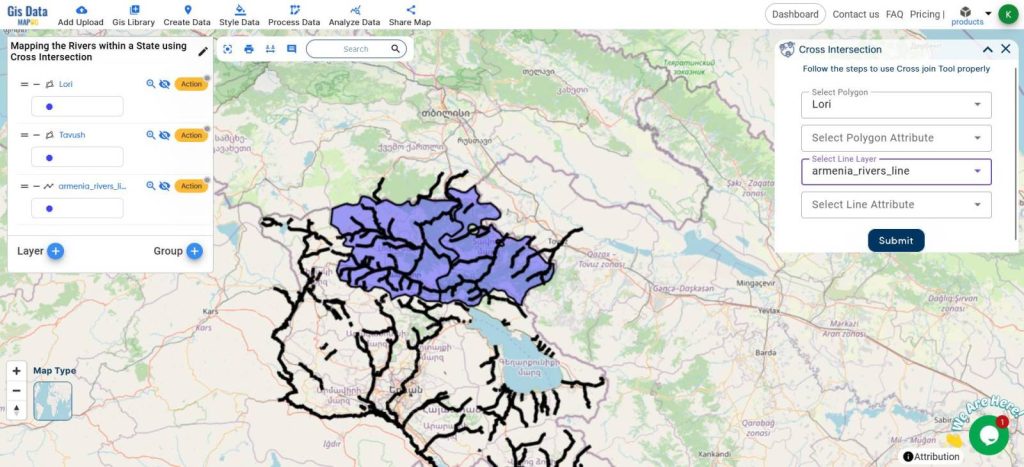
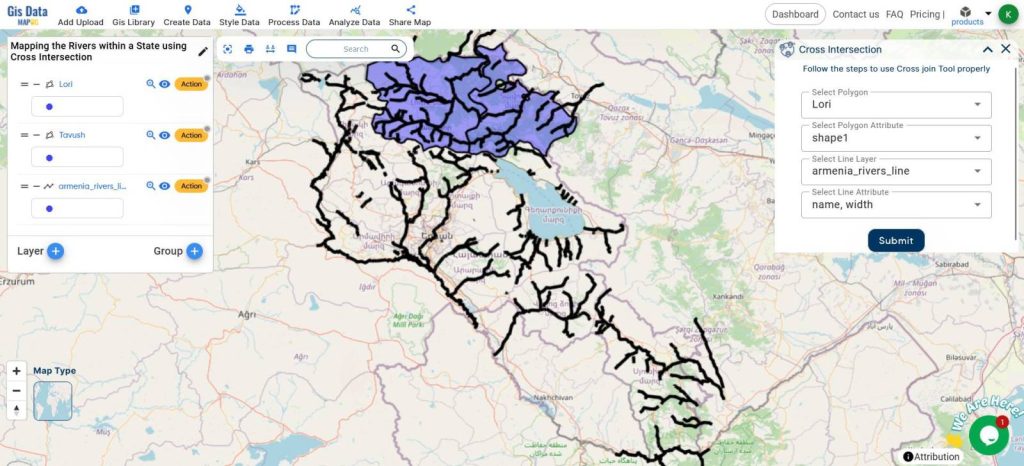
- Select the Target State for the Polygon Layer
- Select the River for the Line Layer
- Choose the attributes to be there in the newly formed layer
- Click Submit
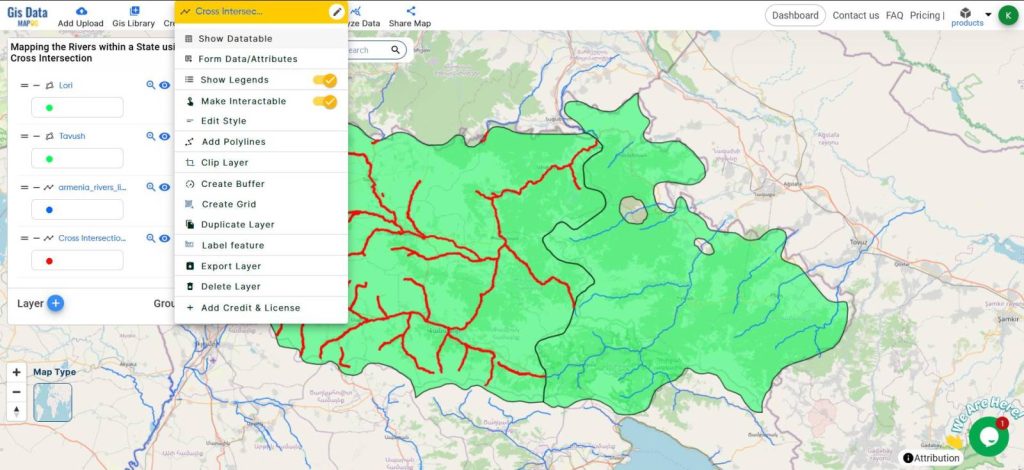
- Style the layers accordingly.
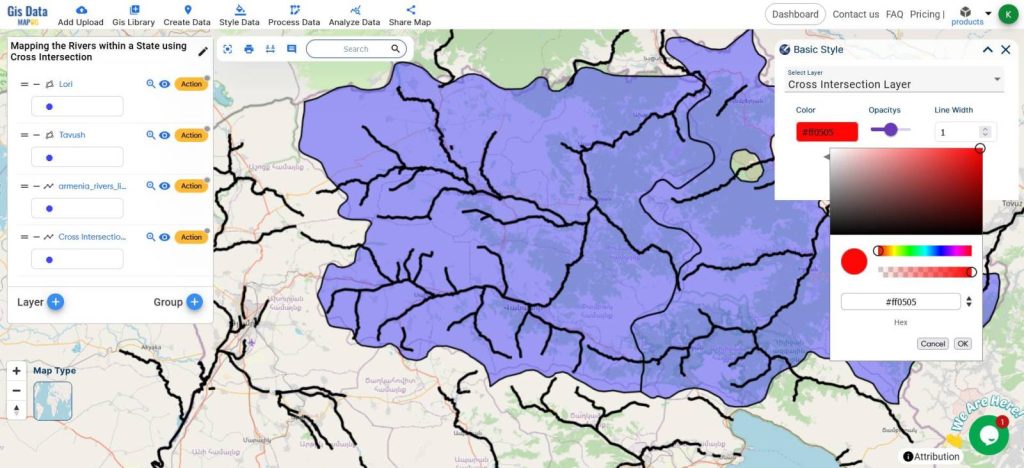

A new line layer will be formed containing the rivers Intersecting the state boundary polygon.
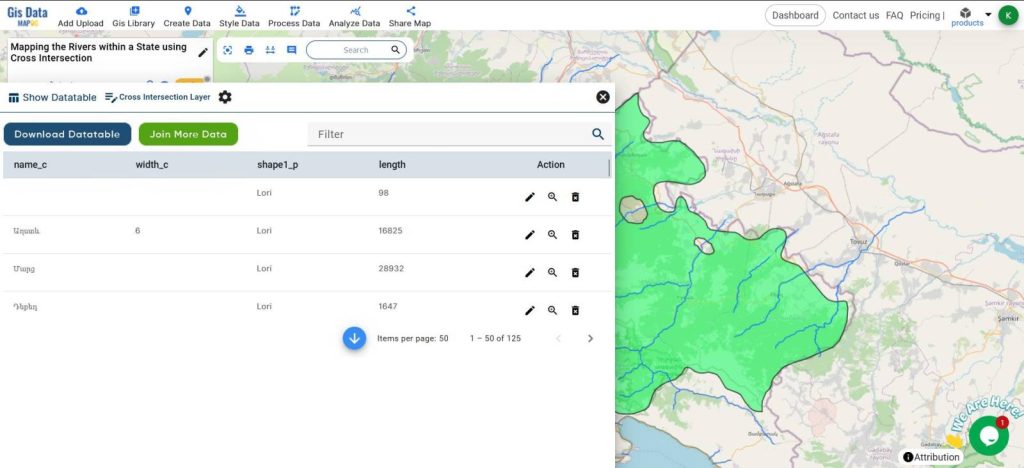
View the Datatable of this layer by going to Layer Action – Show Datatable
The length of individual river segments is given in meters here.
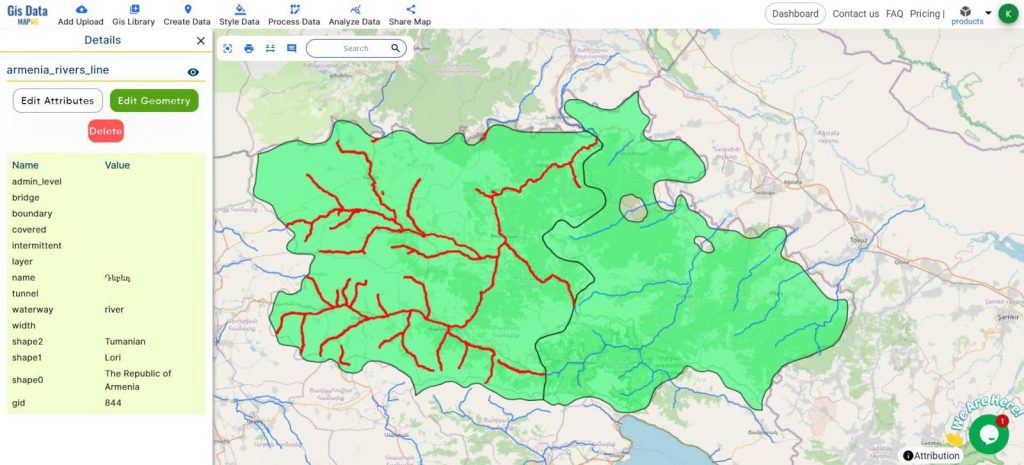
Click on the newly formed layer for more details about it.
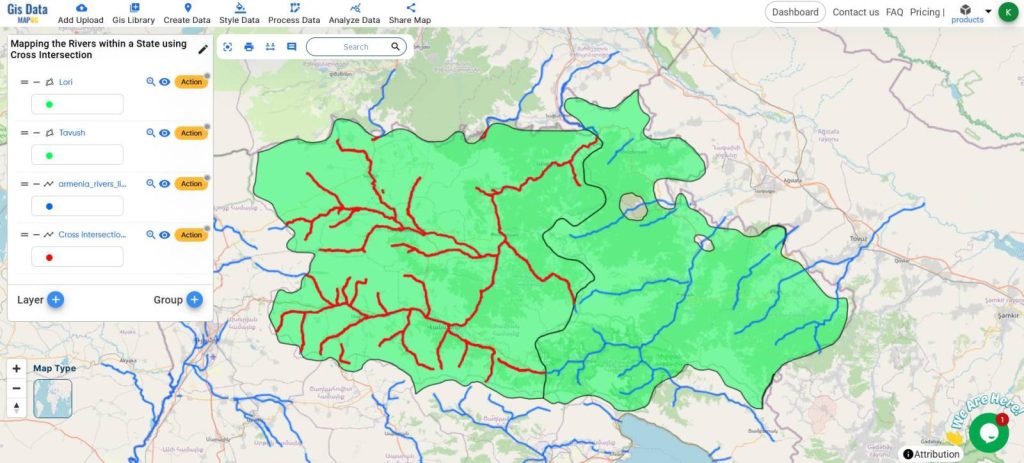
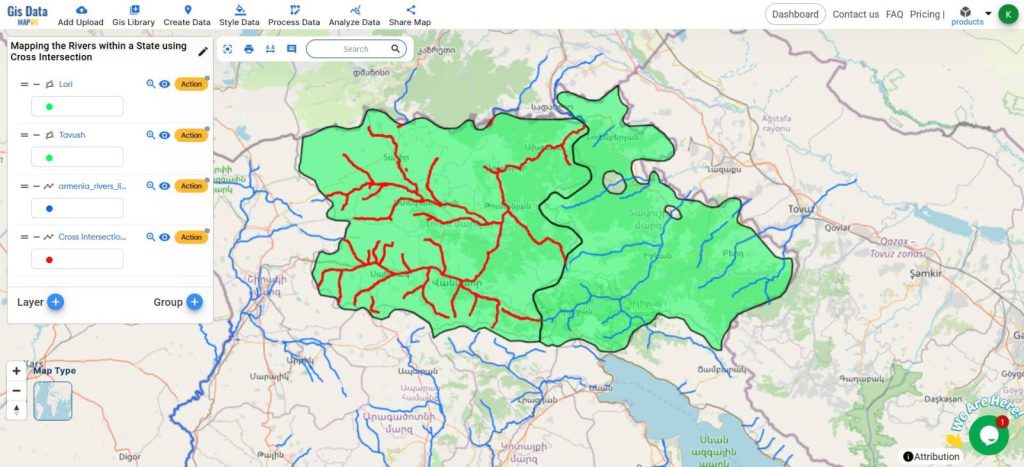
This is the Final Map
This powerful tool enables you to identify and visualize the intersections of rivers with other key geographical features such as administrative boundaries.
Understanding these intersections is crucial for applications in environmental monitoring, urban planning, and disaster management.
MAJOR FINDINGS
- Critical Intersection Points: Identifies key locations where rivers crossroads and railways, highlighting flood-prone zones and areas needing infrastructure planning.
- Environmental Impact Zones: Highlights regions where rivers intersect with administrative boundaries and protected areas, aiding in pollution control and conservation efforts.
- Resource Management and Planning: Provides data for managing water resources, identifying sites for irrigation and hydroelectric power, and ensuring sustainable development.
BENEFICIAL DOMAIN: Environmental Monitoring and Urban Planning and Infrastructure Development
- Environmental Monitoring: Identifies critical impact zones for effective pollution control and conservation efforts, ensuring better protection of natural habitats.
- Urban Planning and Infrastructure Development: Highlights where rivers intersect with roads and railways, aiding in flood management and supporting sustainable infrastructure planning and development.
For any inquiries or support needs, feel free to contact us at support@mapog.com.
CONCLUSION
Using the MAPOG Map Analysis platform and its cross-intersection tool provides valuable insights into how rivers interact with other geographical features.
This analysis is essential for effective environmental monitoring and sustainable urban planning. By identifying critical impact zones and infrastructure intersections, MAPOG helps ensure better resource management and disaster preparedness.
Explore the full potential of MAPOG Map Analysis to enhance your understanding and decision-making.
VIEW OUR PREVIOUS BLOGS
Step-by-Step Guide: Creating a Dynamic Bubble Map for Free – Exploring Population Demographic
Mapping Soil Types: A Visual Guide with a Category Style Map