You can optimize your supply chain using the Isochrone tool, With MAPOG MAP ANALYSIS.
Isochrone mapping helps visualize travel times around supply depots, pinpointing the best locations for efficient deliveries. Discover how this simple yet powerful technique can transform your logistics.

KEY CONCEPTS
Our goal is to create a simple and interactive map that covers the areas that can be reached within 60 minutes Of the Refineries, in order to establish the supply depots.
Learn more about Isochrones here Mapping EV Charging Station Accessibility with Isochrone Analysis
Steps for Creating a Map through Isochrones
Below are the steps to follow to create the map
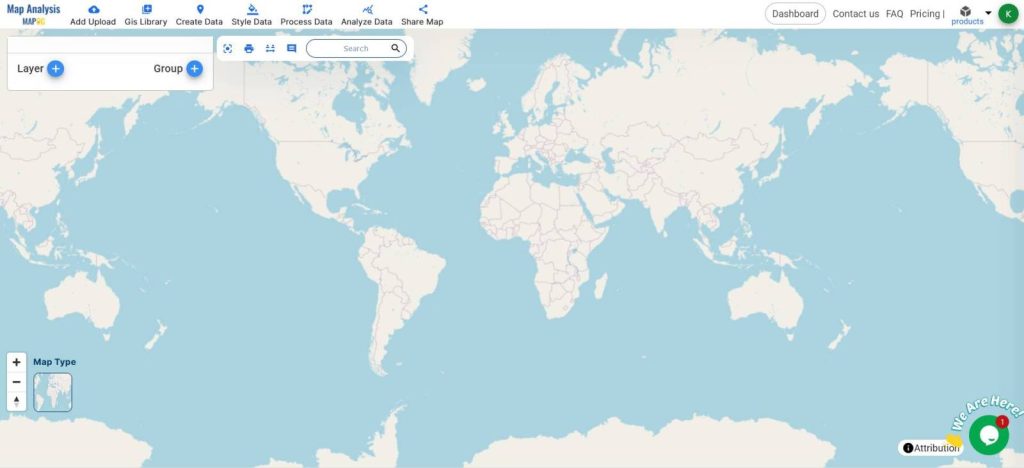
- Open Map Analysis
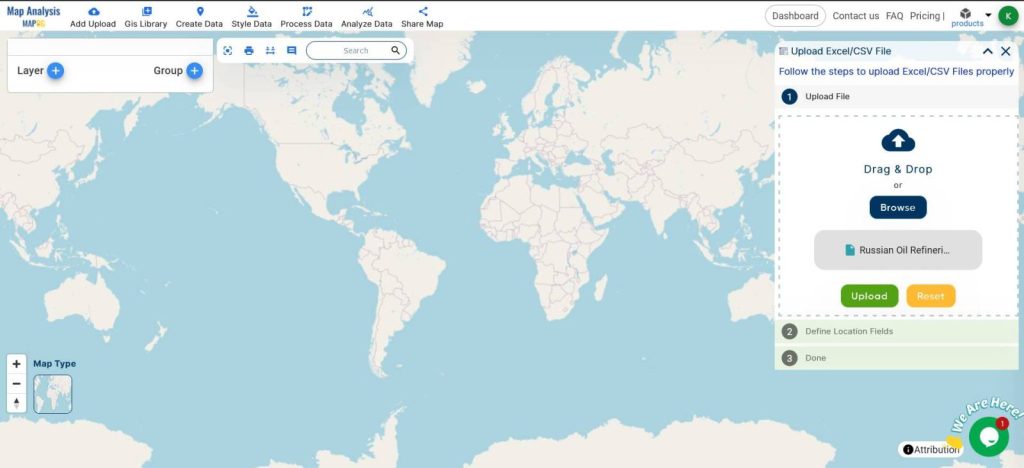
- Add Upload, Upload CSV File
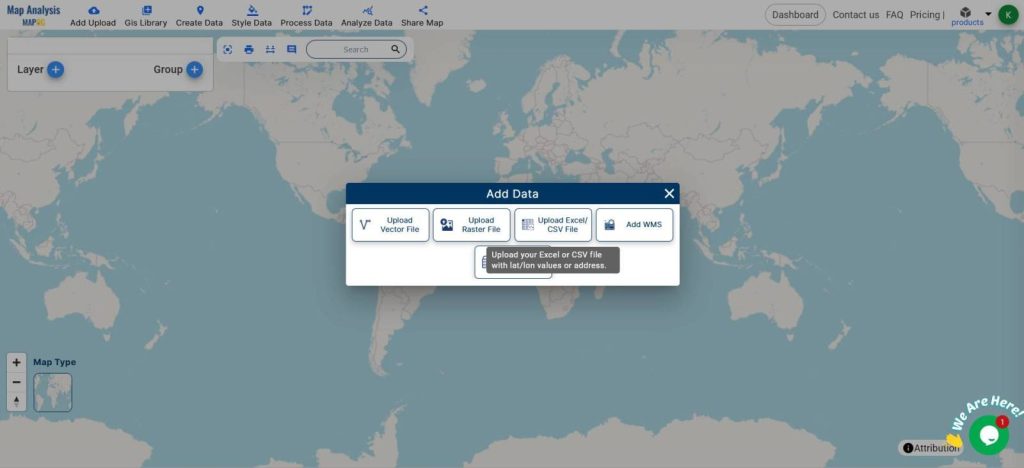
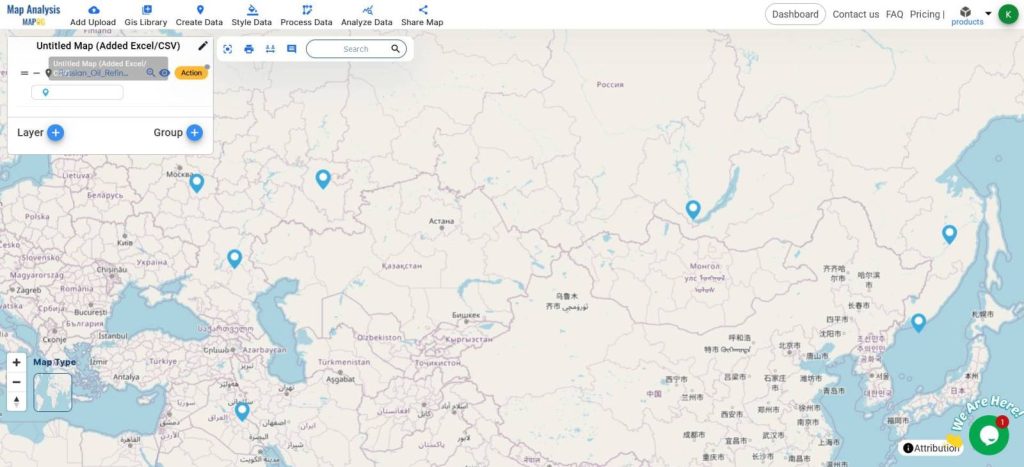
- Upload the .csv file containing the Refinery Data
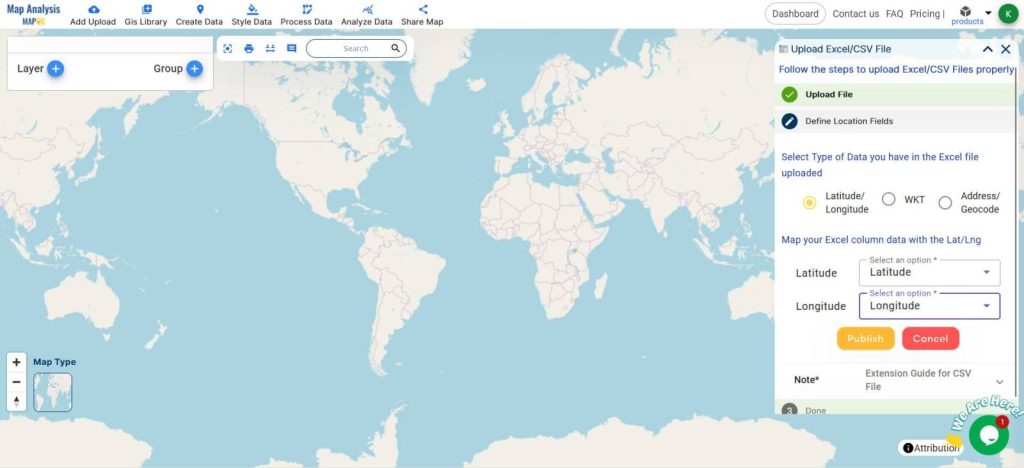
- Once Uploaded, it should Look like this
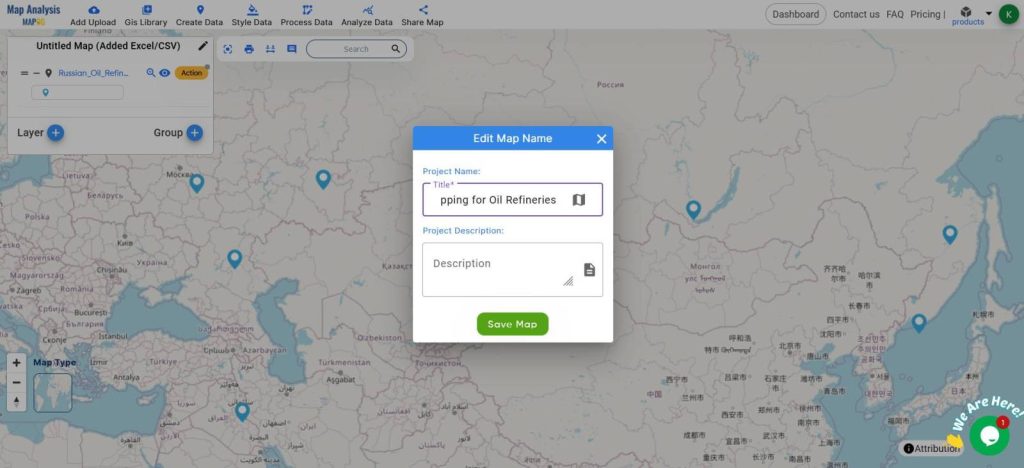
- Rename the Map through the edit icon on top of the layers panel
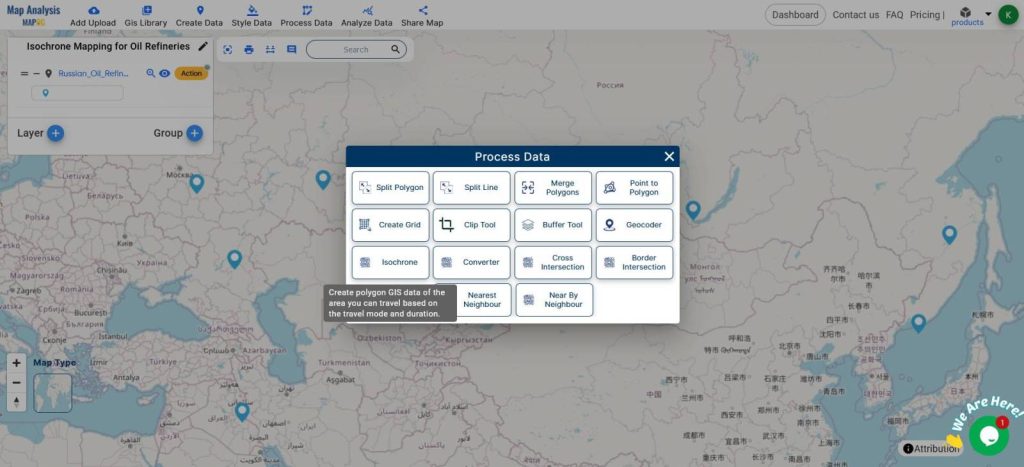
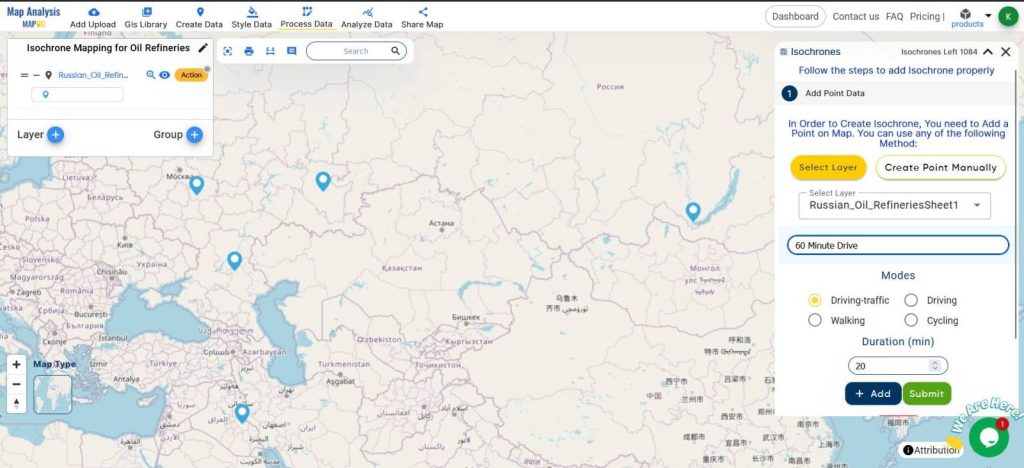
- From the Process Data, Choose Isochrones
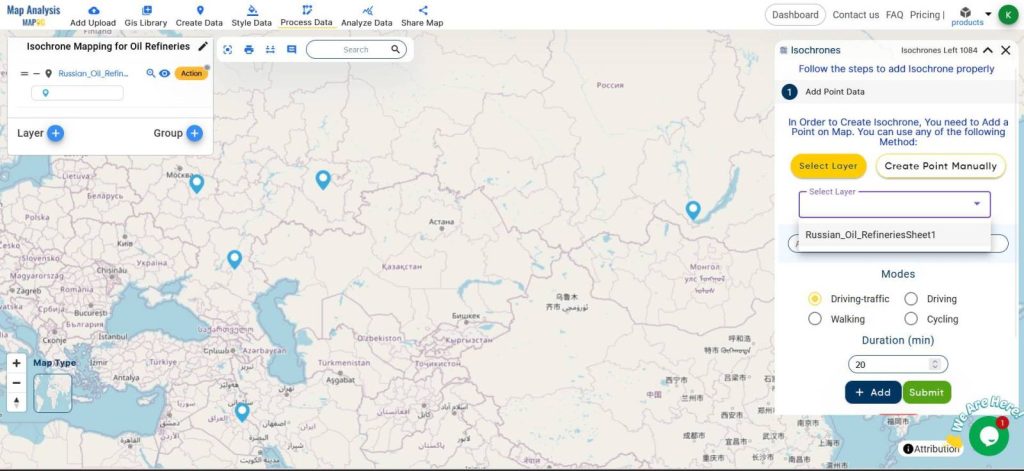
- Select the Points Layer
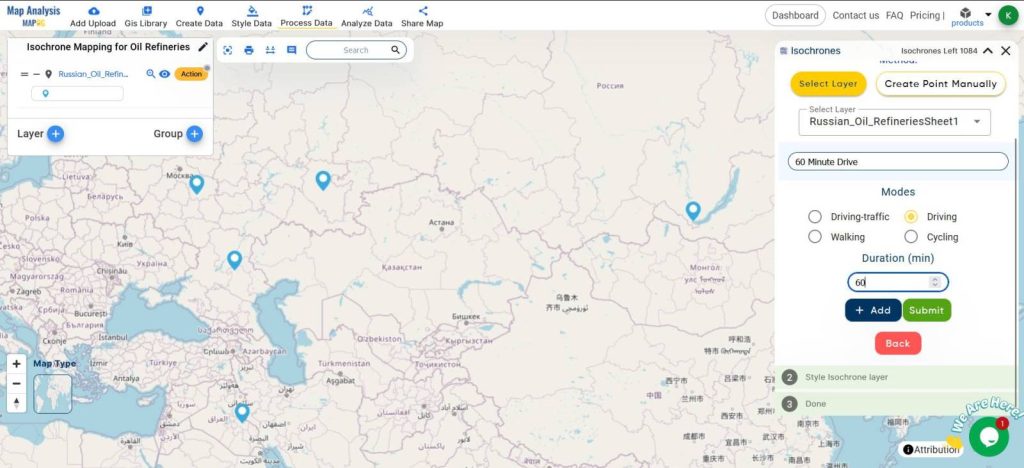
- Give the name 60 Minutes Drive
- Choose Driving as the Mode
- Duration 60 Minutes
- Click Submit
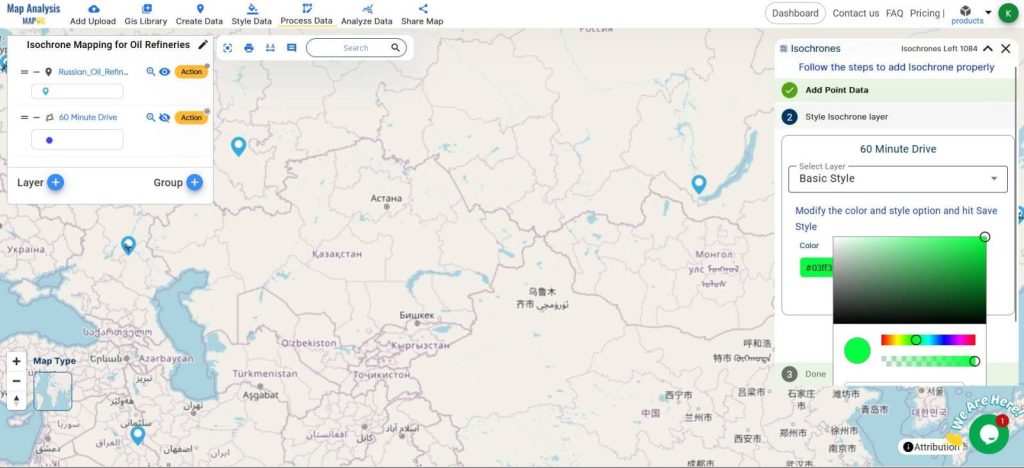
- An Isochrone 60 Minute Drive from the Refinery Points will be created. You can style the layer accordingly using style data features.
- Also, label the points from the Label features option.
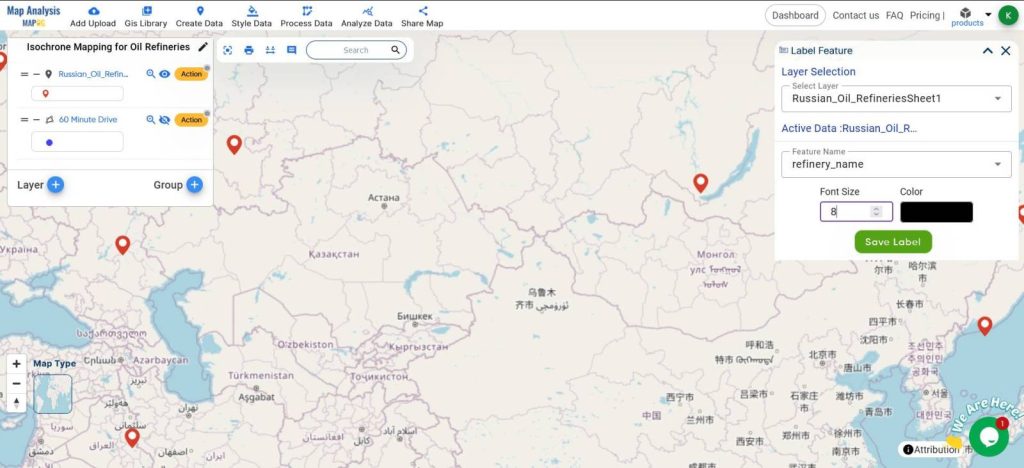
- I will focus on one particular isochrone since it is difficult to focus all the data at large scales.
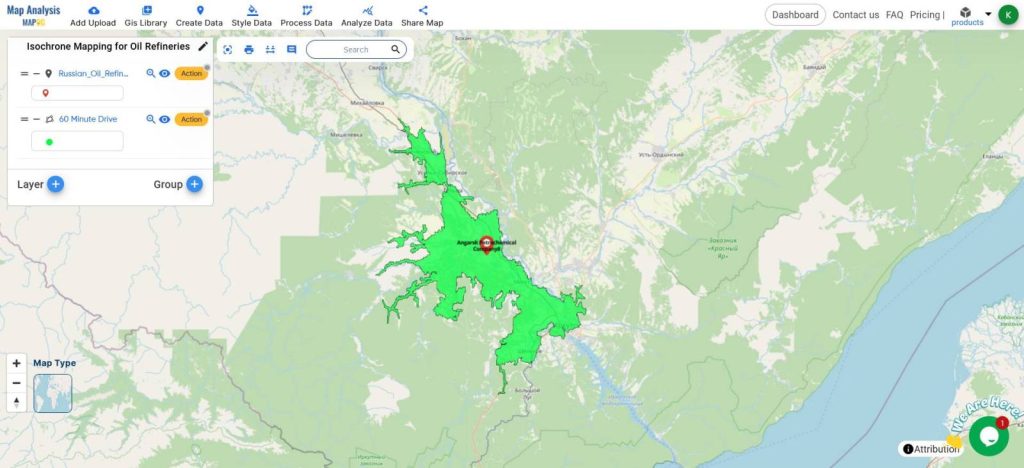
The green isochrones cover the areas that can be reached within 60 minutes Of the Refineries.
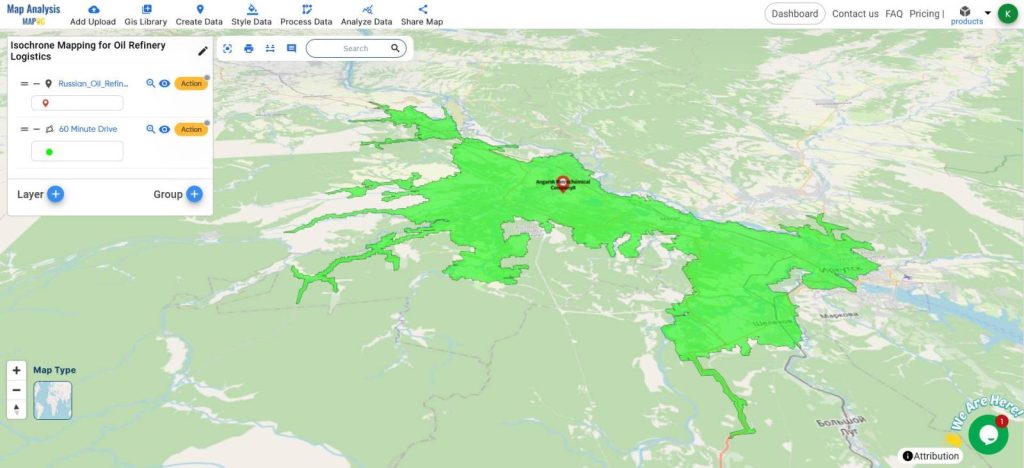
The decision-makers can decide to establish new supply depots within this region to optimize the location to ensure timely and cost-effective delivery of supplies to refineries.
MAJOR FINDINGS
- Optimal Depot Locations: Isochrone mapping pinpointed the best supply depot locations, reducing travel times to refineries and boosting logistics efficiency.
- Lower Transportation Costs: Optimized depot placement leads to shorter travel distances, cutting fuel consumption and operational expenses.
- Reliable Deliveries: Improved coverage ensures timely and reliable supply deliveries to refineries, minimizing downtime.
BENEFICIAL DOMAIN: Cost Efficiency and Operational Reliability
- Cost Efficiency: Optimizing depot locations significantly reduces transportation costs by minimizing travel distances and fuel consumption.
- Operational Reliability: Ensuring timely and reliable deliveries to refineries enhances operational continuity and reduces downtime.
For any inquiries or support needs, feel free to contact us at support@mapog.com.
CONCLUSION
In conclusion, the Isochrone Mapping for Refinery Logistics using MAPOG Map Analysis provides valuable insights into optimizing supply depot locations.
By reducing transportation costs and enhancing delivery reliability, this analysis ensures a more efficient and effective logistics network for oil refineries. Leverage MAPOG Map Analysis to transform your logistics and achieve operational excellence.
VIEW OUR PREVIOUS BLOGS
Create Map for Worldwide Noise Pollution Analysis Using Heat Map
Create an Age Demographics Map: Visualizing Spatial Patterns in Population Dynamics
Creating a Map for Agricultural Land Damage Assessment due to War and Natural Calamities