Visualizing COVID-19 Mortality Patterns: Heatmap Analysis
Explore COVID-19 mortality patterns through heatmap analysis. Visualize and analyze data for informed insights into disease impact and response strategies.
Explore COVID-19 mortality patterns through heatmap analysis. Visualize and analyze data for informed insights into disease impact and response strategies.
This analysis yields insights into urban trends, spatial patterns, infrastructure needs, land use planning, equity, sustainability, and resource allocation.
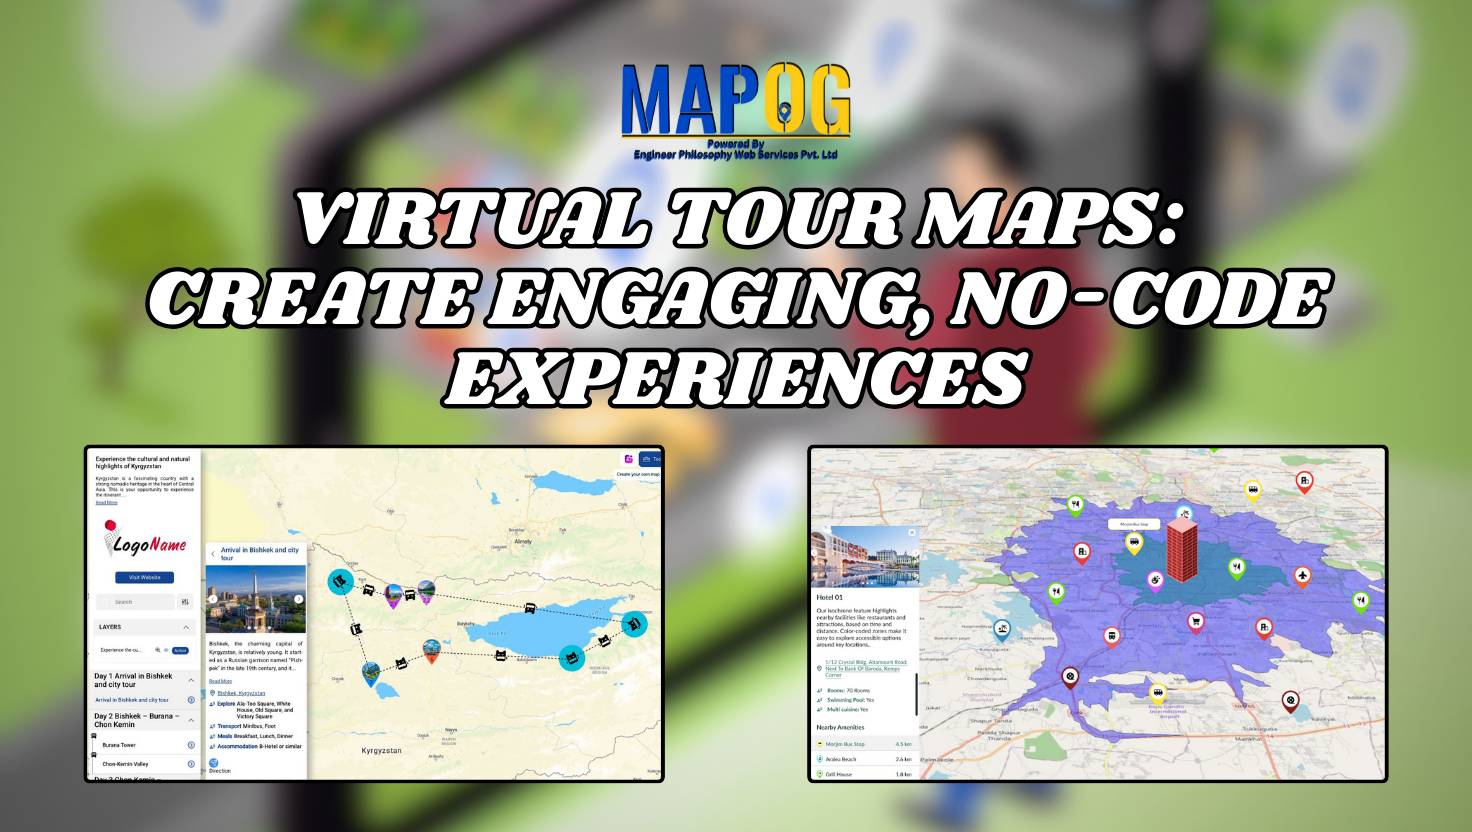
In an increasingly digital-first world, how we explore, explain, and experience places is changing rapidly. Today, virtual tour maps are not just tools for navigation—they’re powerful platforms for creating engaging, interactive experiences. Whether you’re in Tourism, Real Estate, Education, Retail , or Culture , virtual tours built with interactive maps are transforming how audiences engage … Read more
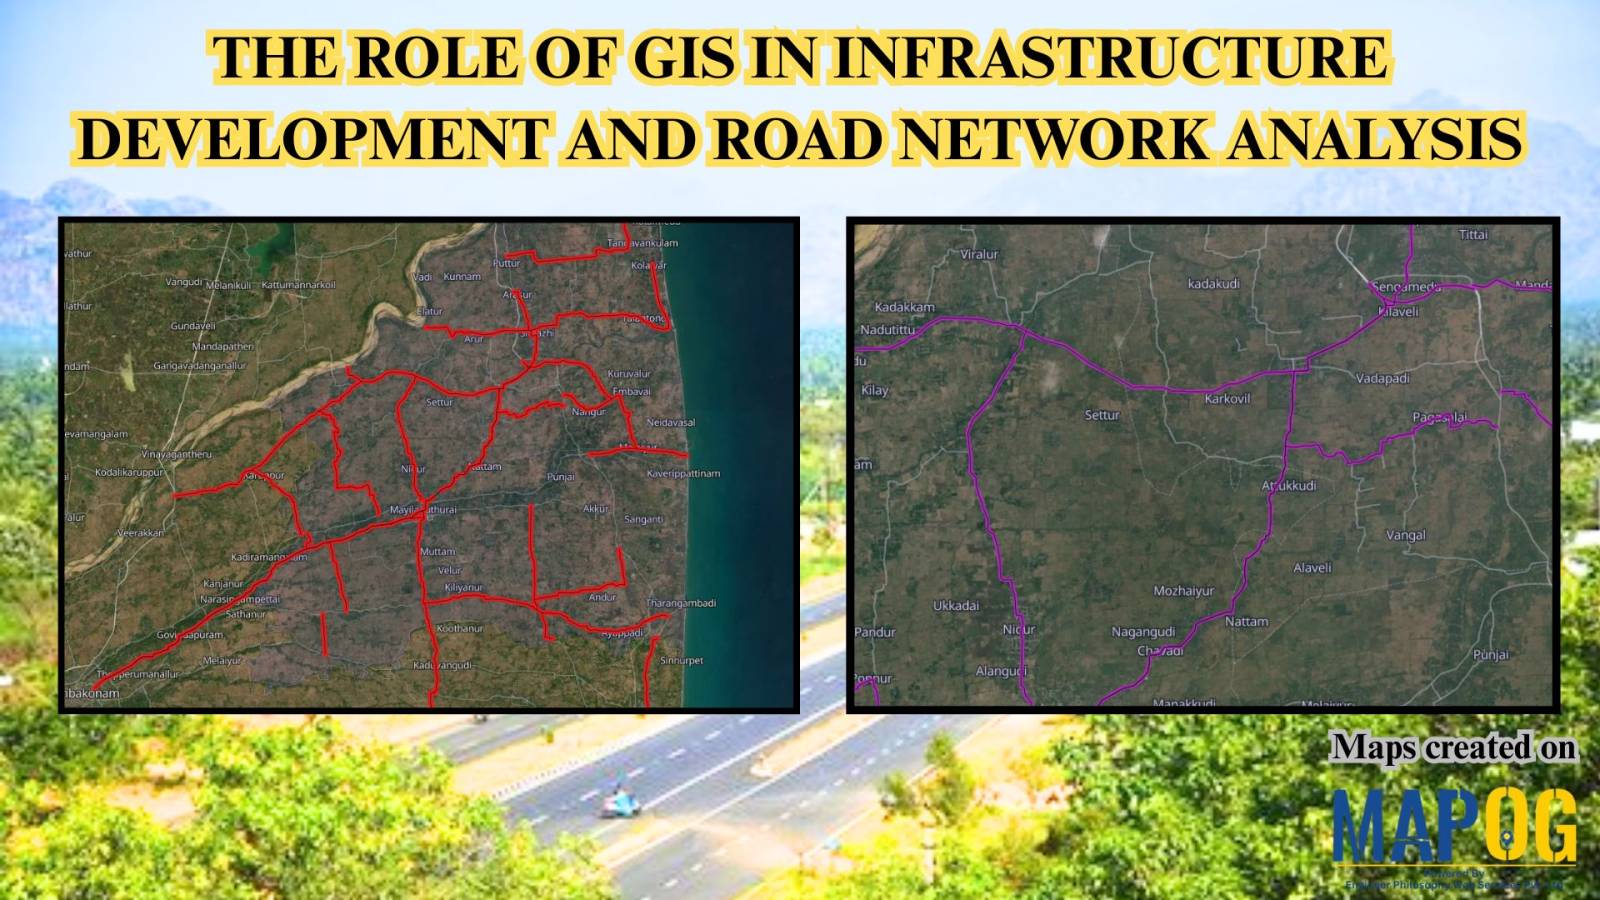
GIS (Geographic Information Systems) plays a transformative role in the Road Network Analysis development and analysis of infrastructure, particularly in designing and optimizing road networks. By integrating spatial data with planning tools, GIS enables engineers, urban planners, and policymakers to make data-driven decisions. It supports the entire infrastructure lifecycle—from feasibility studies and planning to construction … Read more
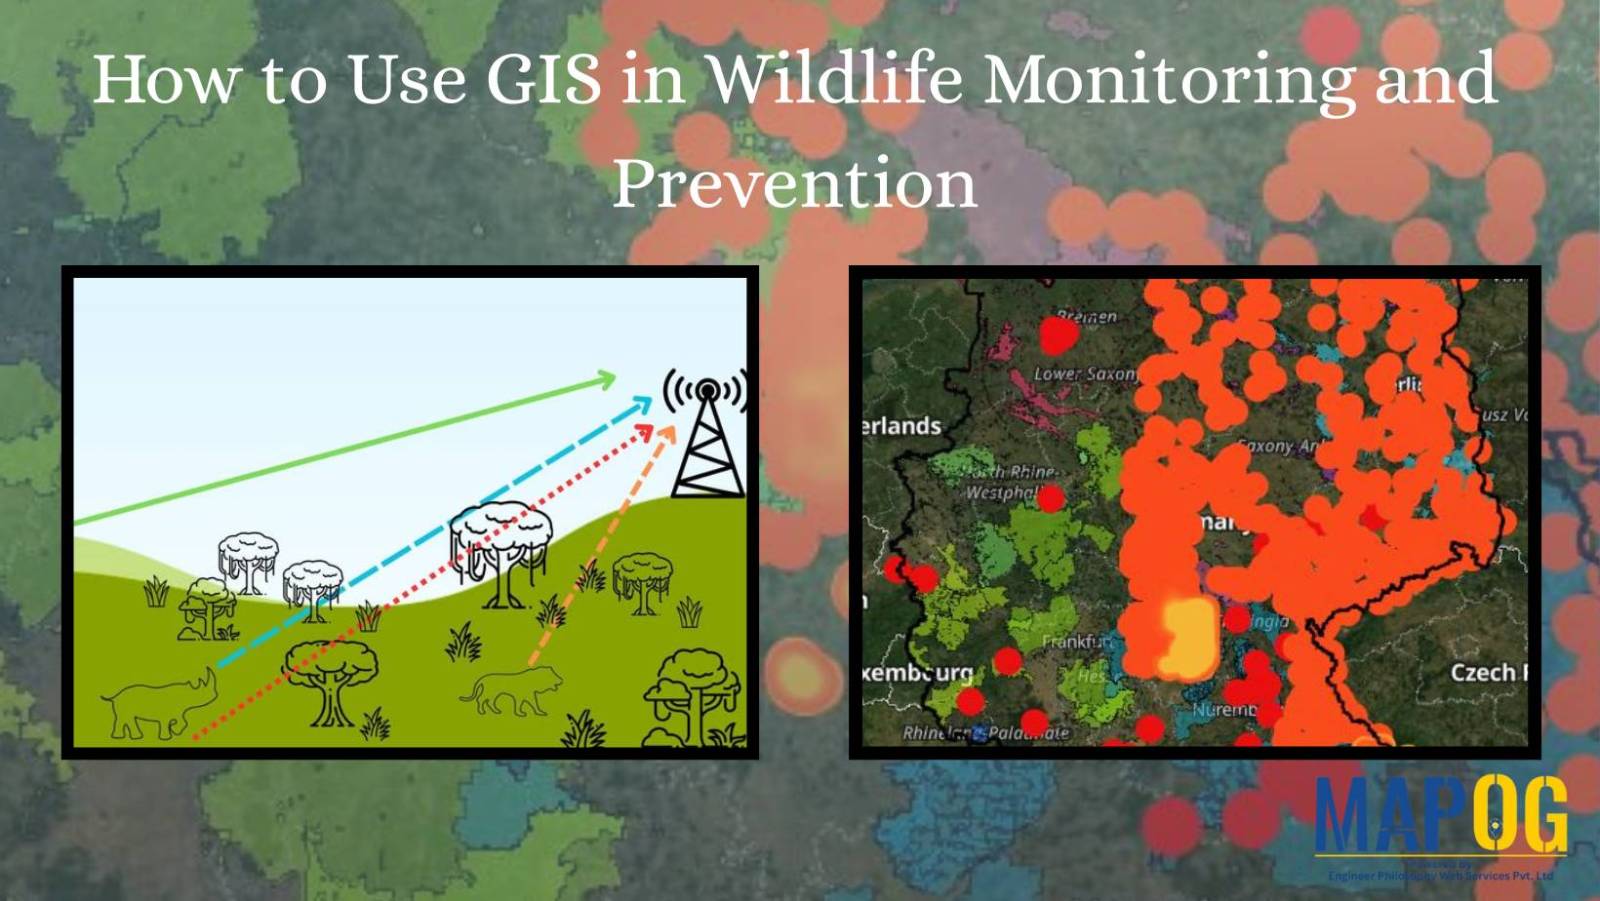
As biodiversity faces unprecedented loss, conservationists are using advanced mapping technology to fight back. Geographic Information Systems (GIS) have evolved into powerful tools for wildlife monitoring and protection, enabling teams to plan migration corridors, predict poaching hotspots. This technology is empowering rangers and researchers to make faster, smarter decisions, helping reverse biodiversity loss. Key Concept … Read more
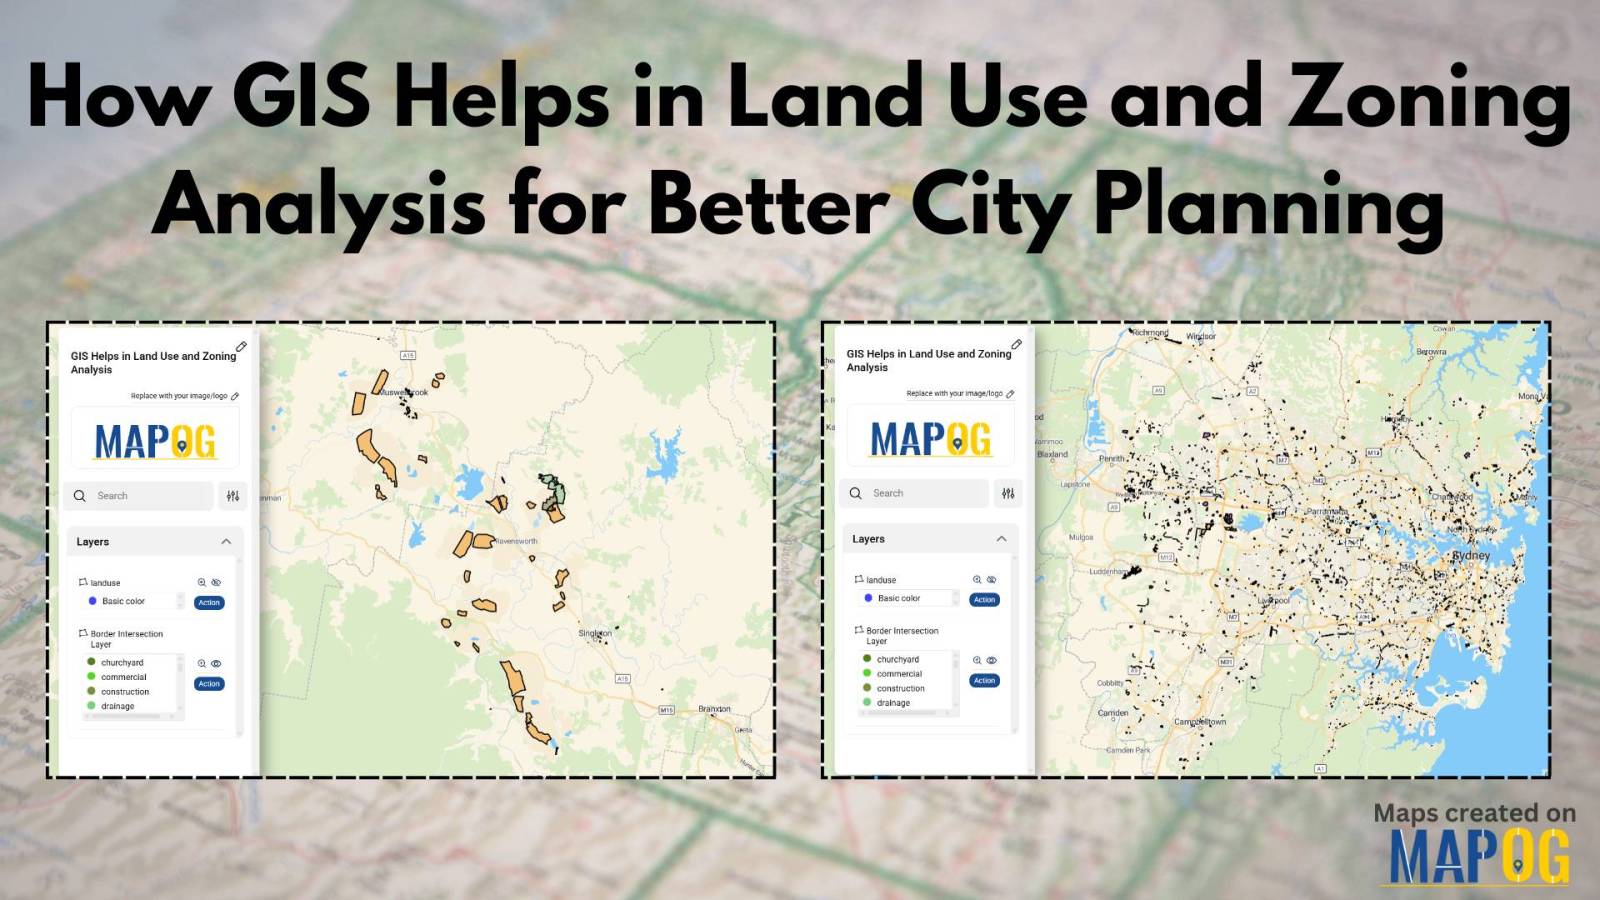
In today’s fast-changing urban landscape, GIS in land use and zoning analysis for better city planning plays a vital role in shaping smarter, more livable cities. Whether it’s managing population growth, conserving green spaces, or optimizing infrastructure, city planners increasingly depend on GIS to make informed decisions. This article explores how GIS tools enhance zoning … Read more
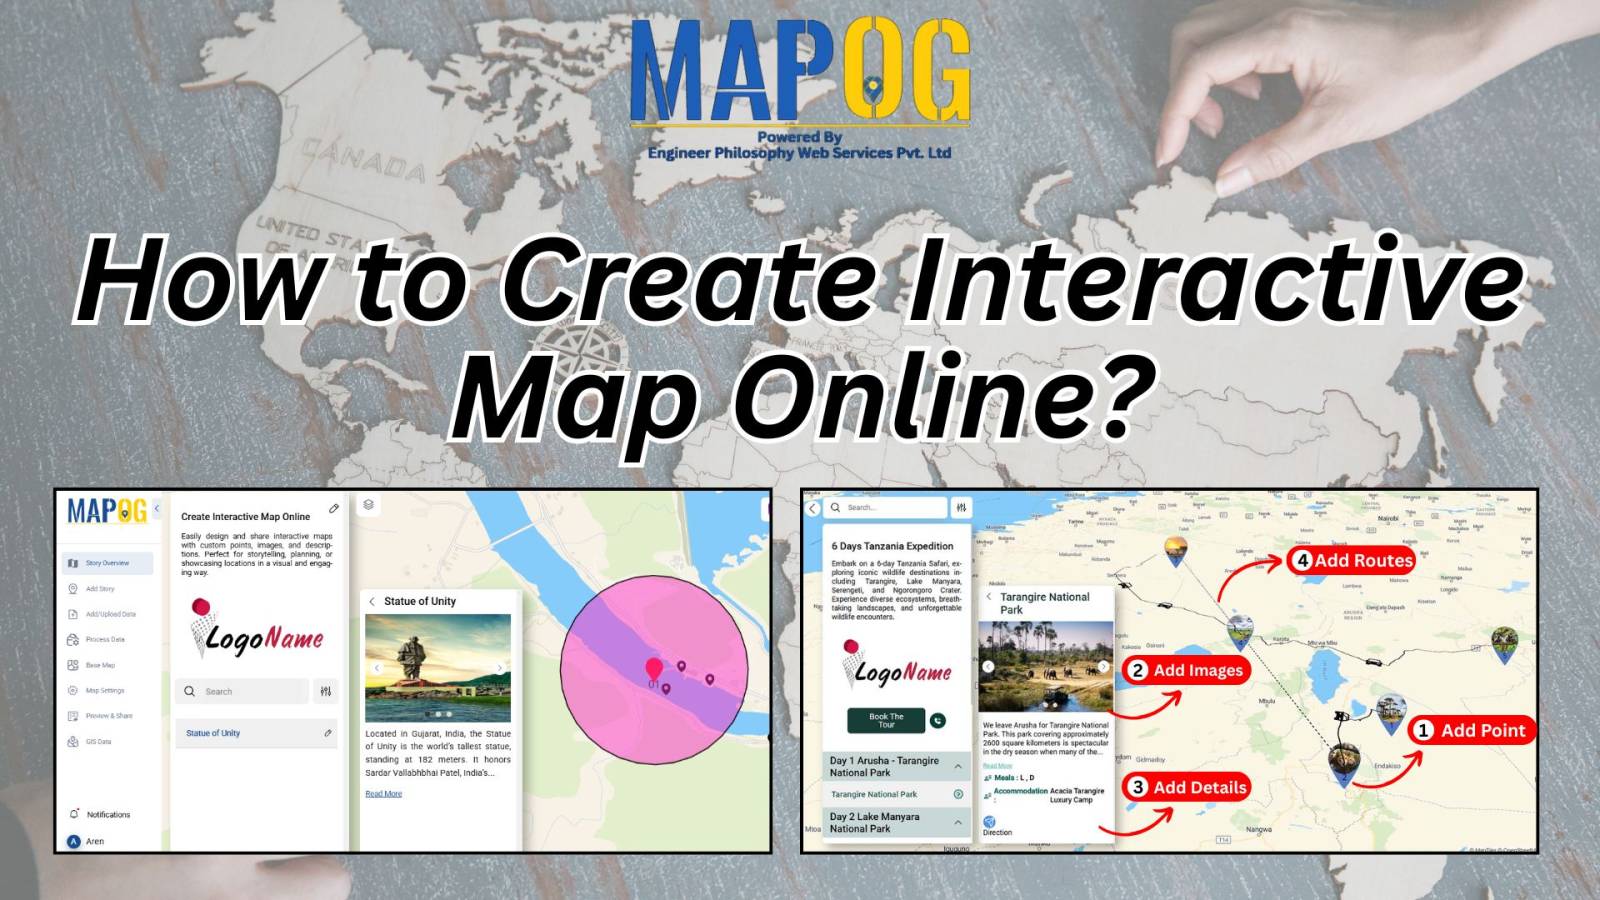
With tools like Story by MAPOG, anyone can begin their journey in online mapping or build a digital interactive map without technical skills. With tools like MAPOG, anyone—whether you’re a student, traveler, business owner, or researcher—can create beautiful, clickable maps in just a few steps. These maps help you tell stories, plan trips, share information, … Read more
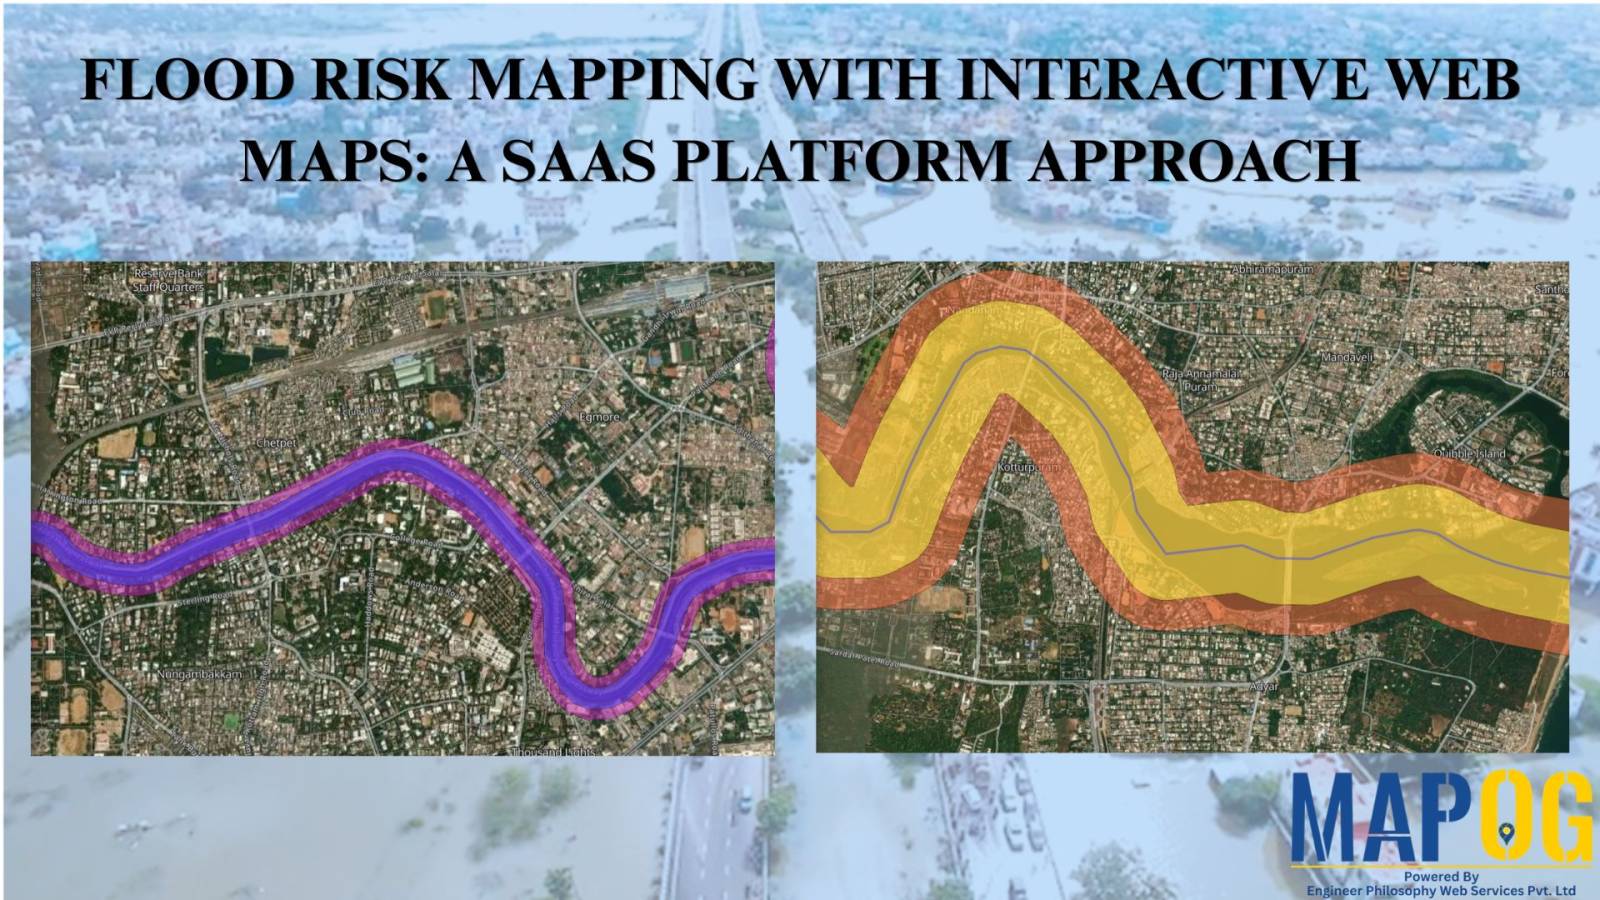
A SaaS-based flood risk mapping platform leverages interactive web maps to provide risk assessments. Using GIS, AI, and hydrological data, it enables governments, insurers, and communities to visualize flood-prone areas, enhance preparedness, and optimize response strategies. Cloud-based accessibility ensures scalability, data integration, and seamless user collaboration for proactive risk management. Key Concept How Flood Risk … Read more
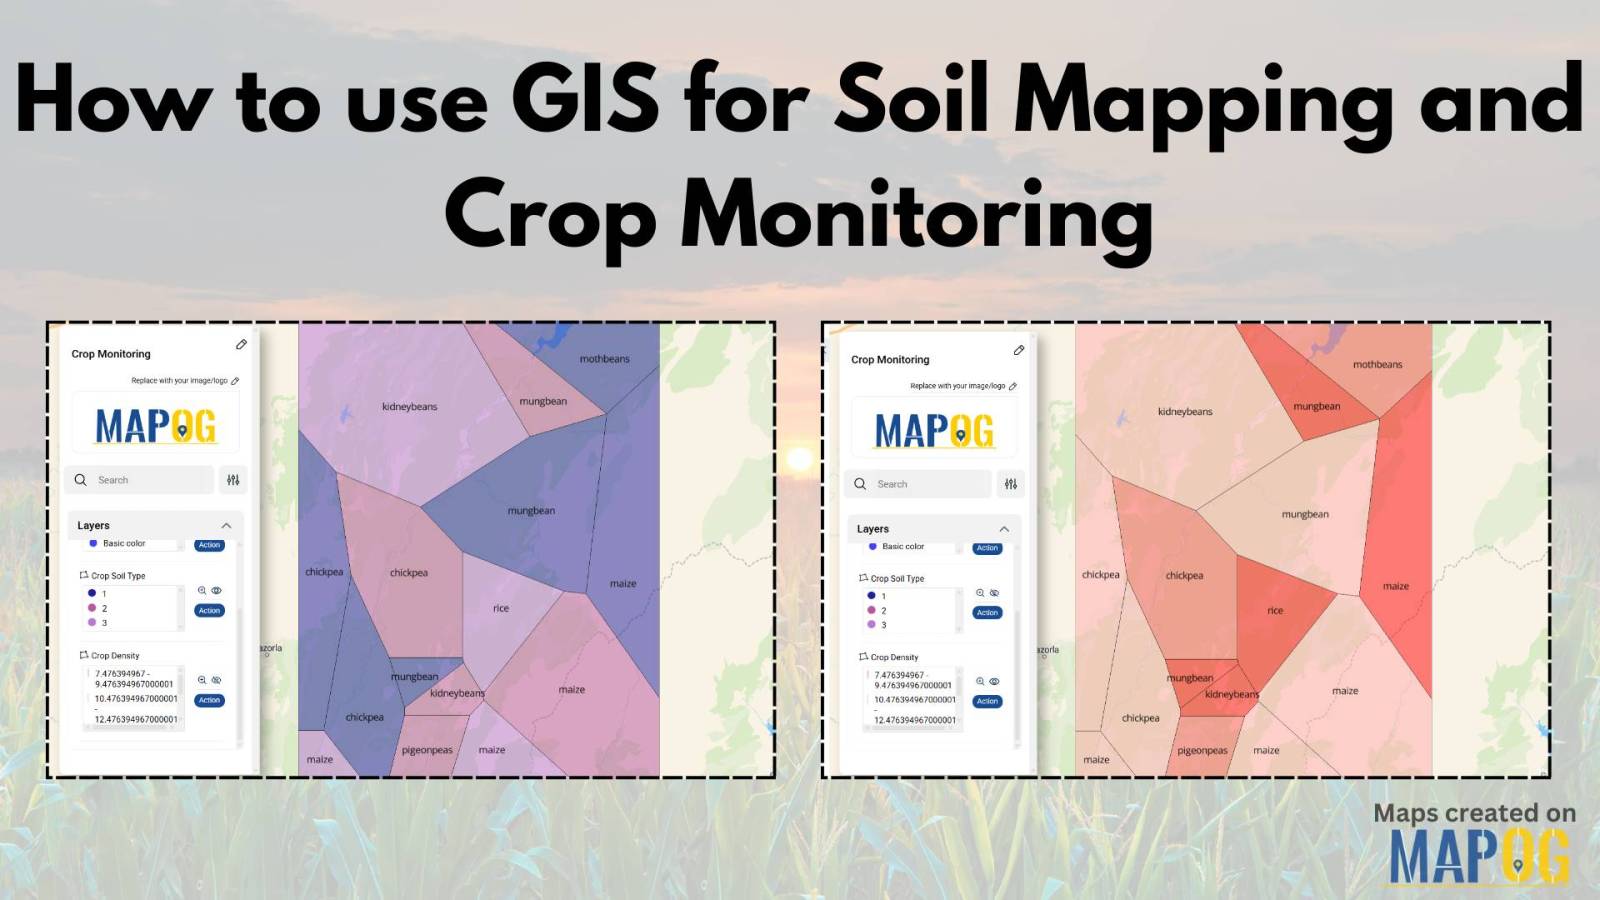
GIS is crucial in agriculture for soil mapping and crop monitoring, enabling informed decisions to improve yield, optimize land use, and ensure sustainable farming. It helps identify soil types, track crop density, and enhance precision farming by processing and visualizing soil and crop data. Key Concepts in GIS for Soil Mapping and Crop Monitoring GIS … Read more
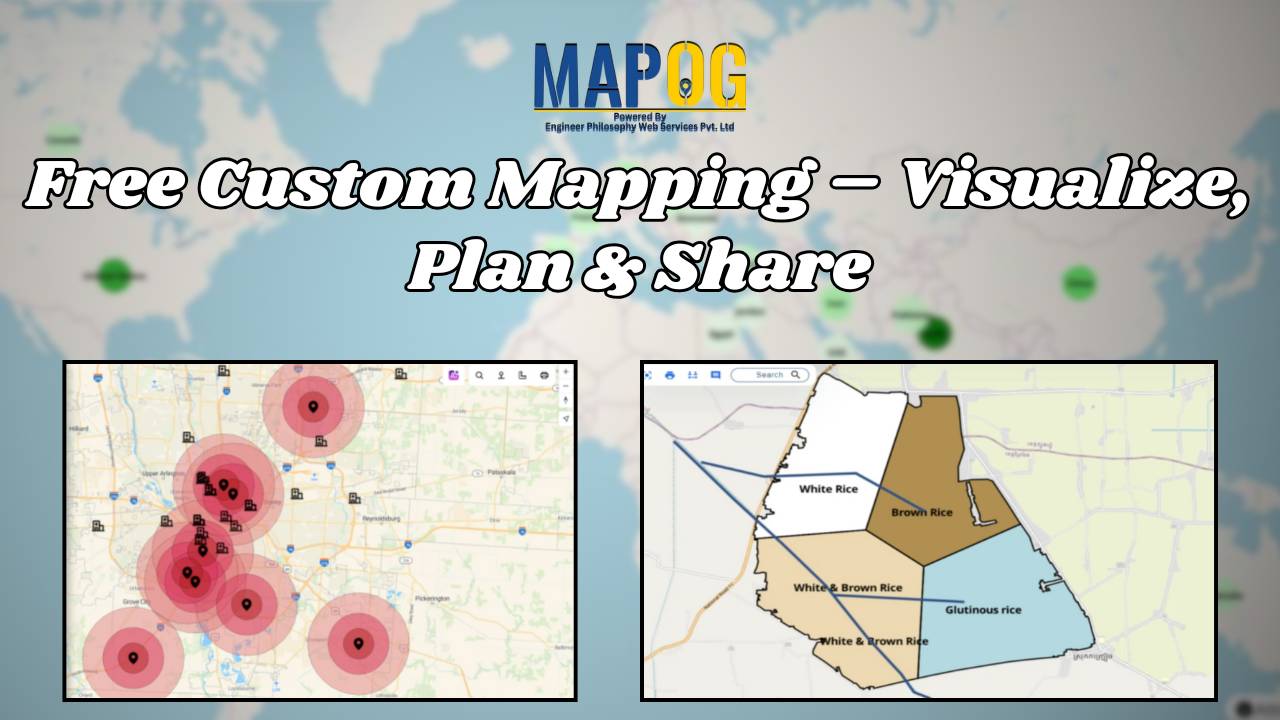
Mapping is a powerful tool that helps individuals and businesses visualize data, plan strategies, and share insights. With free custom mapping solutions like MAPOG, you can create interactive and free custom maps that bring data to life. MAPOG allows users to integrate GIS data seamlessly, customise maps, and share them effortlessly. Whether for Travel Planning, … Read more