Blog

mapping heat index

Mapping Air Quality Index: Air Pollution Monitoring

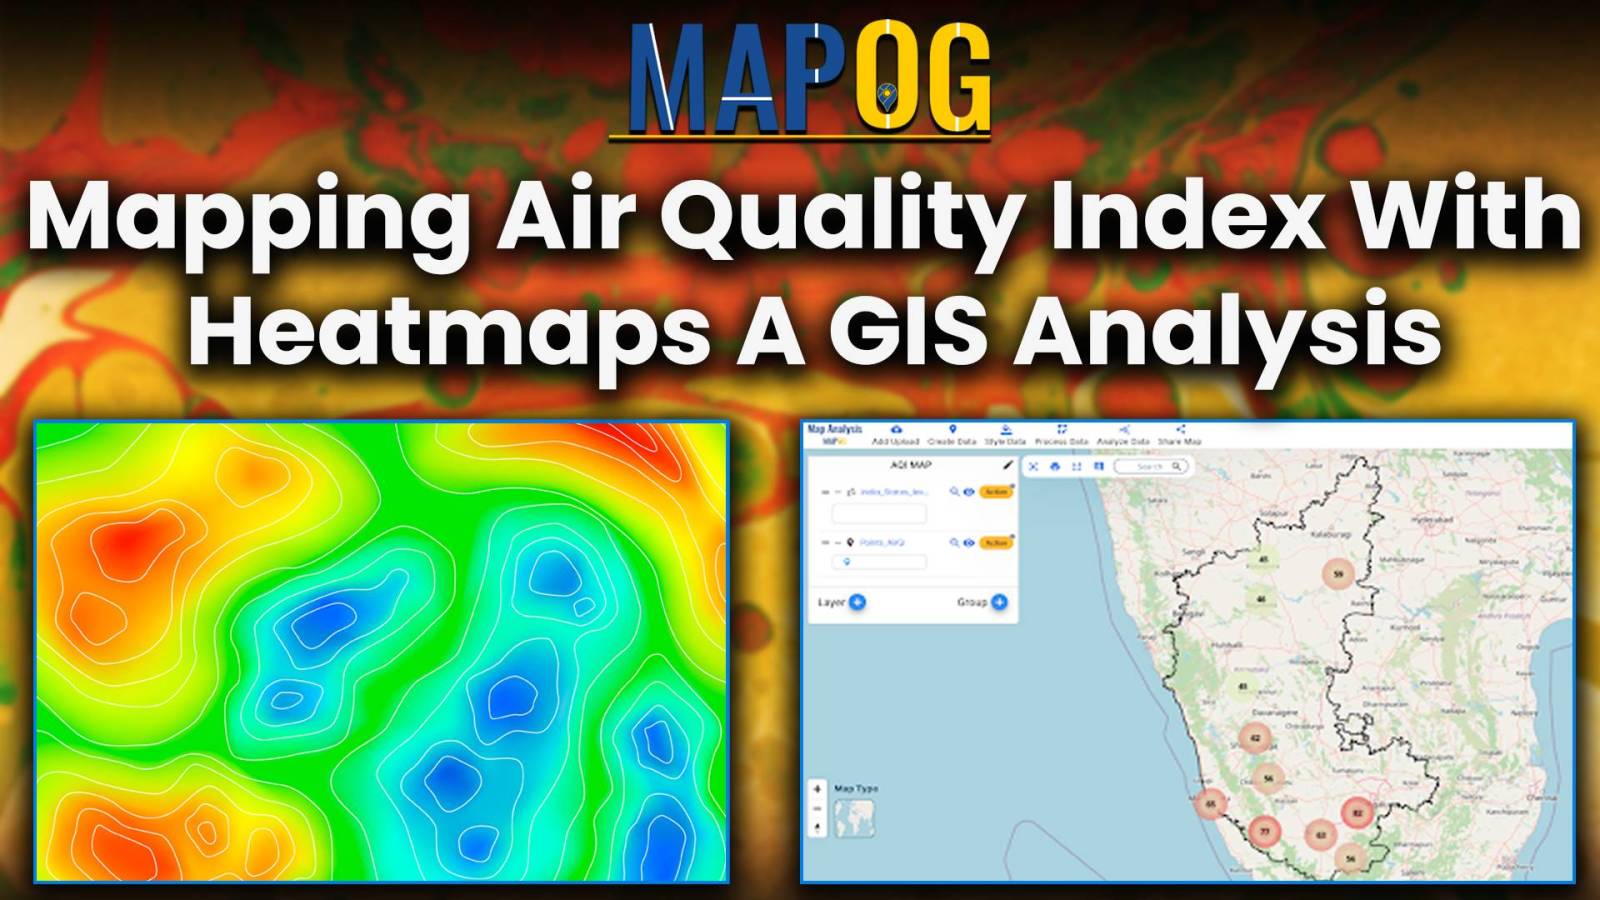
In this article, we examine the utilization of MAP OG’s MAP ANALYSIS techniques for visualizing Air Quality Index (AQI) data and Mapping Air Quality Index. Discover how GIS tools offer insights into pollution patterns, aiding informed decision-making for environmental health. Through sophisticated mapping techniques, we uncover nuanced insights into air pollution distribution. Explore how these … Read more

Fire Station Reachability Analysis: A Mapping Approach

Fire Station Reachability Analysis: A Mapping Approach

In emergency management, the strategic placement of fire stations plays a critical role in ensuring the safety and well-being of communities. Rapid response times can mean the difference between containment and devastation during a fire emergency. MAPOG offers powerful tools for evaluating potential fire station locations by analysing accessibility to road and travel time to … Read more

Create Map :Join the Excel population data to the country polygons

Create Map :Join the Excel population data to the country polygons

In the present scenario of data-driven decision-making, understanding population demographics is paramount across various domains. One tool that stands out in this regard is the Excel attribute tool of MAPOG GIS Platform. This tool enables users to seamlessly integrate Excel population data with spatial data, providing valuable insights into demographic trends. The importance of this … Read more

mapping pollution impact areas near quarries quarries

Create Map for Pollution impact analysis around Quarries

Pollution sites consistently pose threat to human welfare, primarily by directly causing numerous health issues and by contaminating vital natural resources. In many regions the presence of quarries exacerbates this threat. For monitoring pollution impact analysis around quarries, the initial step is to identify the areas affected by quarries. And then assess the extent of … Read more