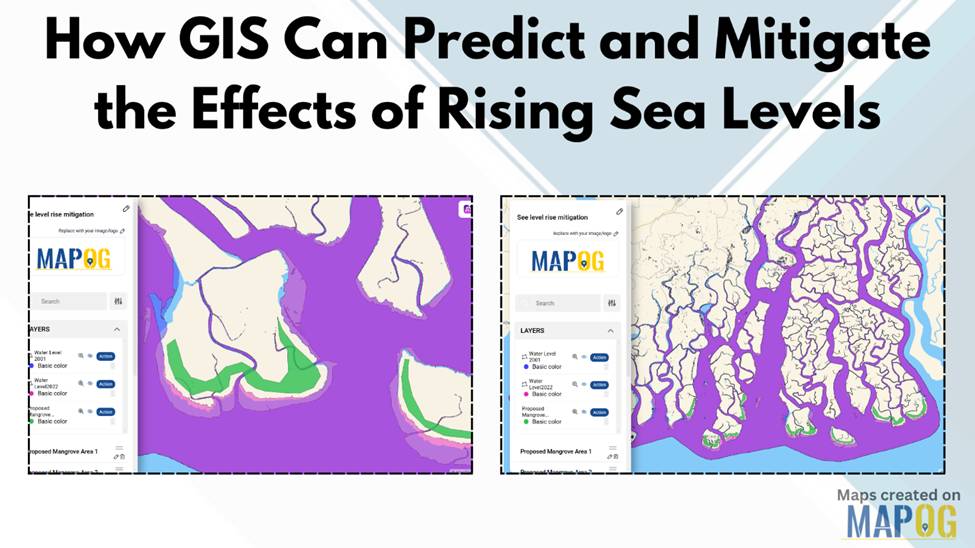
How GIS Can Predict and Mitigate the Effects of Rising Sea Levels
Rising sea levels pose a significant threat to coastal communities, ecosystems, and infrastructure. Geographic Information Systems (GIS) offer a powerful way to predict and mitigate the effects of rising sea levels by analyzing past water level data, modeling future changes, and planning mitigation strategies. By leveraging GIS technology, decision-makers can visualize vulnerable areas and implement … Read more