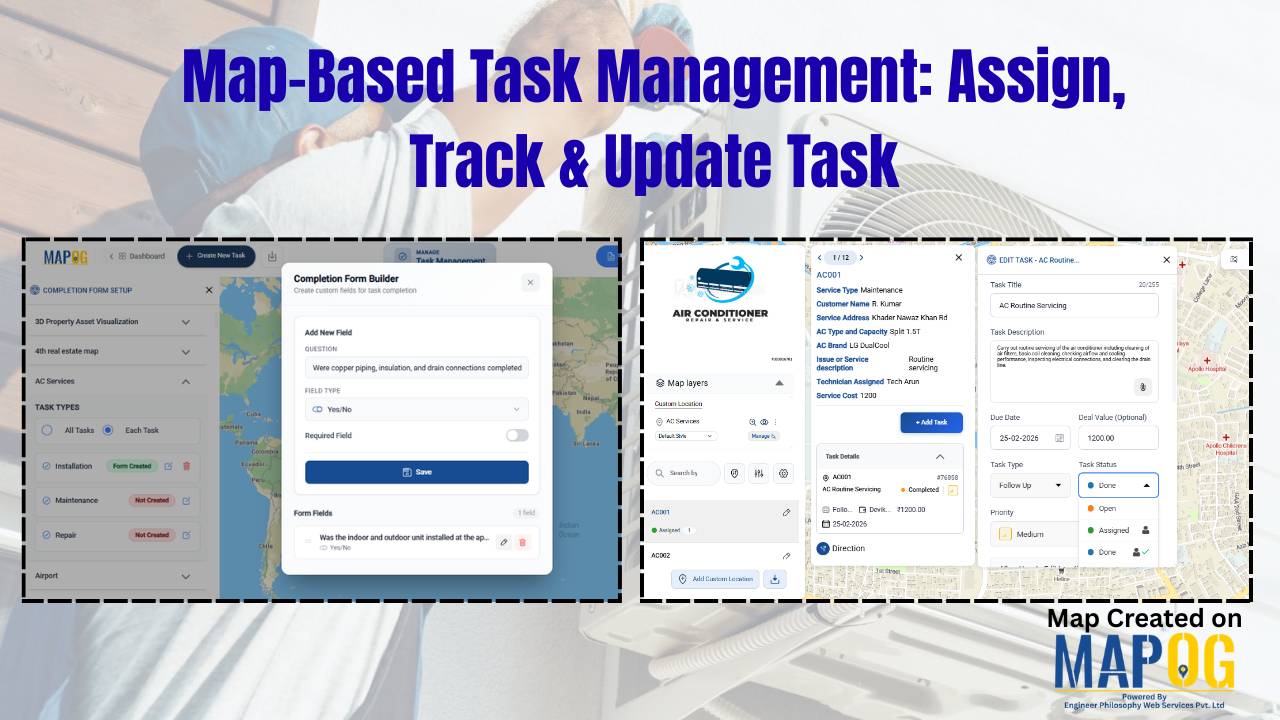
Blog

Mapping Noise Pollution Levels in Cities Using Heat Maps and Buffer Tools

Mapping Noise Pollution Levels: Using Heat Maps and Buffer Tools

Noise pollution is an increasingly critical yet often overlooked environmental challenge. In urban areas, it stems primarily from traffic, construction, railways, and industrial activities. Fortunately, with the rise of Geographic Information Systems (GIS) especially tools like heat maps and buffer zones for Mapping Noise Pollution Levels. We can now visualize these invisible pollutants. As a … Read more

Create an Online Map to Visualize and Collaborate on the 7 Wonders of the World

Learn geography & history by creating an interactive map that highlights the 7 Wonders of the World.

Discover geography and history by creating an interactive map of the 7 Wonders of the World—ideal for students, educators, and explorers. These iconic sites highlight human creativity, engineering, and cultural identity, each reflecting the unique legacy of its civilization. Using Geographic Information Systems (GIS), you can combine geography, history, and travel planning into an engaging … Read more

How to Map EV Charging Stations Using GIS: A Step-by-Step Guide

Mapping EV charging stations is a crucial step for planners aiming to develop smart, data-driven electric vehicle infrastructure. As electric mobility accelerates, GIS platforms like MAPOG enable users to visualize charging station locations clearly, identify gaps in coverage, and prioritize investments. Consequently, using modern web-based mapping tools, planners and analysts transform spreadsheets into actionable maps—showing … Read more

How to Create a Travel Itinerary on a Map and Share It Online

How to Create a Travel Itinerary on a Map and Share It Online

If you’re planning your next big adventure, there’s one thing you shouldn’t skip—how to create a travel itinerary on a map and share it online. It not only helps you stay organized but also allows your friends or travel buddies to follow along in real-time. With intuitive platforms like MAPOG, it’s now easier than ever … Read more

How GIS is Improving Traffic Management and Road Safety  

Traffic congestion and road accidents are major challenges in urban areas, leading to economic losses, increased pollution, and safety risks. As a result, Geographic Information Systems (GIS) have emerged as a powerful tool for analyzing, visualizing, and optimizing traffic flow while enhancing road safety. As a result of integrating spatial data, traffic authorities can identify … Read more

"Safari Itinerary MAP"

Safari Itinerary on Map: Explore Wildlife Destinations Visually

Planning a wildlife safari involves more than just booking a jeep and packing a camera. In fact, to make the most of your adventure—especially in biodiversity-rich parks like Kaziranga—it’s essential to prepare a detailed safari itinerary on map. By doing so, you can visualize routes, mark important safari zones, and stay organized throughout the journey. … Read more

Real-Life Crime Tracking Maps: Using GIS for Urban Safety

Real-Life Crime Tracking Maps: Using GIS for Urban Safety

Geographic Information Systems (GIS) have become an indispensable tool in enhancing urban safety by providing detailed Real-Life crime tracking maps and analysis. By combining geospatial data with law enforcement records, GIS enables cities to visualize crime hotspots, predict patterns, and address cyber security concerns. Furthermore, it supports effective planning for strategic law enforcement deployment. Through … Read more

Travel Route Planning Made Simple with Story Maps

Travel Route Planning Made Simple with Story Maps, Story maps are a creative way to integrate storytelling and geographic data, enabling users to see events, experiences, and manage plans on an interactive map combine narrative text, multimedia, and maps to produce a dynamic, captivating format that improves comprehension and sharing. Users can view events, experiences, … Read more

Population Density Map by Districts

How To Create Population Density Map by Districts

Visualizing population density map by districts helps uncover patterns in urban growth, resource distribution, and planning needs. Whether you’re working on development plans, healthcare access, or disaster preparedness, mapping this data by district brings clarity that raw tables cannot. Thanks to MAPOG, users can create, style, and share interactive maps easily—no advanced GIS degree needed. … Read more