GISdata

Flood Risk Mapping with Interactive Web Maps: A SaaS Platform Approach

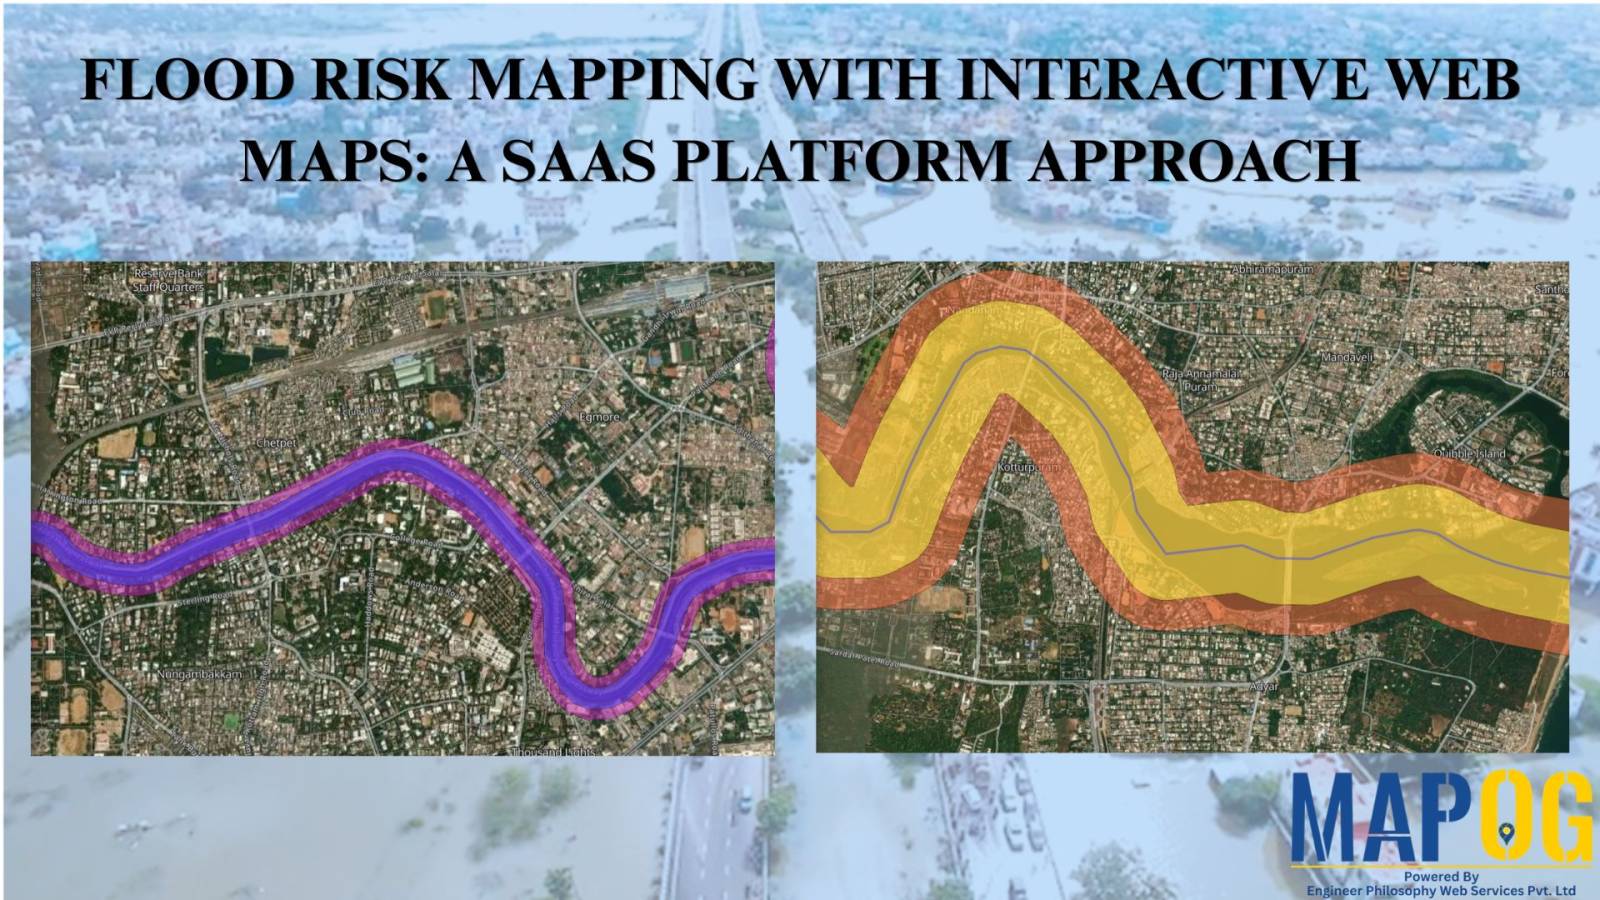
Flood Risk Mapping with Interactive Web Maps: SaaS Approach

A SaaS-based flood risk mapping platform leverages interactive web maps to provide risk assessments. Using GIS, AI, and hydrological data, it enables governments, insurers, and communities to visualize flood-prone areas, enhance preparedness, and optimize response strategies. Cloud-based accessibility ensures scalability, data integration, and seamless user collaboration for proactive risk management. Key Concept How Flood Risk … Read more

How to use GIS for Soil Mapping and Crop Monitoring

GIS is crucial in agriculture for soil mapping and crop monitoring, enabling informed decisions to improve yield, optimize land use, and ensure sustainable farming. It helps identify soil types, track crop density, and enhance precision farming by processing and visualizing soil and crop data. Key Concepts in GIS for Soil Mapping and Crop Monitoring GIS … Read more

Free Custom Mapping – Visualize, Plan & Share

Free Custom Mapping – Visualise, Plan & Share

Mapping is a powerful tool that helps individuals and businesses visualize data, plan strategies, and share insights. With free custom mapping solutions like MAPOG, you can create interactive and free custom maps that bring data to life. MAPOG allows users to integrate GIS data seamlessly, customise maps, and share them effortlessly. Whether for Travel Planning, … Read more

HOW GIS CAN HELP IN REDUCING URBAN HEAT ISLANDS WITH SMART MAPPING

How GIS and Smart Mapping Reduce Urban Heat Islands

GIS for Heat Island Reduction enables smart mapping to analyze temperature variations identify heat-prone areas, and optimize green spaces. It supports strategic tree planting, reflective surfaces, and heat-resistant materials. GIS-driven data aids urban planners in designing cooler, sustainable cities with improved land use, reducing heat retention and energy consumption. Key Concept: GIS for heat island … Read more

What Are Heatmaps and How to Create Heatmaps?

What Are Heatmaps and How to Create Heatmaps?

Ever wondered how to visualize data patterns effectively? Heatmaps are an excellent way to analyze trends, highlight intensities, and make data-driven decisions. Whether for website analytics, business insights, or geographic trends, heatmaps simplify complex datasets into easy-to-understand visuals. The best part? You can create heatmaps for free using tools like MAPOG’s Heat Map Style. Let’s … Read more

The Role of GIS in Cyber Security and Geospatial Intelligence

The Role of GIS in Cyber Security and Geospatial Intelligence 

In today’s data-driven world, maps are no longer just tools for navigation, they are powerful instruments for analysing patterns, making informed decisions, and solving complex problems. Whether Tracking Population and Literacy Data Attribute , Thematic Mapping for Data Analysis or a researcher visualising data, MAPOG is your go-to platform for creating professional, insightful maps. In … Read more

How to Create Grid Maps for Analysis?

Grid maps are essential for analysing spatial data, helping to break down complex information into smaller, manageable sections. Whether you’re working in urban planning, environmental studies, or business analytics, a well-structured grid map enhances data visualisation and decision-making. In this guide, we’ll explore how to create grid maps effectively and introduce MAPOG’s Create Grid Tool, … Read more

Facilitating warehouse location selection

Optimizing Warehouse Location Selection with GIS for Supply Chain Efficiency

GIS optimizes supply chains and logistics by enabling precise route planning, fleet tracking, warehouse Site Selection, Demand Forecasting, and Risk Assessment. It enhances inventory management, facilitating warehouse location selection, reduces transportation costs, improves delivery efficiency, and supports data-driven decision-making, ensuring streamlined operations, better resource utilisation, and improved customer satisfaction across supply networks. Key Concept in … Read more

Role of GIS In Irrigation Planning and Water Resource Management

Role of GIS In Irrigation Planning and Water Resource Management

GIS plays a vital role in irrigation planning and water resource management by optimising site selection, assessing water demand, designing irrigation networks, and analysing crop suitability. Additionally, it enhances decision-making through spatial analysis, monitors water distribution, prevents water logging, and integrates data for sustainable and efficient water resource utilisation. Key Concept in Monitoring GIS in … Read more

GIS In Air Quality Monitoring and Pollution Control

GIS plays a crucial role in air quality monitoring and pollution control. It maps sources, tracks emissions, and Identifies Hotspots for better decision-making. GIS supports in Air Quality mapping, Urban Planning, Evaluates Control Measures, and helps reduce key pollutants like PM, NOx, SO2, CO, O3, and VOCs through technology and regulations, promoting sustainability. Key Concept … Read more