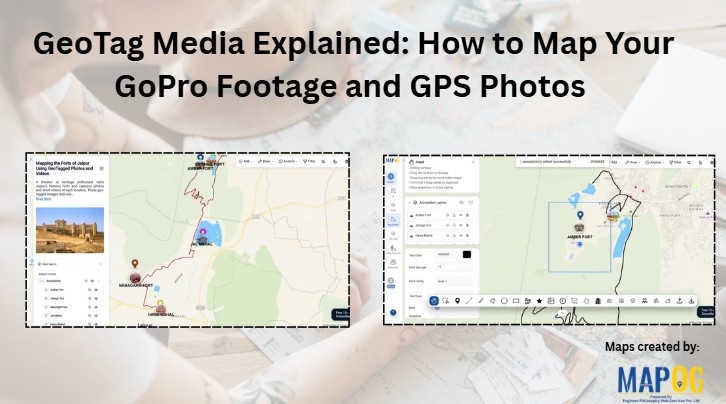
GeoTag Media Explained: How to Map Your GoPro Footage and GPS Photos
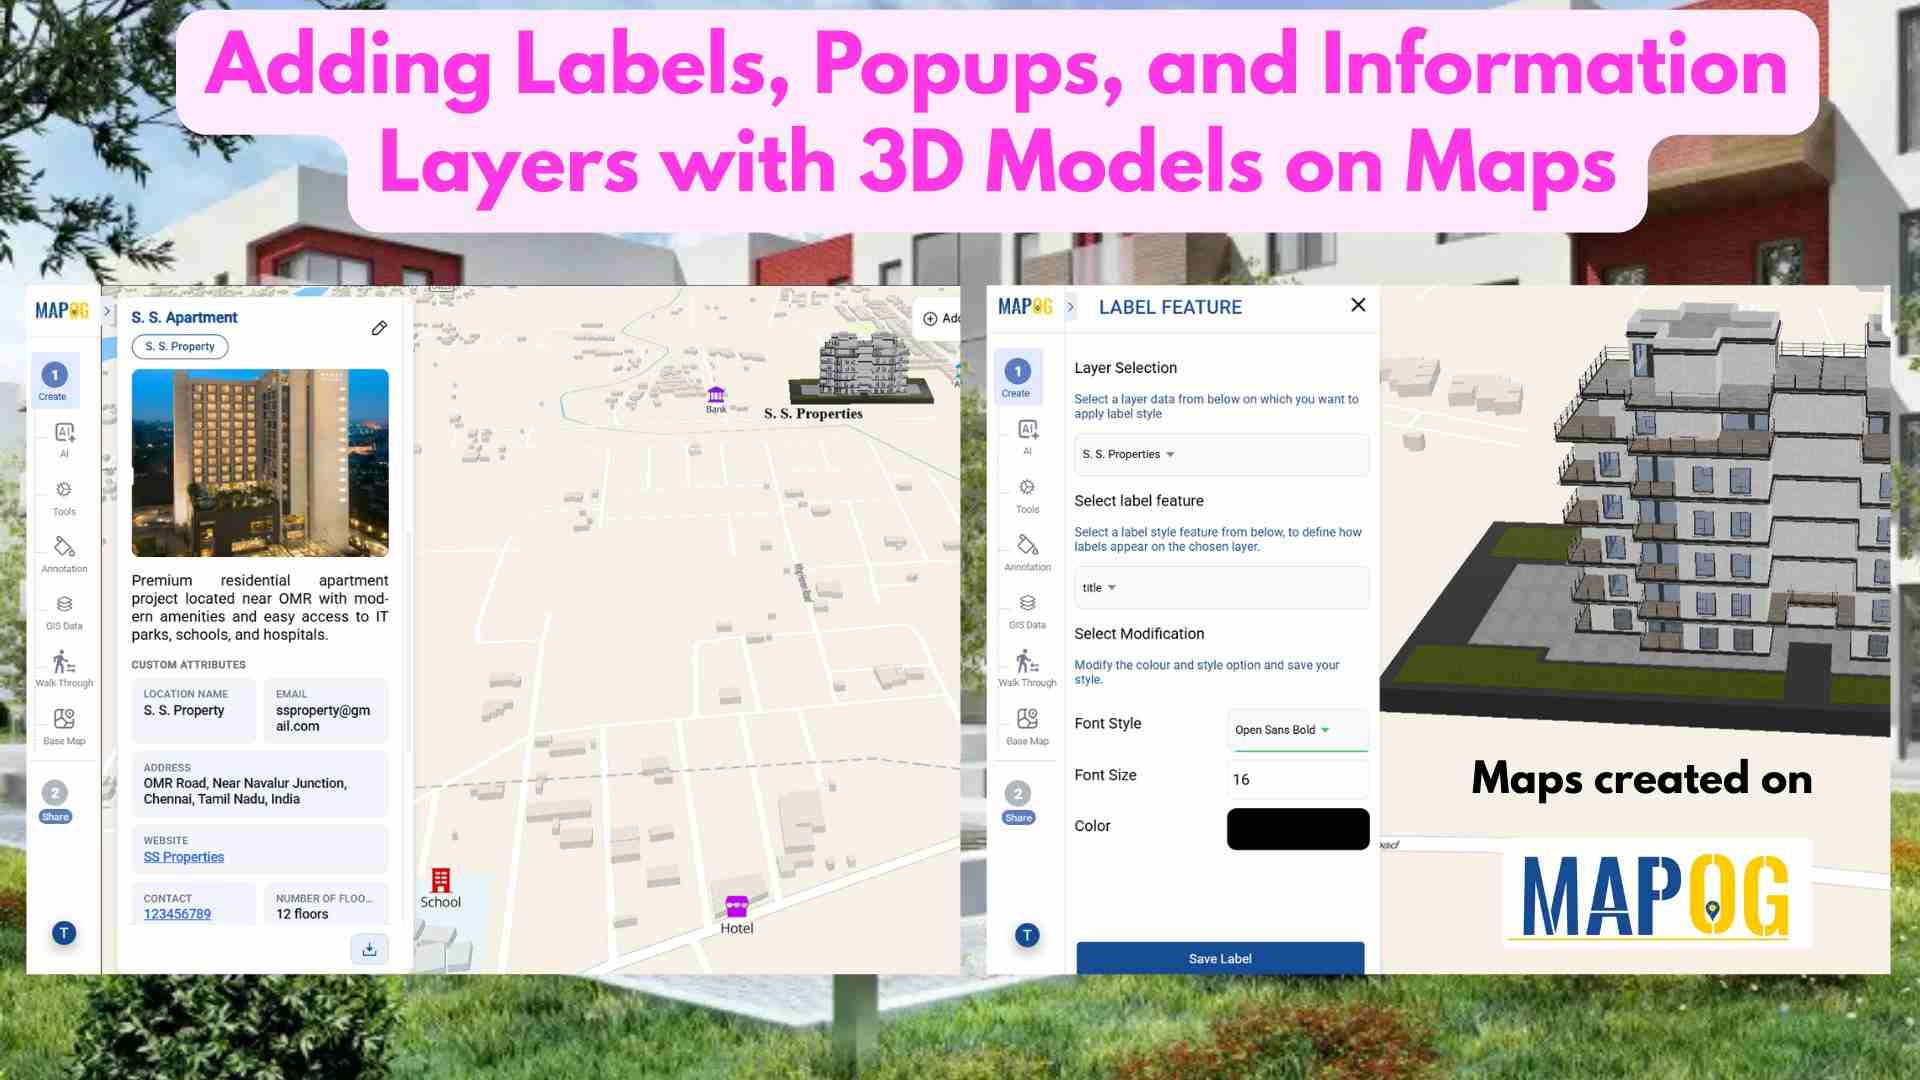
Location-based media adds a new layer of context to maps. Instead of simply marking places, you can attach real photos and videos to show what exists at each location. With MAPOG, users can upload Geotag Media and GoPro footage, allowing media files to appear automatically at their recorded locations. Consequently, maps become more interactive, informative, … Read more