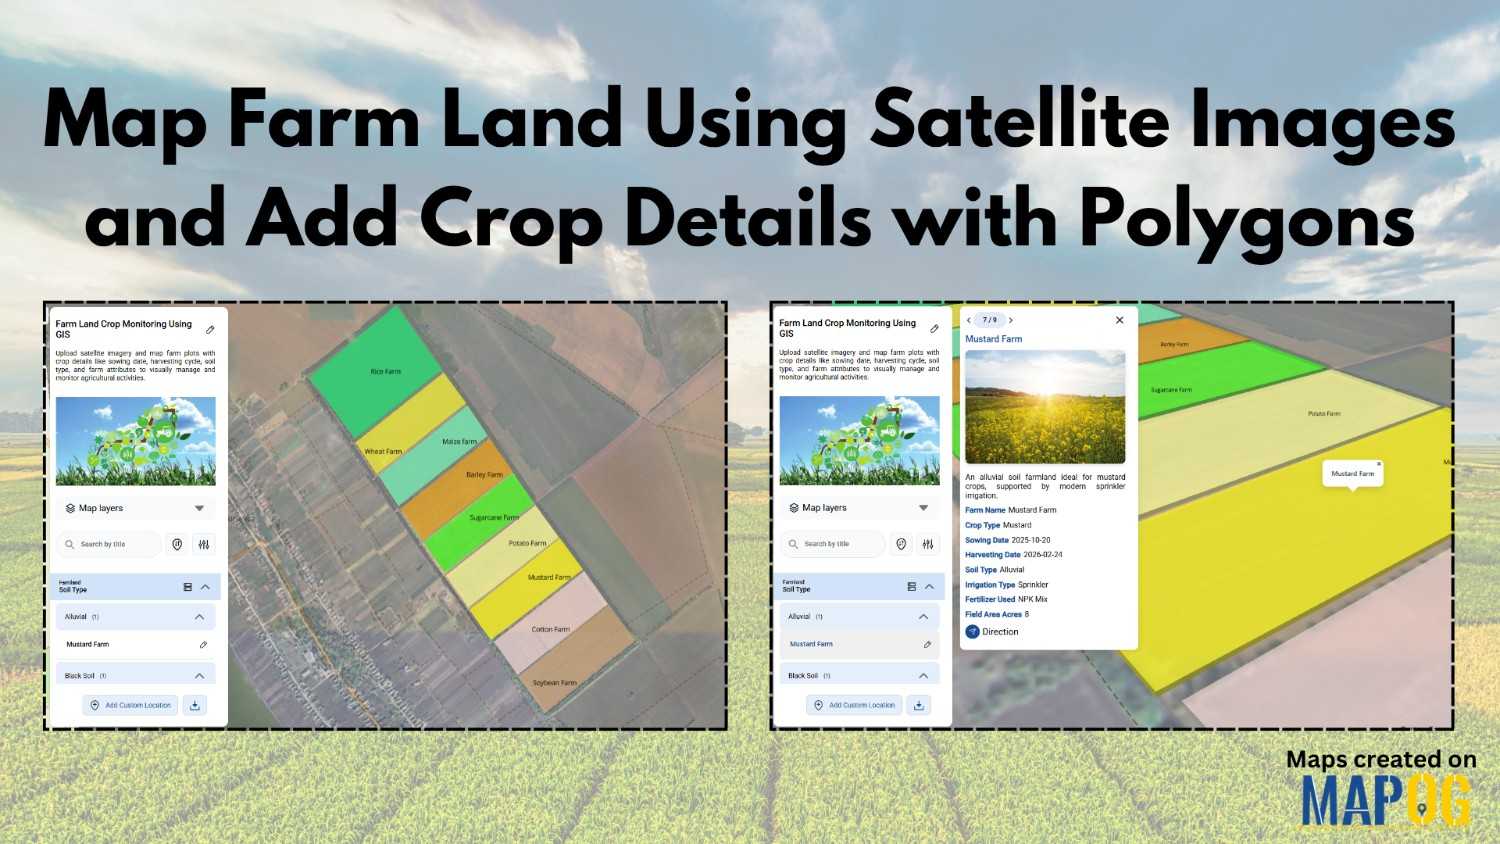
Data Visualisation in Map

how to collect correct customer details without manual mistakes

How to Collect Correct Customer Details Without Manual Mistakes

Accurate customer details are the backbone of reliable surveys, market analysis, and business decision-making. However, traditional paper-based methods and manual data entry often lead to errors such as missing information, incorrect locations, and delays in processing. As a result, it has become challenging to collect correct customer details becomes challenging when data is handled manually, … Read more

Add New Customer Locations

How to Add New Customer Locations Quickly While Visiting Them

In field surveys, speed and accuracy are everything. Whether collecting customer data, mapping market outlets or conducting household surveys, field teams often struggle with manually recording locations or entering customer details long after the visit. MAPOG solves these challenges by allowing surveyors to capture and register new customer locations instantly, right at the point of … Read more

Filter Map Points

Filter Map Points by Attribute Values (From Excel/CSV)

When working with large datasets on a map, it can be difficult to focus on only the information you need. By filtering map points using attribute values stored in an Excel or CSV file, you can quickly highlight specific categories, ranges, or conditions—such as cities above a certain population, demographics, or locations with active status. … Read more

Interface showing how to convert place names into coordinates without technical skills using CSV upload and geocoding tools.

Convert Place Names Into Coordinates Without Any Technical Skills

Collecting place names is straightforward, but converting them into coordinates becomes a roadblock for anyone who isn’t trained in GIS. Most people don’t know how to clean inconsistent place‑name lists, set up geocoding tools, deal with API keys, or interpret multiple location matches. As a result, without those technical steps, a simple list of villages, … Read more

Interactive map created on MAPOG showing how to add multimedia to your maps, with embedded videos, images, and links displayed in popups.

Add Multimedia to Your Maps: Videos, Images & Links in One View

Many mapped datasets feel incomplete because sometimes locations aren’t enough, context is needed too. Important details like site visuals, progress updates, or reference links often stay disconnected from the map itself. That’s why it’s essential to add multimedia to your maps. By including videos, images, and external links, you can turn each point into a … Read more

Create Story Maps Faster Using Reusable Custom Locations Library

Create Story Maps Faster Using Reusable Custom Locations Library

To begin with, using a reusable custom locations library is a simple yet powerful way to speed up story map creation. Moreover, this approach helps planners, teams, and organizations reuse existing location datasets instead of rebuilding maps each time. As a result, you can instantly drop in pre-saved places such as stores, offices, hotspots, or … Read more

Interface showing customer data points segmented and filtered instantly using dynamic filters, with color-coded clusters for real-time insights

Segment and Filter Customers Instantly with Interactive Filters

Most teams already have customer data, but the way it’s managed often hides the details that matter. Consequently, diverse attributes collapse into uniform rows, obscuring meaningful distinctions. As a result, strategies become generic, and critical signals stay hidden. However, static reports flatten complexity, leaving no room for precision. With MAPOG, teams can segment and filter … Read more

Export Your Map with All Data and Details Intact (GeoJSON, SHP, CSV)

Export Your Map with All Data and Details Intact (GeoJSON, SHP, CSV)

In mapping and spatial data, live interactive maps are incredibly powerful; however, there are times when offline access becomes essential. That’s why MAPOG lets you export your map seamlessly, ensuring all data and details remain intact. As a result, you can analyse, present, or share your information with your team without losing any important elements. … Read more

Cover image showing color-coded customer locations on a digital map and a field data table used to Add Notes and Important Information to Customer records in real time on MAPOG.

How to Add Notes and Important Information to Customer Locations from the Field

When field teams visit customer sites, capturing observations and service details at each location transforms visits into documentation. Ability to add notes and important information to customer locations from the field keeps data accurate, operations transparent, and teams aligned without delays of manual reporting. However MAPOG make this seamless, enabling field workers to update records, … Read more

Cover image

How to Combine All Customer Data from the Field Into One Clean Map

To combine all the customer data from the field is a common challenge for organizations. Teams collect location details, service feedback, and on-site observations through a mix of mobile apps, paper forms, and spreadsheets, but this mix of formats often leaves the data scattered and hard to interpret.  A unified map solves this problem by … Read more