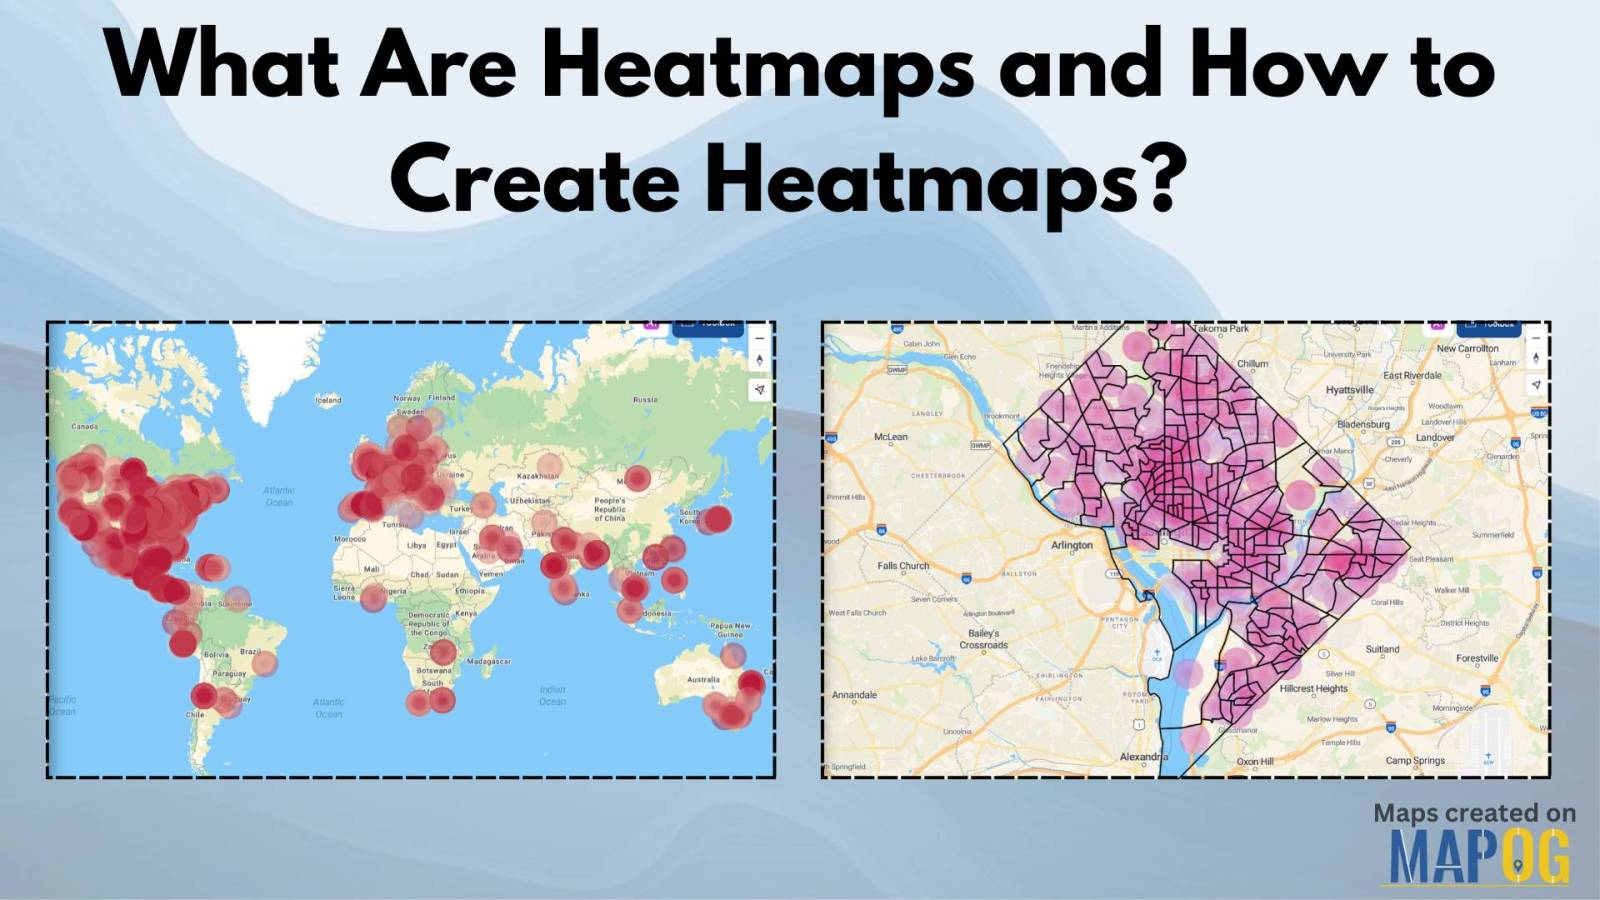
What Are Heatmaps and How to Create Heatmaps?
Ever wondered how to visualize data patterns effectively? Heatmaps are an excellent way to analyze trends, highlight intensities, and make data-driven decisions. Whether for website analytics, business insights, or geographic trends, heatmaps simplify complex datasets into easy-to-understand visuals. The best part? You can create heatmaps for free using tools like MAPOG’s Heat Map Style. Let’s … Read more