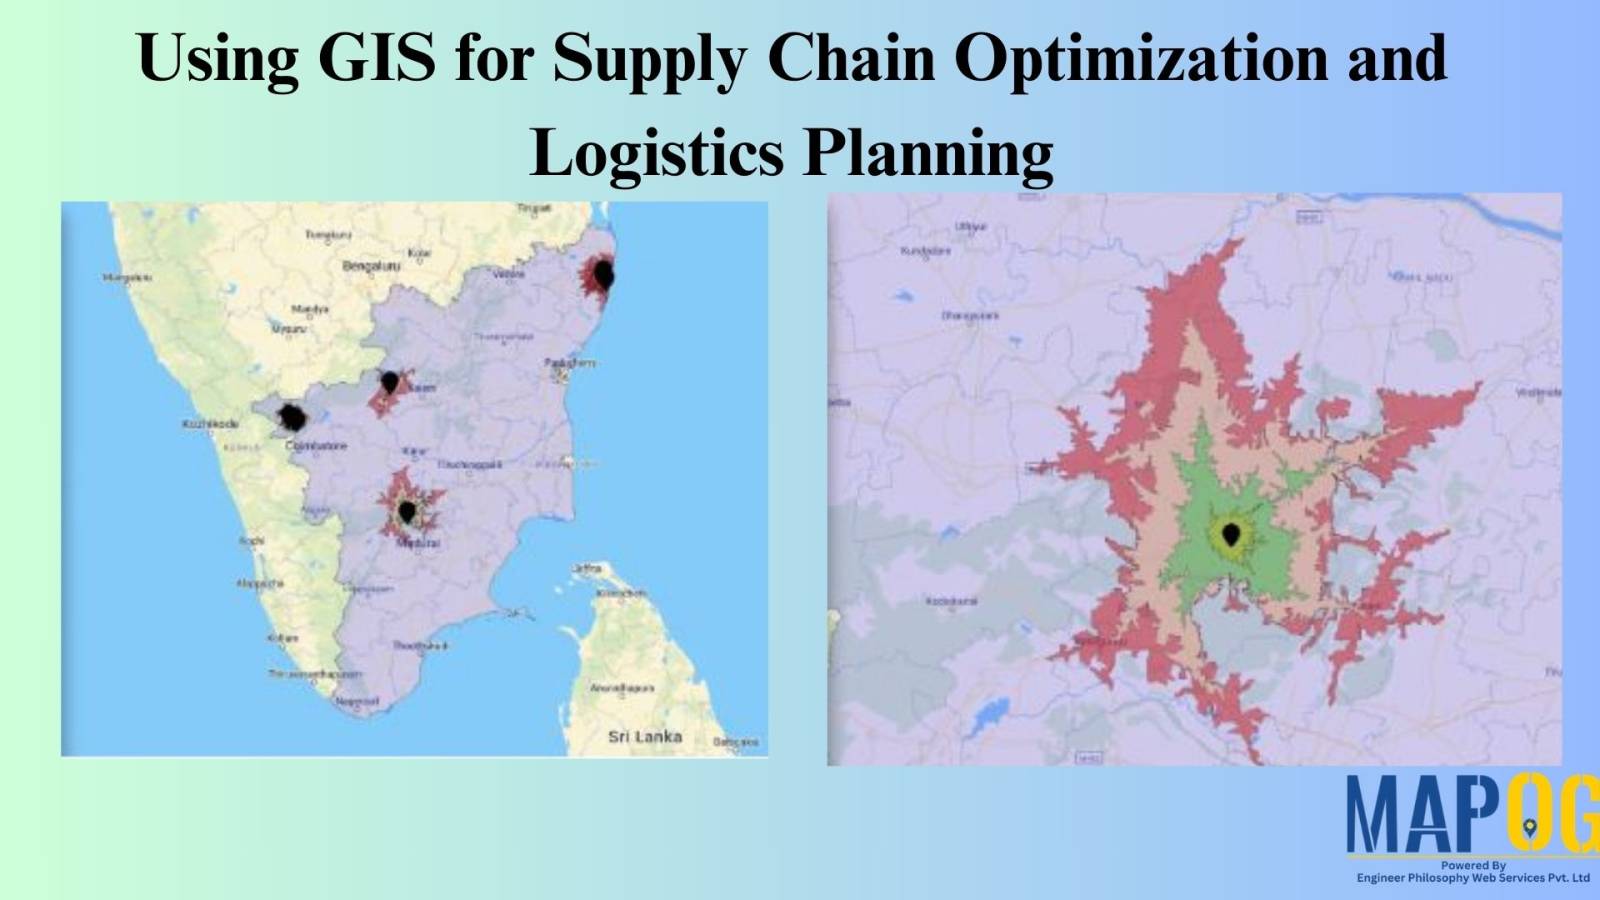
MAPOG Analysis

Isochrone Analysis in GIS: Optimize Travel Times for Faster Delivery & Urban Planning

In the fast-paced world of urban logistics, the ability to understand and optimize travel times is essential for businesses like food and grocery delivery services. One powerful tool in their arsenal is isochrone analysis. Isochrone Analysis: Mapping Travel Times, Let’s explore what isochrones are, how they work, and the significant impact they have on streamlining … Read more

How to Geocode Excel Data and Create an Interactive Map (Step-by-Step Guide)

Have a spreadsheet full of addresses or coordinates and wondering how to plot them on a map? Geocoding Excel data into an interactive map can transform raw location information into valuable insights. Whether for business analysis, logistics, or research, mapping your Excel data helps visualize trends and make data-driven decisions. This guide will walk you … Read more

Best GIS Tools for Healthcare Analysis: Enhancing Accessibility & Resource Allocation

Healthcare is an industry in which the basis for many decisions could be driven by data. For instance, healthcare services can be effectively analyzed with spatial insight into resource allocation and disease distribution, which, in turn, determines the accessibility of care. Therefore, this article presents some of the best GIS tools available for healthcare professionals … Read more

Forest Boundary Analysis: Precision Polygon Splitting for Sustainable Planning

Unveil the power of precision in GIS with MAPOG’s Split Polygon by Line tool. Explore how this innovative feature revolutionizes polygon splitting, facilitating nuanced analysis and insightful mapping with ease and accuracy. KEY CONCEPTS Our goal is to split the Polygons using the split-by-line tool from MAPOG Map Analysis. Learn more about the analyses using … Read more

Thematic Mapping for Data Analysis: Visualizing Trends with Bubble Maps

Thematic Mapping for Data Analysis is a powerful technique used to visualize complex datasets by representing geographic patterns through color-coded maps and scalable symbols. One of the most effective methods in thematic mapping is Bubble Thematic Mapping, where data points are displayed as bubbles of varying sizes, proportional to a specific attribute such as population … Read more

Land Parcel Mapping with GIS: Create Accurate Polygon Maps for Urban Planning & Real Estate

In Geographic Information Systems (GIS), a polygon is a fundamental geometric shape used to represent closed areas on maps. Polygons in GIS are comprised of connected straight-line segments, delineating the boundaries of geographic features, including land parcels, lakes, and administrative regions. These two-dimensional shapes facilitate spatial analysis, mapping, and visualization of geographical data, playing a … Read more

Wildlife Corridor Planning: Using GIS Cross Intersection Analysis for Safe Migration

By identifying crucial junctions with human infrastructure, “Wildlife Corridor Planning using Cross Intersection in MAPOG” guarantees safe animal migration and habitat connectivity. This strategy protects biodiversity while reducing conflict. Key Concepts MAPOG’s Cross Intersection tool enables conservationists and planners to pinpoint critical intersections where wildlife corridors intersect infrastructure, enabling targeted mitigation strategies. Download MAPOG App … Read more

How to Use GIS Grid Tools for Mapping Healthcare Services and Improving Access

In the quest to enhance health care service delivery, GIS provides a robust platform for mapping and analyzing health care services across different regions. Utilizing grid-based mapping techniques in GIS allows for a detailed. The equal-area analysis of service distribution with highlighting areas. Mapping Health Care Services: Utilizing Grid Tools in GIS, This article outlines … Read more