MAPOG Analysis

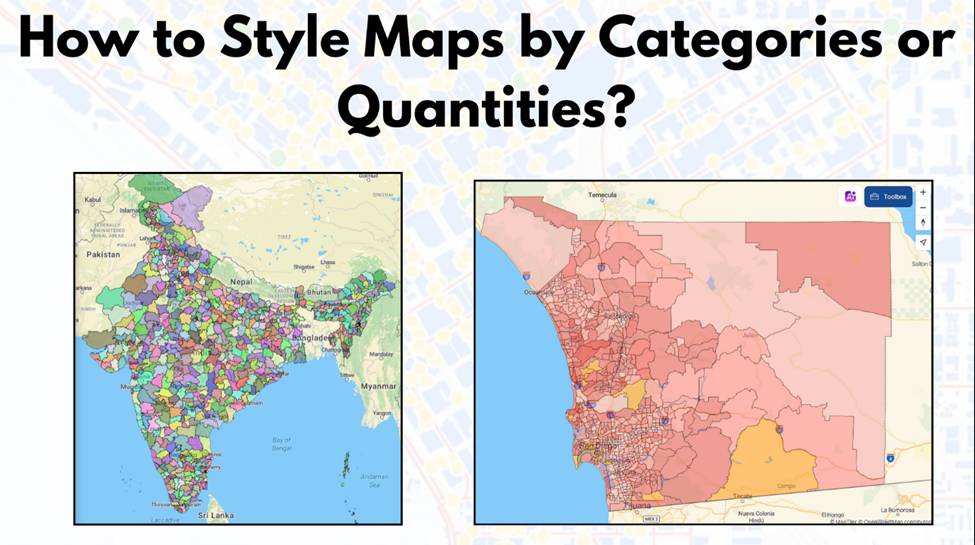
How to Style Maps by Categories or Quantities in MAPOG?

Interactive maps are powerful tools for visualizing data in a way that’s easy to understand and engaging. Style Maps by Categories or Quantities in MAPOG allows you to highlight trends, differences, and relationships effectively. Whether you’re mapping demographic data, business insights, or geographical patterns, the ability to customize styles is crucial for making your data … Read more

How to use GIS for Mapping Disease Affected Area

 Geographic Information System is an emerging field that combines spatial analysis, statistical modeling and data visualization. We can create maps by pinpointing the location of disease outbreak by using a “point to polygon tool” and help us lineate the affected area smoothly and effortlessly. Key concept  Analysis of disease affected areas by using point to … Read more

Isochrone Analysis in GIS: Optimize Travel Times for Faster Delivery & Urban Planning

In the fast-paced world of urban logistics, the ability to understand and optimize travel times is essential for businesses like food and grocery delivery services. One powerful tool in their arsenal is isochrone analysis. Isochrone Analysis: Mapping Travel Times, Let’s explore what isochrones are, how they work, and the significant impact they have on streamlining … Read more

How to Geocode Excel Data and Create an Interactive Map (Step-by-Step Guide)

Have a spreadsheet full of addresses or coordinates and wondering how to plot them on a map? Geocoding Excel data into an interactive map can transform raw location information into valuable insights. Whether for business analysis, logistics, or research, mapping your Excel data helps visualize trends and make data-driven decisions. This guide will walk you … Read more

Best GIS Tools for Healthcare Analysis: Enhancing Accessibility & Resource Allocation

Healthcare is an industry in which the basis for many decisions could be driven by data. For instance, healthcare services can be effectively analyzed with spatial insight into resource allocation and disease distribution, which, in turn, determines the accessibility of care. Therefore, this article presents some of the best GIS tools available for healthcare professionals … Read more

Forest Boundary Analysis: Precision Polygon Splitting for Sustainable Planning

Unveil the power of precision in GIS with MAPOG’s Split Polygon by Line tool. Explore how this innovative feature revolutionizes polygon splitting, facilitating nuanced analysis and insightful mapping with ease and accuracy. KEY CONCEPTS Our goal is to split the Polygons using the split-by-line tool from MAPOG Map Analysis. Learn more about the analyses using … Read more