Use case - Thematic Map

GIS in land use and zoning analysis for better city planning

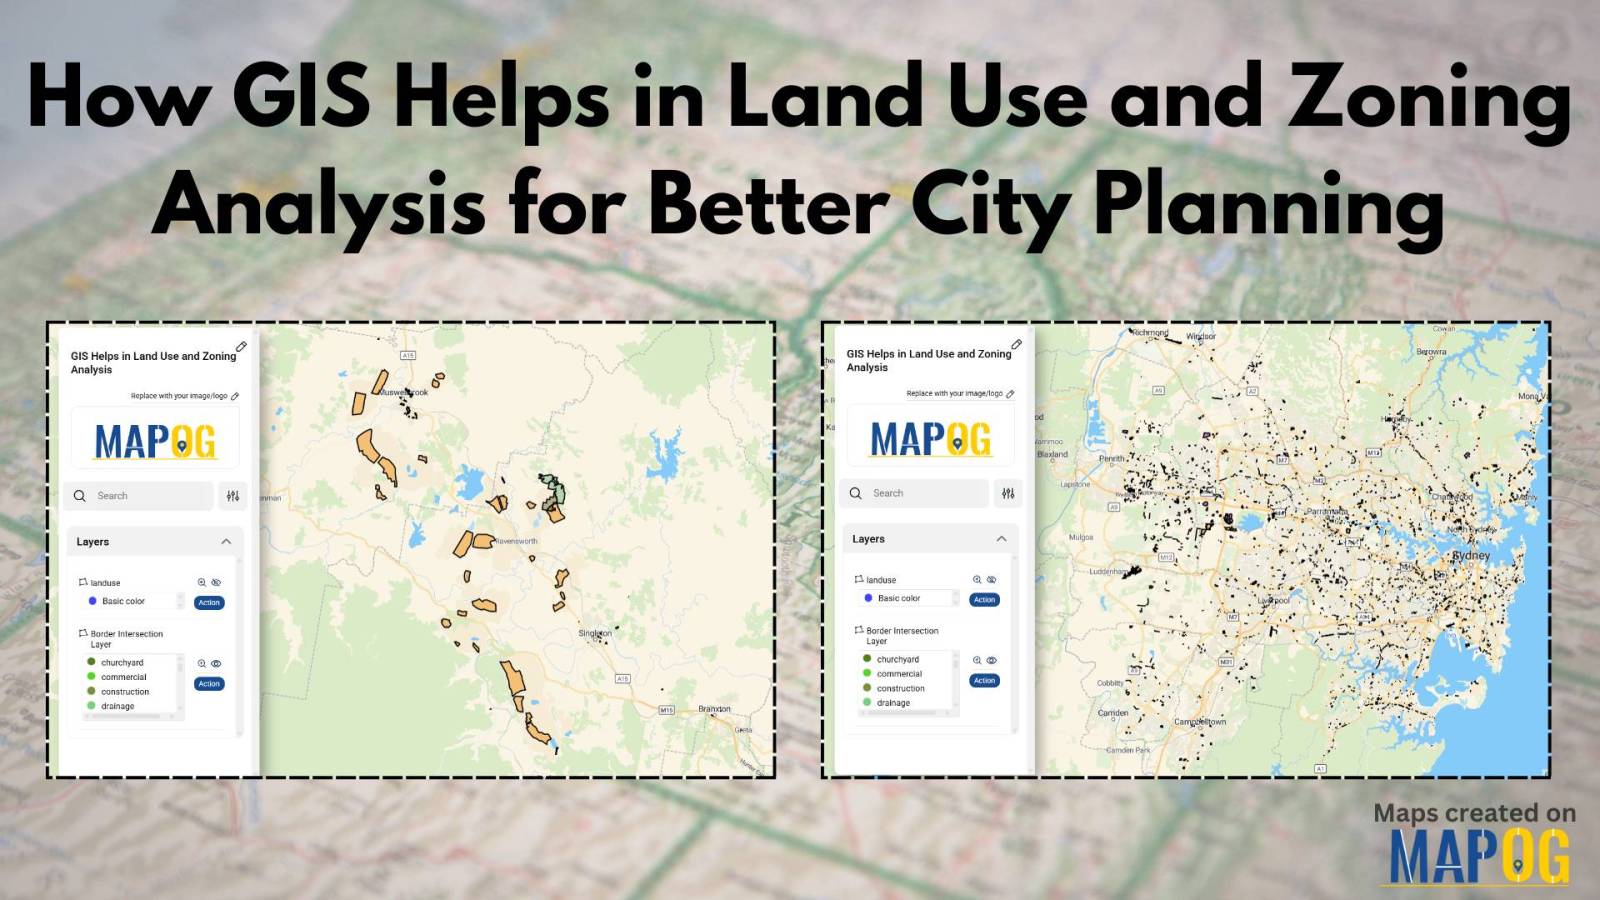
GIS in Land use and Zoning analysis for better city planning

In today’s fast-changing urban landscape, GIS in land use and zoning analysis for better city planning plays a vital role in shaping smarter, more livable cities. Whether it’s managing population growth, conserving green spaces, or optimizing infrastructure, city planners increasingly depend on GIS to make informed decisions. This article explores how GIS tools enhance zoning … Read more

How to use GIS for Soil Mapping and Crop Monitoring

GIS is crucial in agriculture for soil mapping and crop monitoring, enabling informed decisions to improve yield, optimize land use, and ensure sustainable farming. It helps identify soil types, track crop density, and enhance precision farming by processing and visualizing soil and crop data. Key Concepts in GIS for Soil Mapping and Crop Monitoring GIS … Read more

How GIS Can Predict and Mitigate the Effects of Rising Sea Levels

Rising sea levels pose a significant threat to coastal communities, ecosystems, and infrastructure. Geographic Information Systems (GIS) offer a powerful way to predict and mitigate the effects of rising sea levels by analyzing past water level data, modeling future changes, and planning mitigation strategies. By leveraging GIS technology, decision-makers can visualize vulnerable areas and implement … Read more

What Are Heatmaps and How to Create Heatmaps?

What Are Heatmaps and How to Create Heatmaps?

Ever wondered how to visualize data patterns effectively? Heatmaps are an excellent way to analyze trends, highlight intensities, and make data-driven decisions. Whether for website analytics, business insights, or geographic trends, heatmaps simplify complex datasets into easy-to-understand visuals. The best part? You can create heatmaps for free using tools like MAPOG’s Heat Map Style. Let’s … Read more

Mapping Top University Nations A Quantitative Approach

Mapping Top University Nations: A Quantitative Approach

Welcome to our exploration of the world’s top university nations through a quantitative lens. Using MAPOG map analysis, we delve into the geographical distribution of universities globally.  Join us as we uncover insights that inform education policies and international partnerships. KEY CONCEPTS Our goal is to create a world map of countries with the highest … Read more

How to Style Maps by Categories or Quantities in MAPOG?

Interactive maps are powerful tools for visualizing data in a way that’s easy to understand and engaging. Style Maps by Categories or Quantities in MAPOG allows you to highlight trends, differences, and relationships effectively. Whether you’re mapping demographic data, business insights, or geographical patterns, the ability to customize styles is crucial for making your data … Read more

Thematic Mapping for Data Analysis: Visualizing Trends with Bubble Maps

Thematic Mapping for Data Analysis is a powerful technique used to visualize complex datasets by representing geographic patterns through color-coded maps and scalable symbols. One of the most effective methods in thematic mapping is Bubble Thematic Mapping, where data points are displayed as bubbles of varying sizes, proportional to a specific attribute such as population … Read more

How to Use GIS Grid Tools for Mapping Healthcare Services and Improving Access

In the quest to enhance health care service delivery, GIS provides a robust platform for mapping and analyzing health care services across different regions. Utilizing grid-based mapping techniques in GIS allows for a detailed. The equal-area analysis of service distribution with highlighting areas. Mapping Health Care Services: Utilizing Grid Tools in GIS, This article outlines … Read more

County-Wise Income Analysis: Thematic Mapping for Better Insights & Decision-Making

The difficulty of visualizing and analyzing earnings data is addressed in “Easy Income Analysis Using Thematic Maps for County-Wise Insights,” where we use quantity thematic styling to depict earnings across several geographic counties. Key Concepts Using quantity thematic design to visually display the income distribution across geographic blocks, the county-Wise Earnings Analysis in MAPOG offers … Read more

Forest Management: Step-by-Step Guide to Split Polygon for Effective Maps

In ‘Forest Management Using Split Polygon Tool,’ we employ MAPOG Map Analysis to divide forested regions into equal parts, optimizing resource allocation and conservation efforts for sustainable forest management. Key Concepts MAPOG is an outstanding tool for creating interactive and innovative maps. We can employ this tool to divide forested regions into equal parts, optimizing … Read more