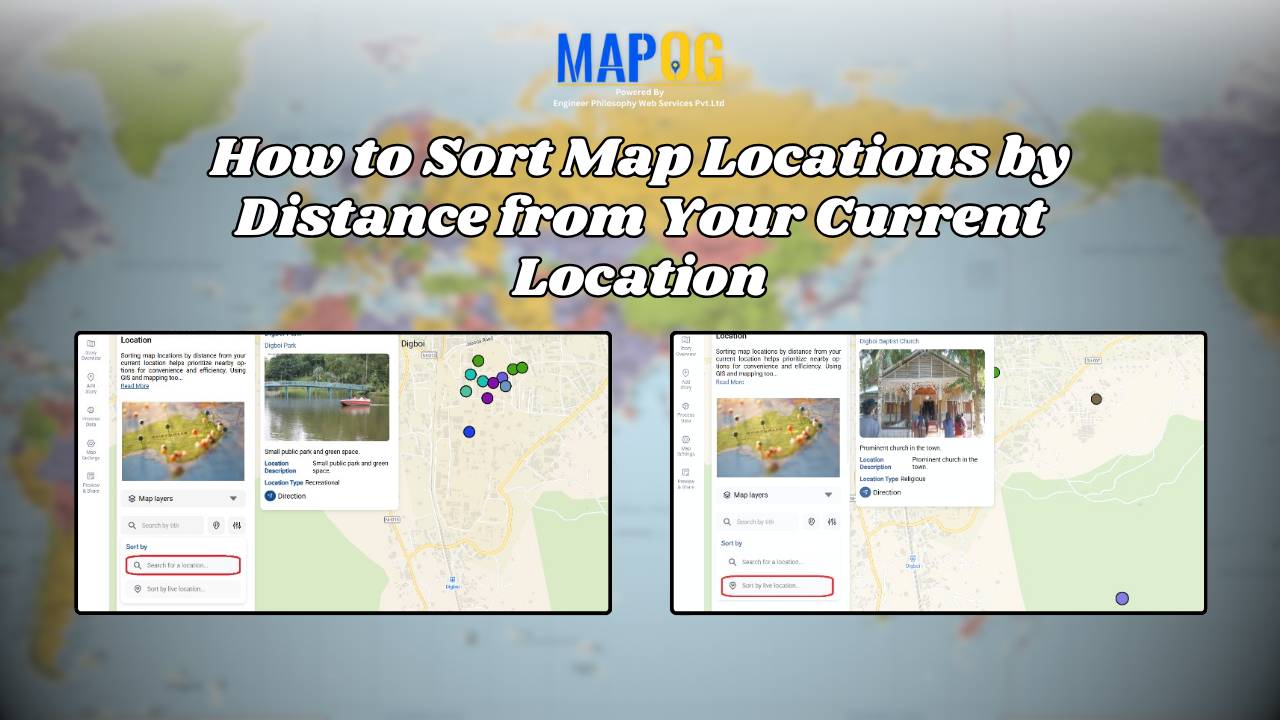
Use Case - Map Analysis

Mapping Cyclone Shelter Locations for Coastal Safety Using GIS

Mapping Cyclone Shelter Locations for Coastal Villages Using GIS

Mapping Cyclone Shelter Locations in coastal villages need quick access to shelters during emergencies. Visualizing shelter locations and their accessibility helps uncover gaps in disaster readiness. With MAPOG, users can build interactive GIS maps showing shelter distribution, village settlements, roads, and key geographic features. Instead of complex tools, this method uses simple layers and spatial … Read more

Performing Retail Site Selection with Convex Hull Analysis

Performing Retail Site Selection with Convex Hull Analysis

Choosing the right retail location goes beyond guessing where people shop. Instead it’s about recognizing spatial clusters, identifying market gaps, and optimizing coverage. With this in mind, MAPOG, retailers can make data-driven decisions by interpreting customer and store distributions visually. Coupled with heat bubble styling, grid-based analysis, or retail site selection , MAPOG enables smarter … Read more

Map River and Road Intersections for Environmental Analysis

Create a Map of River and Road Intersections for Environmental Analysis

To begin with, understanding the intersection between rivers and road networks is essential for effective environmental planning and risk management. In particular, these road and river intersections can indicate areas vulnerable to flooding, erosion, or pollution. By doing so, urban planners, environmental analysts, and disaster response teams to make data-driven decisions that improve sustainability and … Read more

Create interactive maps using MAPOG without technical skills

Create Interactive Maps Without Any Technical Skills – A Visual Guide

Creating interactive maps no longer requires technical skills or expertise in geographic information systems. Today, even individuals without a background in GIS can visualise and analyse spatial data to better understand real-world issues. Whether you’re a teacher, student, or policy planner, interactive maps can powerfully communicate patterns, challenges, and opportunities in education, healthcare, infrastructure, and … Read more

Top places to Visit Across India – Visual Travel Guide on Map

India is more than a destination it’s a vibrant journey through culture, nature, and heritage. With the MAPOG code-free mapping platform, you can effortlessly transform your travel plans or blog into an interactive visual experience, highlighting top places to visit across India. From sacred sites to scenic wonders, bring India’s diversity to life all in … Read more

How GIS is Improving Traffic Management and Road Safety  

Traffic congestion and road accidents are major challenges in urban areas, leading to economic losses, increased pollution, and safety risks. As a result, Geographic Information Systems (GIS) have emerged as a powerful tool for analyzing, visualizing, and optimizing traffic flow while enhancing road safety. As a result of integrating spatial data, traffic authorities can identify … Read more

Real-Life Crime Tracking Maps: Using GIS for Urban Safety

Real-Life Crime Tracking Maps: Using GIS for Urban Safety

Geographic Information Systems (GIS) have become an indispensable tool in enhancing urban safety by providing detailed Real-Life crime tracking maps and analysis. By combining geospatial data with law enforcement records, GIS enables cities to visualize crime hotspots, predict patterns, and address cyber security concerns. Furthermore, it supports effective planning for strategic law enforcement deployment. Through … Read more

Power Grid and Infrastructure mapping and planning using GIS

Power Grid and Infrastructure mapping and planning using GIS

Geographic Information Systems (GIS) are revolutionizing power grid mapping and infrastructure planning. By linking geospatial intelligence with electrical grid data, GIS enables utility companies and energy planners to visualize, assess, and optimize power distribution networks. Furthermore, it supports everything from the planning of substations and transmission lines to the ongoing monitoring of grid performance. As … Read more

Flood Risk Mapping with Interactive Web Maps: A SaaS Platform Approach

Flood Risk Mapping with Interactive Web Maps: SaaS Approach

A SaaS-based flood risk mapping platform leverages interactive web maps to provide risk assessments. Using GIS, AI, and hydrological data, it enables governments, insurers, and communities to visualize flood-prone areas, enhance preparedness, and optimize response strategies. Cloud-based accessibility ensures scalability, data integration, and seamless user collaboration for proactive risk management. Key Concept How Flood Risk … Read more

HOW GIS CAN HELP IN REDUCING URBAN HEAT ISLANDS WITH SMART MAPPING

How GIS and Smart Mapping Reduce Urban Heat Islands

GIS for Heat Island Reduction enables smart mapping to analyze temperature variations identify heat-prone areas, and optimize green spaces. It supports strategic tree planting, reflective surfaces, and heat-resistant materials. GIS-driven data aids urban planners in designing cooler, sustainable cities with improved land use, reducing heat retention and energy consumption. Key Concept: GIS for heat island … Read more