Use Case - Map Analysis

Mapping Education Institute Types : A Category Style Map

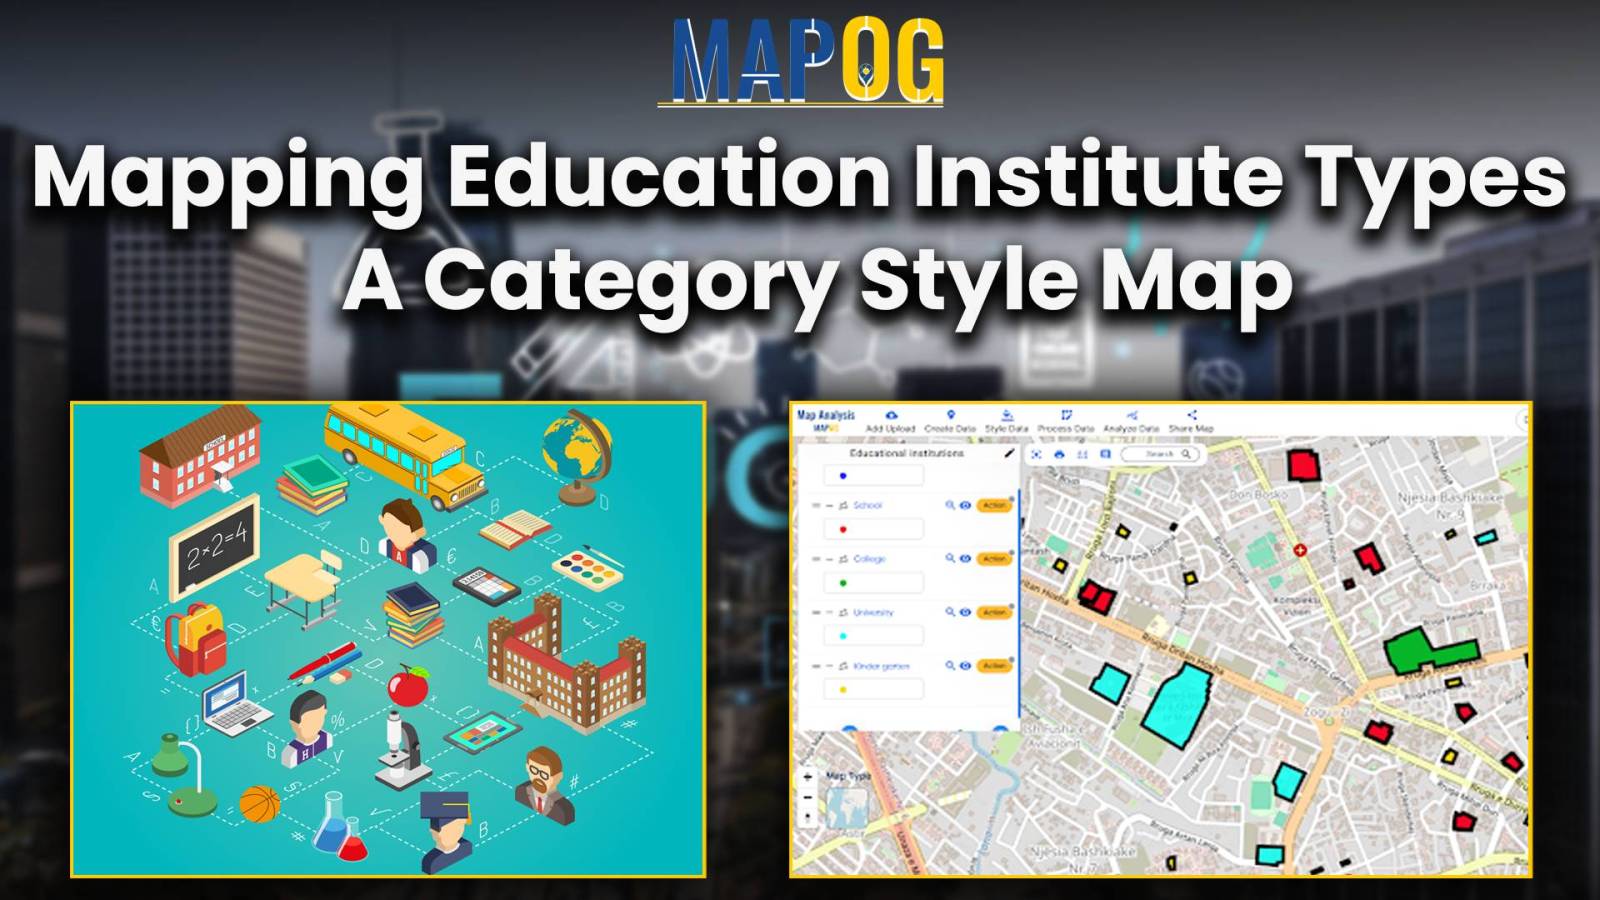
Category Style Map: Mapping Education Institution Diversity

In the realm of spatial analysis, understanding the distribution and types of educational institutions is paramount for effective planning and decision-making. With the advent of advanced GIS platforms, such as MAPOG, utilizing tools like proximity analysis has become instrumental in categorizing educational institutions with precision and efficiency. This article delves into the key concept of … Read more

Online Conversion: Points into Polygon Map

Online Conversion: Points into Polygon Map

The Point to polygon tool is used to build a polygon that represents the smallest region or area that encloses a set of points. The Point to Polygon tool essentially converts point data, representing specific locations, into polygonal shapes. These polygons serve as a visual representation of the distribution or extent of any phenomenon under … Read more

How to combine or merge polygons in a single polygon layer

How to combine or merge polygons in a single polygon layer

Unlock the power of seamless spatial data management with MAPOG Map Analysis. In this article, discover how the Merge Polygon tool revolutionizes the process of combining polygons into a single layer. Streamline your map analysis workflow and unleash the full potential of your spatial data with MAPOG KEY CONCEPTS Our goal is to merge the … Read more

mapping heat index

Mapping Air Quality Index: Air Pollution Monitoring

In this article, we examine the utilization of MAP OG’s MAP ANALYSIS techniques for visualizing Air Quality Index (AQI) data and Mapping Air Quality Index. Discover how GIS tools offer insights into pollution patterns, aiding informed decision-making for environmental health. Through sophisticated mapping techniques, we uncover nuanced insights into air pollution distribution. Explore how these … Read more

Create Map :Join the Excel population data to the country polygons

Create Map :Join the Excel population data to the country polygons

In the present scenario of data-driven decision-making, understanding population demographics is paramount across various domains. One tool that stands out in this regard is the Excel attribute tool of MAPOG GIS Platform. This tool enables users to seamlessly integrate Excel population data with spatial data, providing valuable insights into demographic trends. The importance of this … Read more

Create a Map to Identify Pollution-Affected Regions

Create a Map to Identify Pollution-Affected Regions

Focusing on the task of identifying pollution affected regions, MAPOG’s Map Analysis helps recognize areas of environmental concern. As pollution remains a pressing issue, the article explores how this tool not only identifies problems but also facilitates informed mitigation measures. Join us on this exploration into the world of advanced mapping for a greener future. … Read more