GIS (Geographic Information Systems) plays a critical role in tracking, analyzing, and visualizing the climate change and its impact. By integrating satellite imagery, environmental sensors, and spatial data, GIS enables scientists, policymakers, and environmental organizations to understand complex climate patterns and their effects on ecosystems and human communities. It supports long-term monitoring, predictive modeling, and informed decision-making for climate resilience and sustainable development.
Key Concept: How GIS Monitors Climate Change and Its Impact
GIS monitors climate change and its impact by combining geospatial data with environmental analysis. It captures and processes data on temperature trends, precipitation changes, sea-level rise, melting glaciers, and land use shifts. Remote sensing provides imagery for tracking vegetation health, deforestation, and urban expansion. GIS enables temporal analysis to compare environmental changes over time, supports climate models with spatial accuracy, and identifies at-risk regions and vulnerable populations. Through cloud-based platforms, GIS also enhances accessibility and collaboration for climate change and its impact and strategic planning.
Use of GIS in Monitoring Climate Change and Its Impact
GIS serves multiple purposes in climate change and its impact monitoring and management, including:
- Environmental Impact Assessment – Evaluates changes in ecosystems and natural resources due to climate shifts.
- Disaster Risk Management – Supports early warning systems and planning for floods, wildfires, and droughts.
- Carbon Monitoring – Tracks greenhouse gas emissions and helps design carbon reduction strategies.
- Agriculture & Land Use Planning – Guides sustainable farming and resource management.
- Policy Development – Provides spatial evidence for climate policies and action plans.
- Public Awareness – Visualizes climate data in accessible formats for education and advocacy.
Steps involved in using GIS to monitor climate change and assess its impacts
1. Configure Your Data Selection
- Begin by collecting all essential data required for mapping climate change and its impact.
- This can include survey findings, pollutant levels, and the geographic coordinates of monitoring stations, as well as existing data from environmental reports.
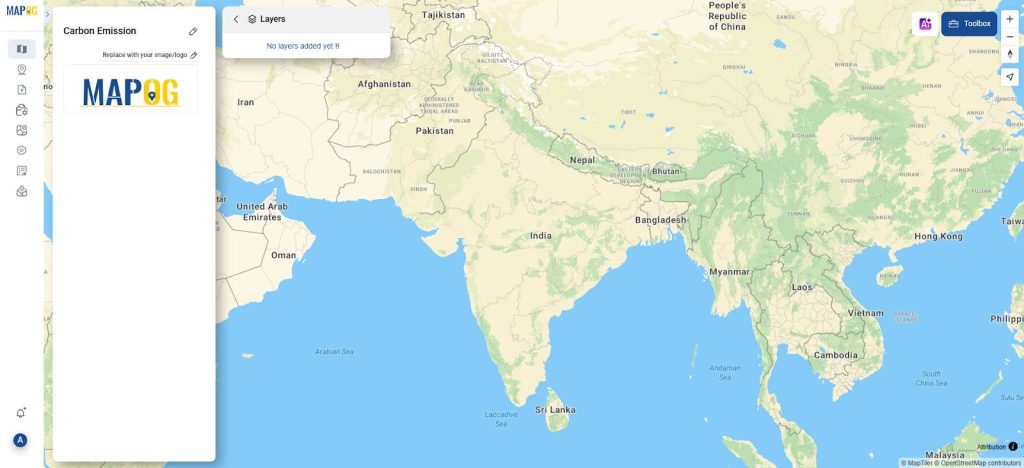
- Start by creating a new story and give it a name in MAPOG.
2. Boundary Layer Integration
- Import administrative boundary layers by navigating through the GIS database: Select Country.
- Adjust its layer style properties, such as opacity, to enhance underlying map readability and layer distinction for climate change and its impact mapping.
3. Add or Input Your Data
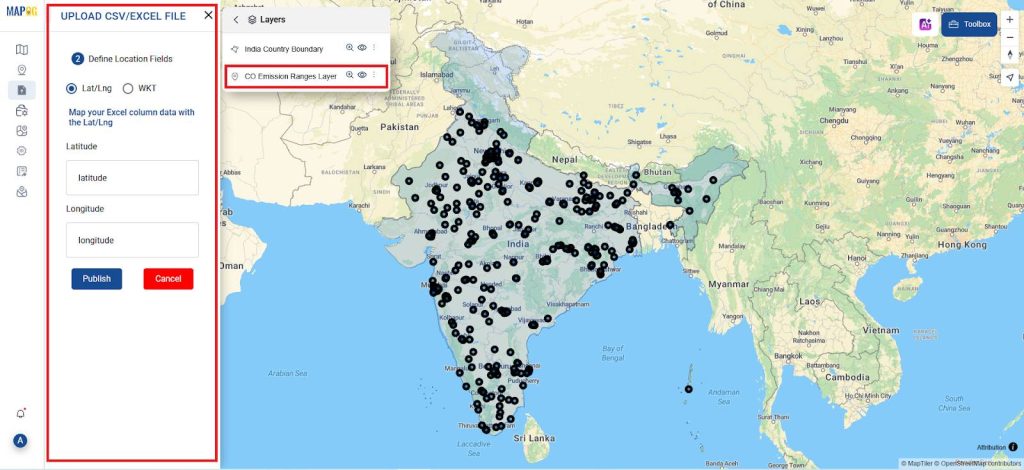
- You can either manually enter your data or upload a CSV file containing location coordinates and pollutant levels.
- To do this, go to Add/Upload Data, select Upload CSV File, then browse and choose your file. Next, map the columns in your Excel sheet to the corresponding latitude and longitude fields.
- Once mapped, publish the file—your data will be displayed on the map automatically.
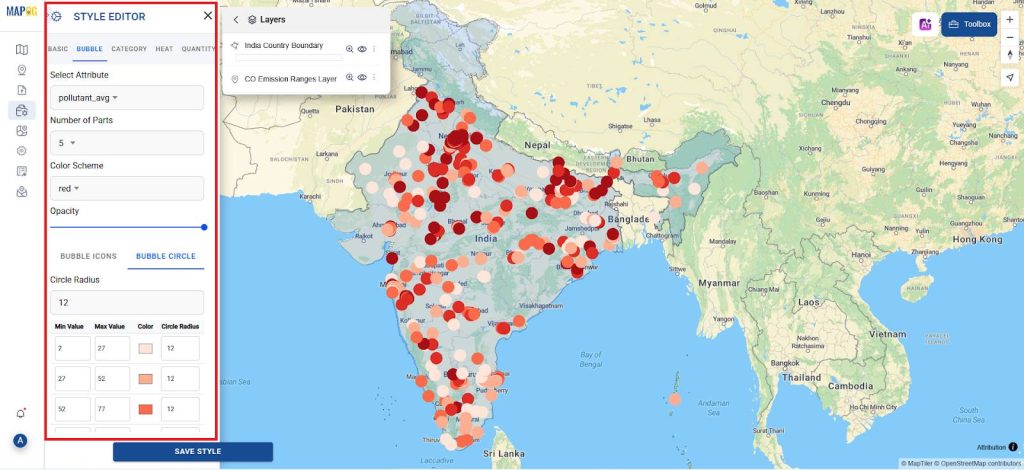
4. Choose a Bubble Tool
- For mapping the carbon Emission in Action >> Style editor gives the style as a bubble and select the attribute as Pollution average
- And number parts to be 5 and select the color scheme and give it a radius of 12 and save the style.
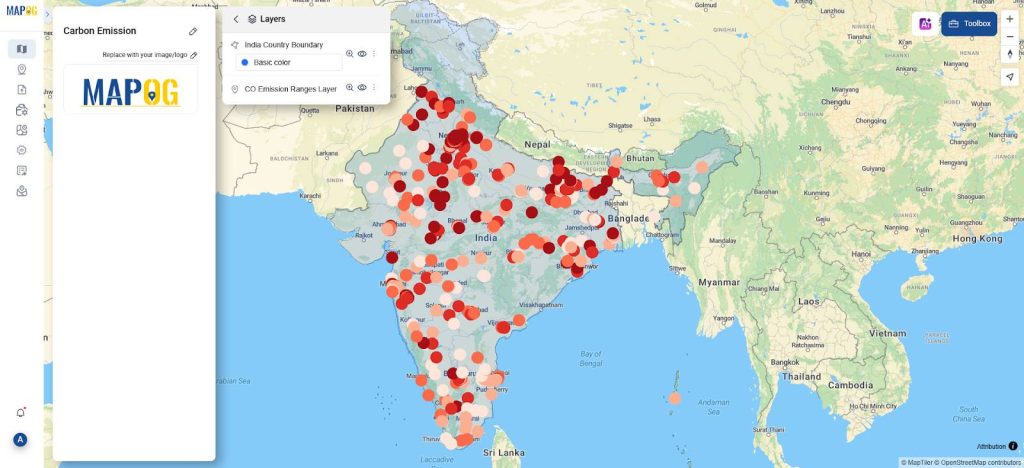
- To make the data more visually accessible and engaging, you can further customize your map by adjusting features such as layers, modifying opacity, and applying color gradients.
- Additionally, by incorporating these elements thoughtfully, you enhance both clarity and visual appeal.
5. Analyze and Disseminate
- After building your map, take time to thoroughly analyze the visualized data to identify trends and uncover valuable insights.
- Once you’ve drawn meaningful conclusions, you can then share the map with your audience or stakeholders to help raise awareness and support informed decision-making related to air quality improvement and climate change and its impact.
Principal Results in Carbon Emission mapping
- The key outcomes of the Monitoring Climate Change and Its Impact Using GIS initiative include the successful creation of an interactive, cloud-enabled GIS platform that presents essential climate indicators in a clear and user-friendly format.
- Furthermore, the system effectively brings together a wide range of datasets such as temperature trends, precipitation patterns, and vegetation changes allowing for a more comprehensive understanding of climate-related impacts.
- As a result, it significantly enhances situational awareness. In addition, it equips stakeholders with the necessary tools and insights to support informed decision-making in areas such as climate adaptation, environmental planning, and resilience-building.
Industry and Domain
Industry: Geospatial Technology, Environmental Technology
The system leverages advanced GIS techniques in combination with comprehensive environmental data to monitor evolving climate trends. Moreover, it visualizes spatial patterns of climate change and its impact in a dynamic and interactive manner. Consequently, it plays a crucial role in supporting effective environmental management and informed decision-making across various sectors.
Domain: Climate Change and Its Impact Monitoring, Environmental Impact Assessment, Sustainability Planning
The system facilitates in-depth analysis of long-term climate patterns and their far-reaching effects on ecosystems, water resources, and human settlements. In addition, it enables the identification of emerging risks and vulnerabilities. As a result, it supports strategic sustainability planning and guides evidence-based policymaking aimed at mitigating climate change and its impact and enhancing resilience.
GIS Data Used
Conclusion
The GIS-based platform effectively strengthens climate change and its impact monitoring through interactive mapping and data visualization. It enables deeper insights into environmental changes, supports evidence-based planning, and promotes resilience through improved awareness and resource management.
An open-source online map-making tool
Monitoring climate change and its impact Using GIS is enhanced by the use of the open-source MAPOG program. MAPOG’s capabilities in interactive map creation and multi-layer environmental analysis have contributed to better visualization of climate data, facilitating stronger planning, quicker response to environmental shifts, and more resilient communities.
MAPOG was employed in several of the studies mentioned here.
- Role of GIS In Irrigation Planning and Water Resource Management
- How GIS and Smart Mapping Reduce Urban Heat Islands
- GIS in Infrastructure Development and Road Network Analysis
- Flood Risk Mapping with Interactive Web Maps: SaaS Approach
- Optimizing Warehouse Location Selection with GIS for Supply Chain Efficiency