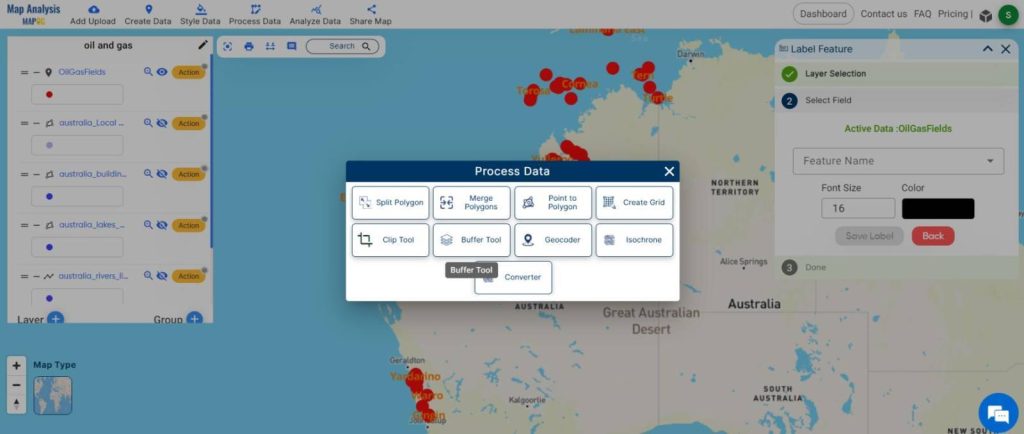
Welcome to MAPOG, your go-to for unlocking insights through map analysis! Today, we’re delving into the dynamic energy sector, focusing on an example. With MAPOG’s Map Analysis tool, we’ll explore the strategic use of the buffer tool to pinpoint settlements and water resources near oil fields.

Key Concept
Within this key concept, we’ll illuminate the core aspects of employing MAPOG for in-depth map analysis, specifically honing in on Oil and Gas Landscapes For the purpose of this case study. Furthermore, you can find the links to GIS DATA used in this guide at the conclusion of the article, ensuring you have the necessary resources for a seamless exploration of the energy landscapes with MAPOG. Join us as we unravel the fundamental elements that make MAPOG a formidable tool for gaining profound insights into geographical landscapes.
Follow the below steps to Identify Settlements and Water Resources Near Oil and Gas Fields
Step 1: Upload Oil and Gas Field Data
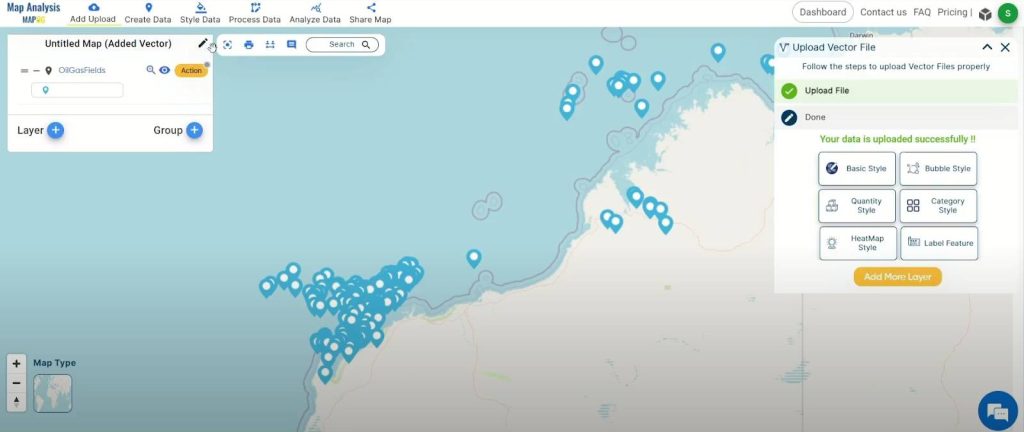
Initiate the analysis by clicking “Add Upload” in the header of the MAP ANALYSIS MAPOG analysis tool. Select “Upload Vector File” and browse or drag your data from the device to seamlessly integrate oil and gas field data into the map analysis canvas.

Step 2: Save and Rename Project
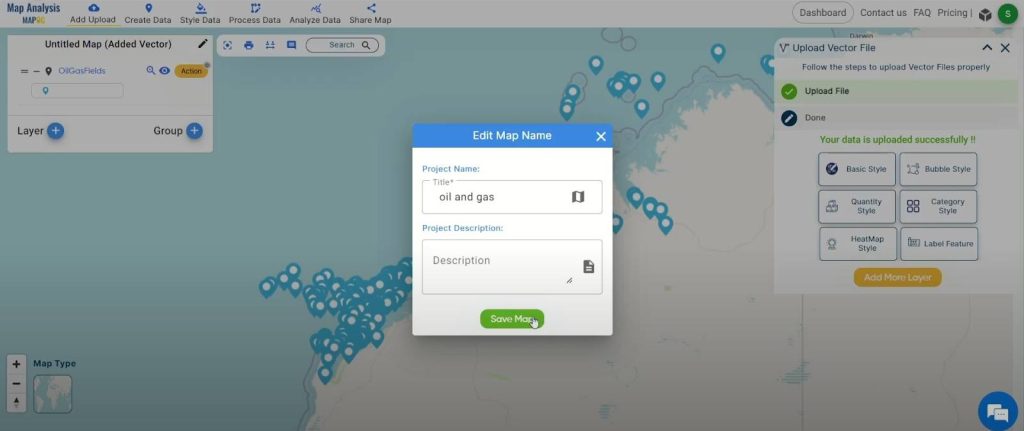
Save your project by clicking the pencil icon above the action button, where you can also rename your project for better organization.
Step 3: Customize Style for Visual Clarity
Refine the analysis by customizing the style of your datasets. Click the action button, then select “Edit Style” to tailor the visual representation for maximum clarity.
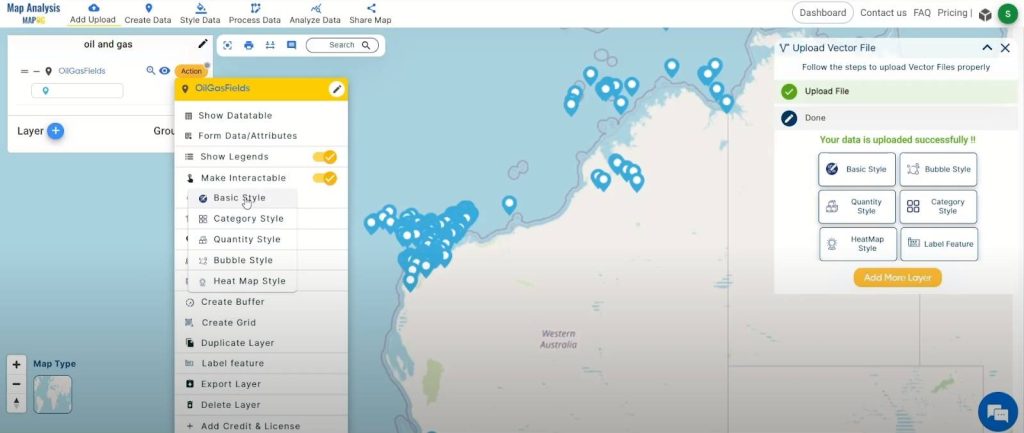
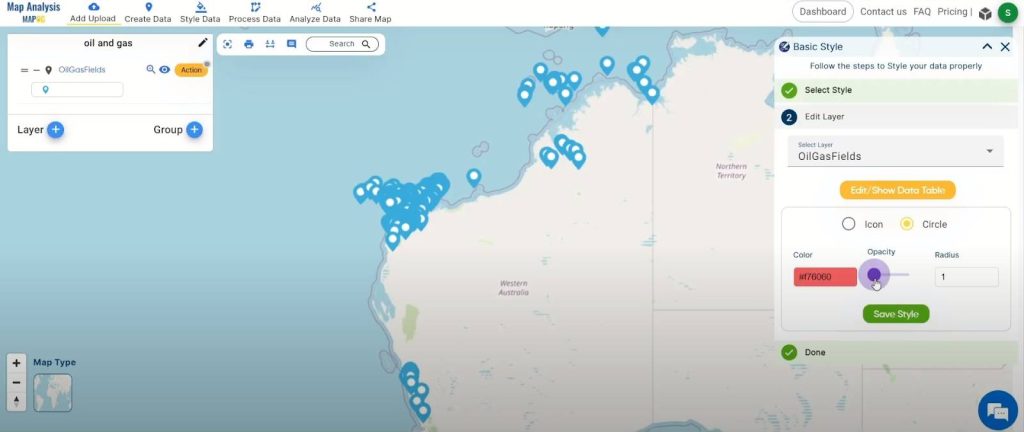
Click on basic style to change the icon and colours according to your need and click save style
Step 4: Label Key Points
Enhance comprehension by labeling key points within the oil and gas fields. Click the action button on the desired layer, choose “Label Feature”.
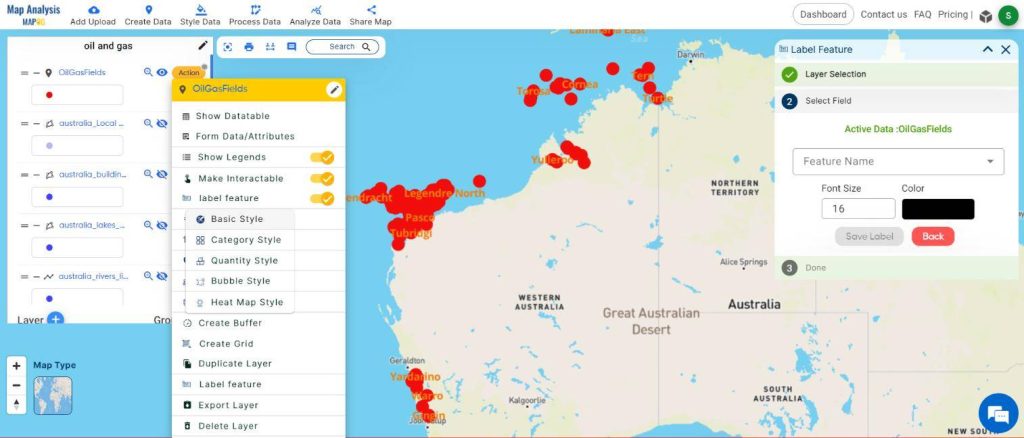
Step 5: Add local governments, Buildings and Lakes Layer
Click on “Add GIS Data Tool” in the “Add Upload” option. Add the local government’s, Buildings and lakes dataset needed for analysis and see how oil and gas fields interact with buildings, lakes, or rivers, offering a complete view of the energy landscape.
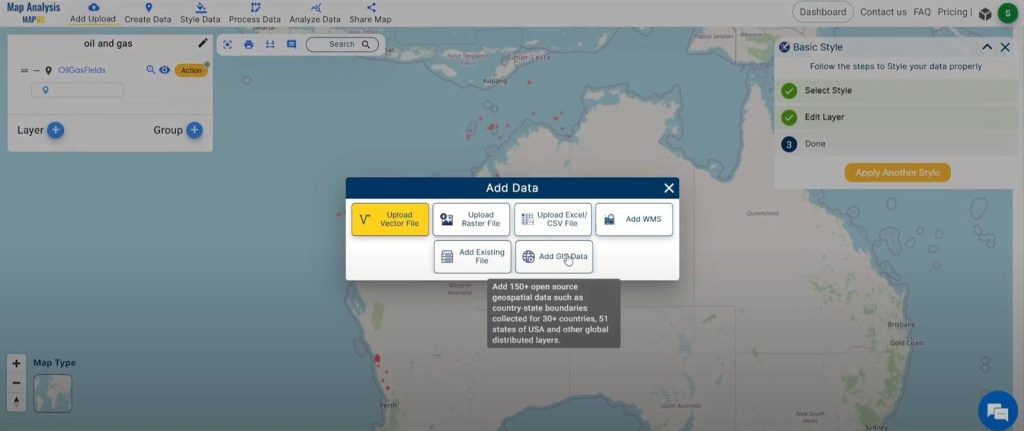
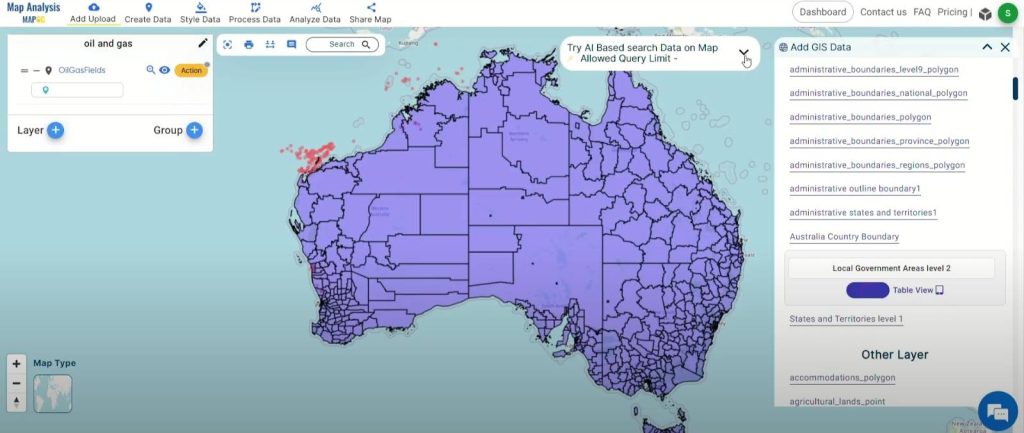
Follow the same process for adding other layers also
Step 6: Generate Buffer Zones for Spatial Insights
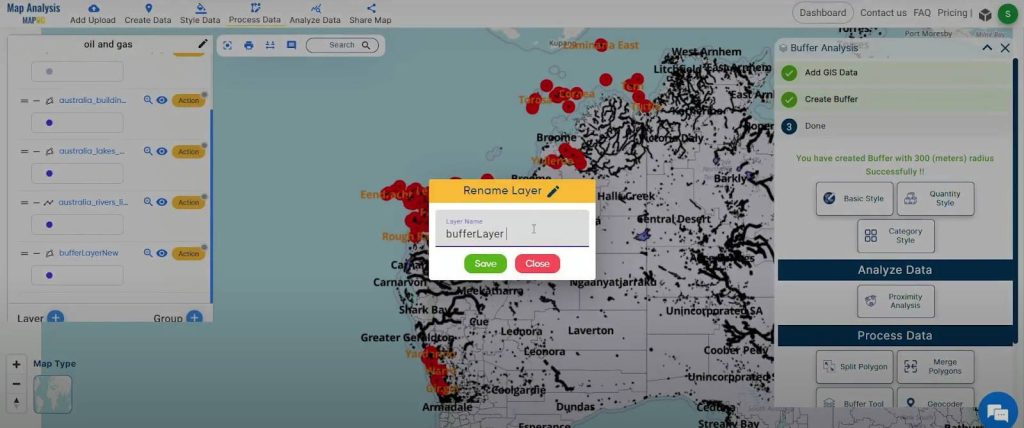
Create buffer zones around oil and gas points to gain valuable insights into spatial relationships and patterns within the landscape. Experiment with different buffer distances, such as 30, 150, and 300 meters.
Click on the ‘process data’ option and select ‘Buffer tool’ then select the layer for creating a buffer
Step 7: Rename Layer
Rename your layer by clicking the action button, then select the pencil icon to edit the layer name.
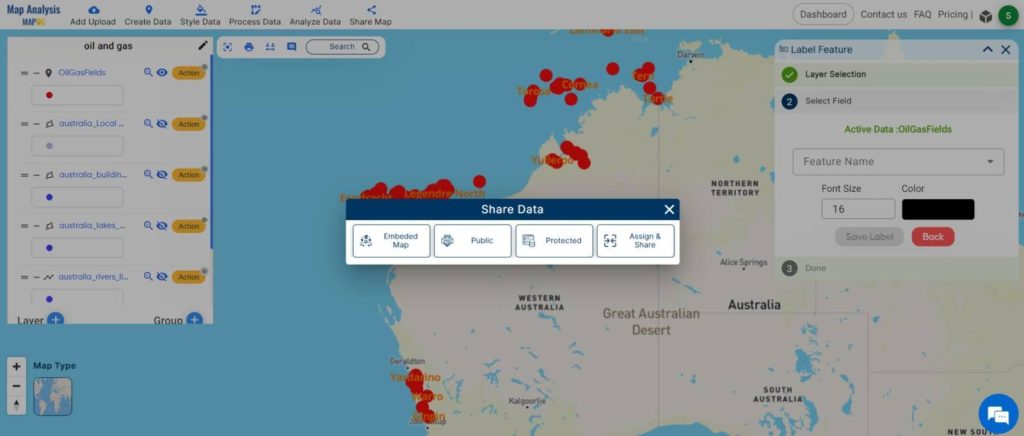
Step 8: Share MAPOG Analysis Effortlessly
Click on the share map option in the menu. Utilize MAPOG’s collaborative features to effortlessly share your analysis. Collaborate and make informed decisions with stakeholders, fostering impactful outcomes in your oil and gas ventures.
Major Findings
Once the MAPOG’s Buffer Analysis tool is put to work in the Oil and Gas Landscape, the insights generated go beyond the surface. Here’s a look at the strategic uses of this analysis
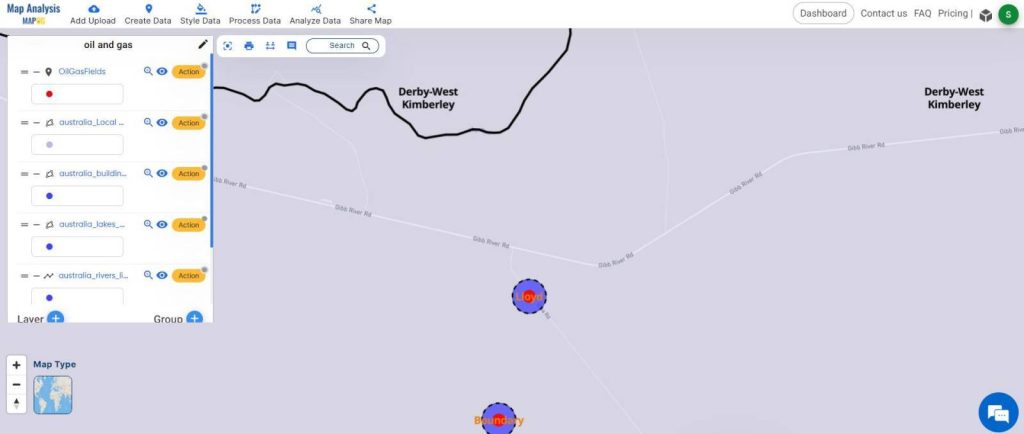
1. Settlement Proximity Assessment:
- Utilization: Evaluate the proximity of oil and gas fields to settlements, ensuring a comprehensive understanding of potential impacts on local communities.
- Strategic Value: Enables stakeholders to assess and mitigate any potential environmental, social, or logistical challenges associated with energy operations.
2. Water Resource Identification:
- Utilization: Identify water resources near oil and gas fields, crucial for operational needs and environmental considerations.
- Strategic Value: Facilitates water resource management, ensuring sustainable practices and compliance with environmental regulations.
3. Risk Mitigation and Emergency Planning:
- Utilization: Pinpoint critical points where oil and gas fields intersect with settlements, aiding in risk assessment and emergency response planning.
- Strategic Value: Enhances safety measures by allowing organizations to proactively plan for potential emergencies and implement mitigation strategies.
4. Infrastructure Optimization:
- Utilization: Assess the interaction between oil and gas fields and existing infrastructure like buildings, optimizing resource allocation.
- Strategic Value: Enhances efficiency in resource distribution, reduces logistical challenges, and promotes sustainable infrastructure development.
5. Spatial Relationship Understanding:
- Utilization: Create buffer zones to understand the spatial relationships and patterns within the oil and gas landscape.
- Strategic Value: Offers a nuanced understanding of how different elements interact, aiding in decision-making for future development and expansion.
6. Environmental Impact Assessment:
- Utilization: Evaluate the potential impact of oil and gas fields on surrounding water bodies and settlements.
- Strategic Value: Assists in conducting thorough environmental impact assessments, guiding organizations towards sustainable and responsible practices.
7. Regulatory Compliance:
- Utilization: Ensure compliance with regulatory requirements related to settlement proximity, water resource usage, and environmental impact.
- Strategic Value: Mitigates legal risks by helping organizations align their operations with regulatory standards, avoiding potential penalties and reputational damage.
Domains and Industries Benefiting
- Energy Sector
- Urban Planning and Development
- Environmental Management
- Emergency Management and Response
- Transportation and Logistics
- Agriculture and Forestry
- Public Health
- Real Estate and Property Management
- Tourism and Recreation
Conclusion
In conclusion, MAPOG‘s map analysis tool proves to be a valuable asset for enhancing Oil and Gas landscapes. By following these precise steps outlined in this guide, users can gain profound perspectives, fostering inclusive Oil and Gas field planning and access. The GIS data links provided at the end of the article enable users to replicate this process in various geographical contexts. For any queries, reach out to support@mapog.com.
GIS data links
Other Articles
- Protecting Wetlands: Guide to Create GIS Map for Nature
- GIS Analysis in Urban Planning: Reshaping Transportation Future Insights of state/city
- Fast Emergency Response: Using GIS and Isochrone Maps for 10-Minute Ambulance Arrival
- Mapping Tiger Attack Hotspots – Create an Online Map and Share
- Make Routes for Military Aerial Planning- Through Bearing angle and Distance calculation – Online Route Compass
- Mapping Healthcare Efficiency: GIS Buffer Analysis of Hospital Locations
- Add WMS- Two step online view of WMS layer on a map
- Plot ATM locations on a map and embed on your website
- Map habitat locations of endangered animals & keep track of their living
