Find out how MAPOG’s convex hull tool can be used to map the transmission of infectious diseases. Gain the ability to map out and evaluate influence regions, which will enable communities to contain outbreaks more successfully.
Key Concepts
Analysis of Contagious Diseases Convex Hull is used to identify their spheres of effect in order to better comprehend and contain breakouts.
Steps to create Contagious Disease Influence Area Analysis Using Convex Hull
Step 1: Upload Contagious Disease data
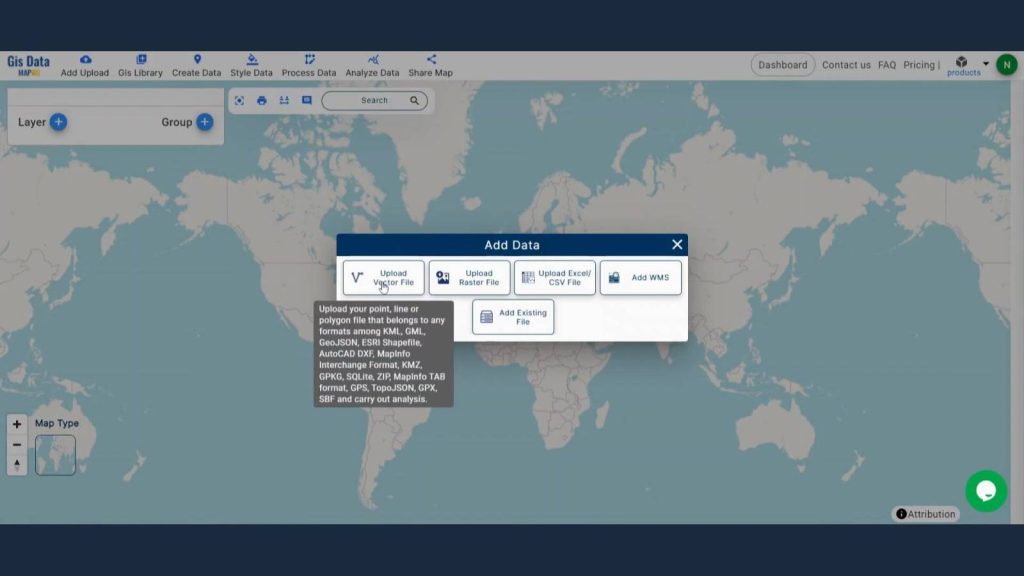
First, navigate to the Map Analysis interface. Then click on the “Add upload” button in the upper left corner. A dialogue box will open. Click on “Upload Vector File” to add data.
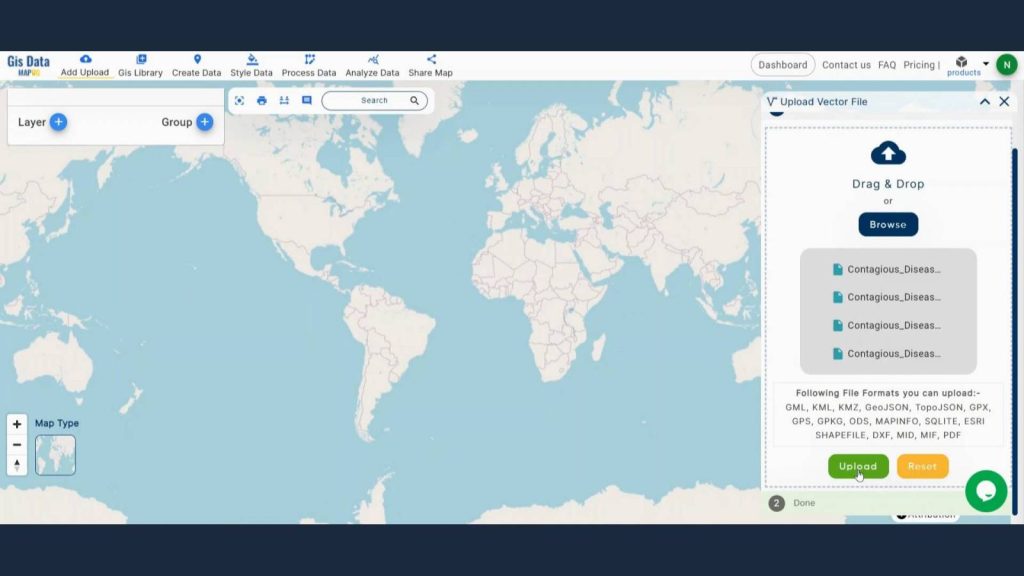
A box will open on the right side of the screen, select Browse option to browse Contagious Disease data & click Upload to upload the data.
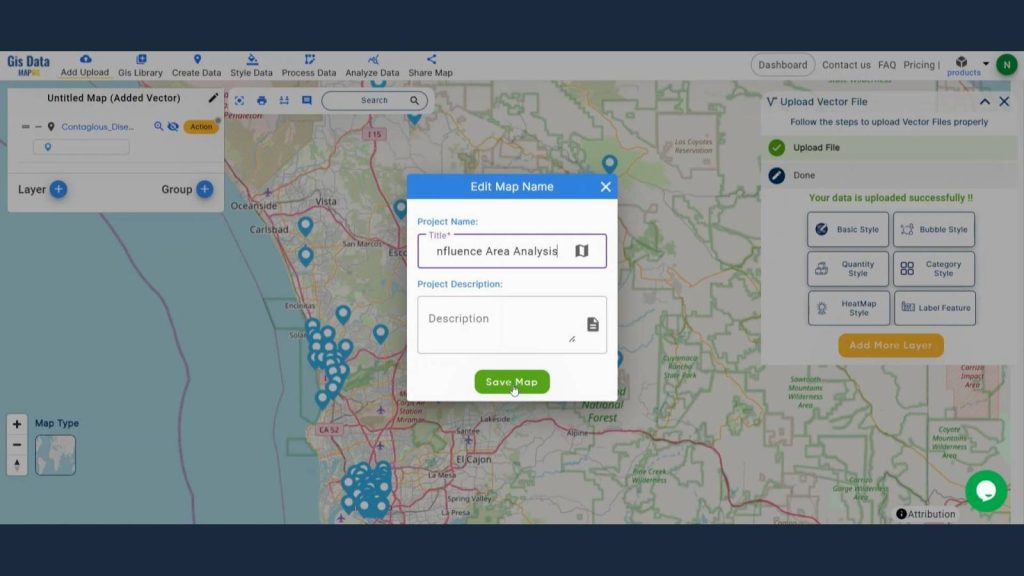
Step 2: Save Project
Now, click on the pencil icon situated right after the “Untitled Map” text to save the project. In the dialogue box write proper name and description that describe the project accurately. And click on save map option. Your project will be saved.
Learn how proximity analysis and isochrones are used in ‘Mapping Village Coverage within 60 Minutes of Each Hospital’ to improve healthcare access and guarantee timely medical care for rural populations. Discover how to use spatial insights to improve health planning.
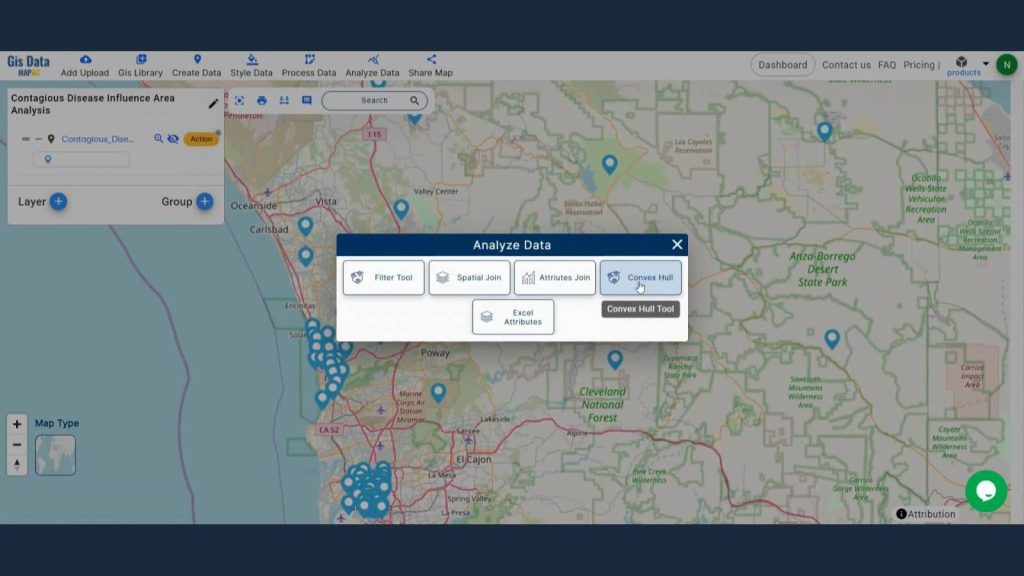
Step 3: Create Convex Hull
Now we are going to create Convex Hull around the Contagious Disease to show influence areas. Click on analyze data to click Convex Hull.
Provide the disease data in the select feature section and disease name attribute in the join attribute section. Select the buffer range as 800 meters.
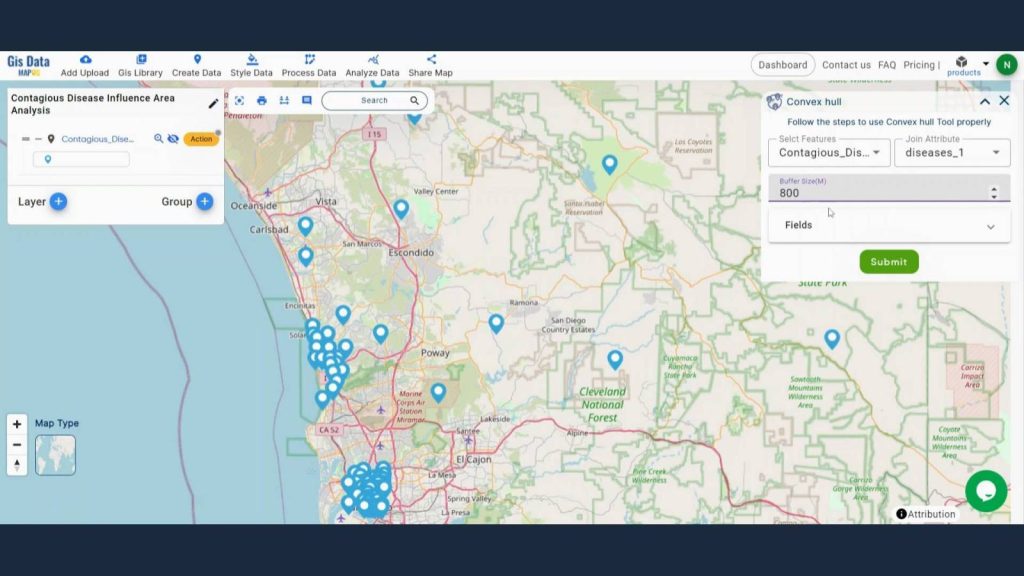
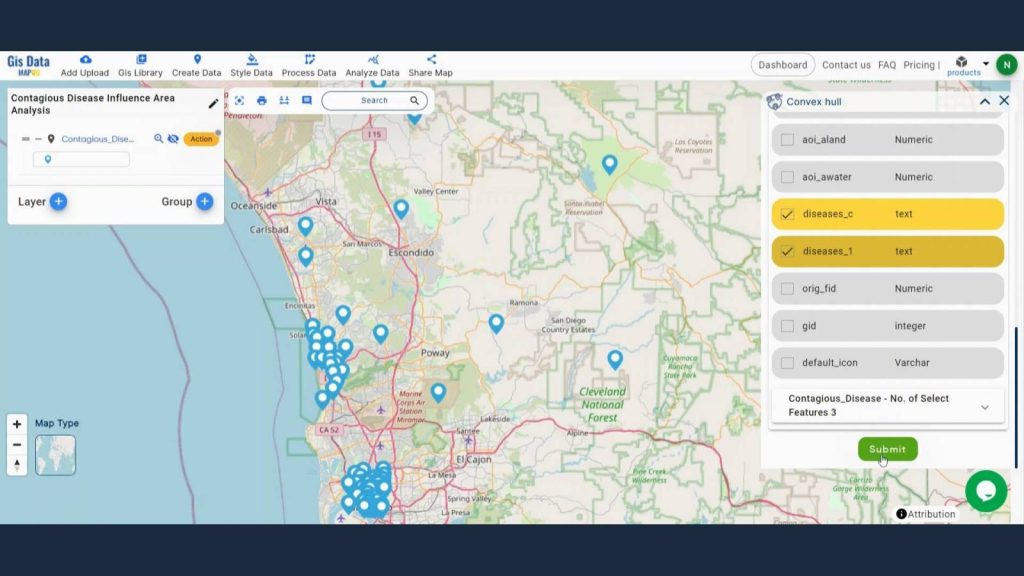
and select the field which you want in the data table then click submit.
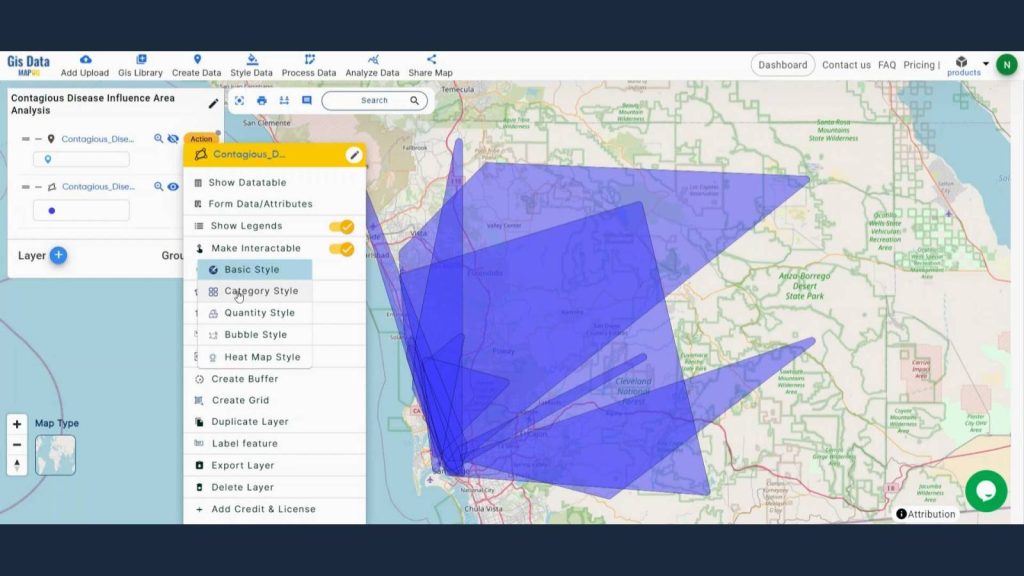
Step 3: Add Thematic Styling
Enhance the visualization of the newly created influence areas. Select Category style from Influence area action Button’s Edit style.
Uncover the potential of ‘Category Style Map: Mapping Education Institution Diversity’ by using MAPOG! With simple, color-coded mapping, you can visualize and distinguish between different types of educational institutions based on their demographics, improving analysis and decision-making.
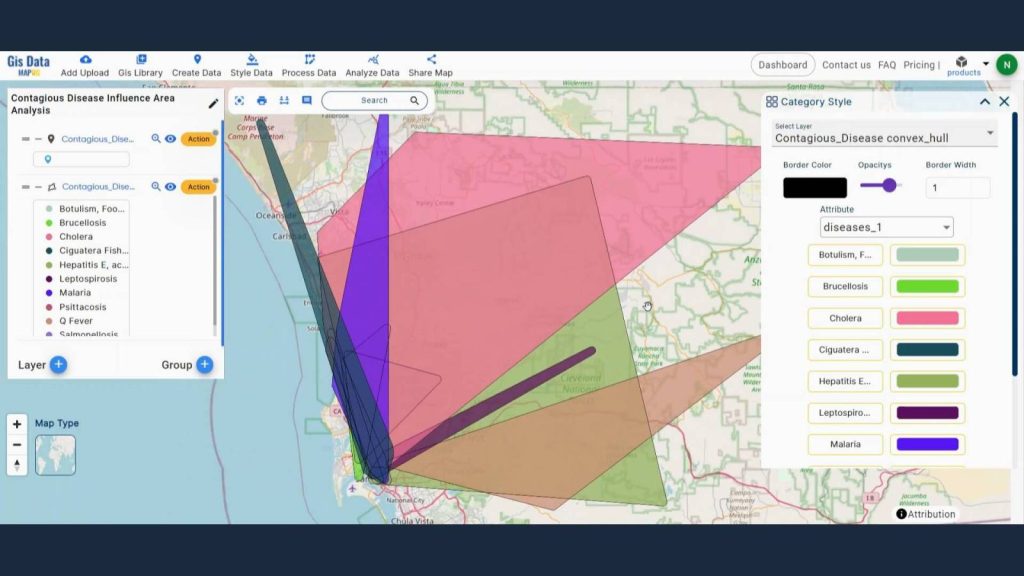
Select Disease name in the layer section. Then reclassify and enhance your data according to your choice.
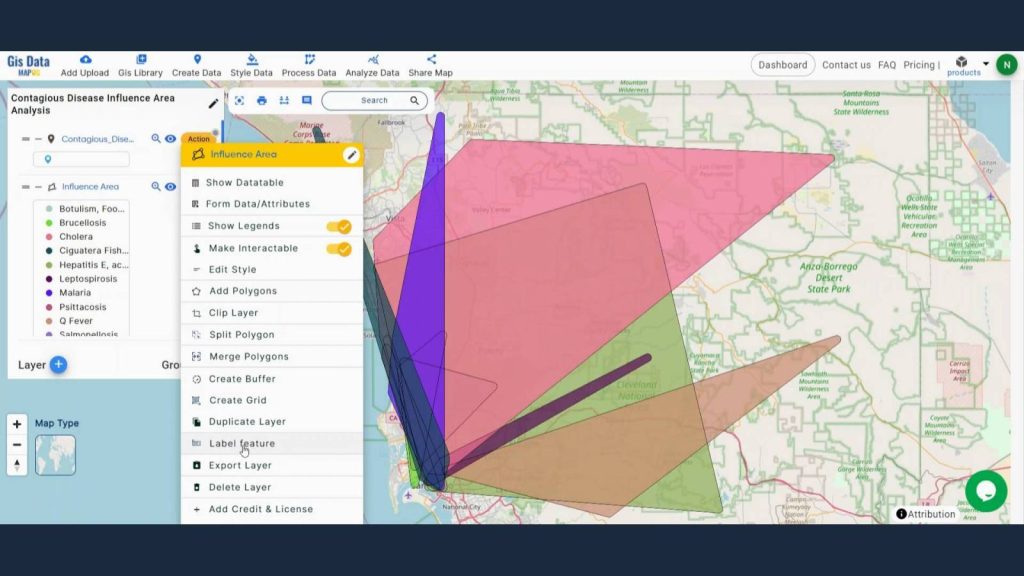
Step 4: Add Label feature
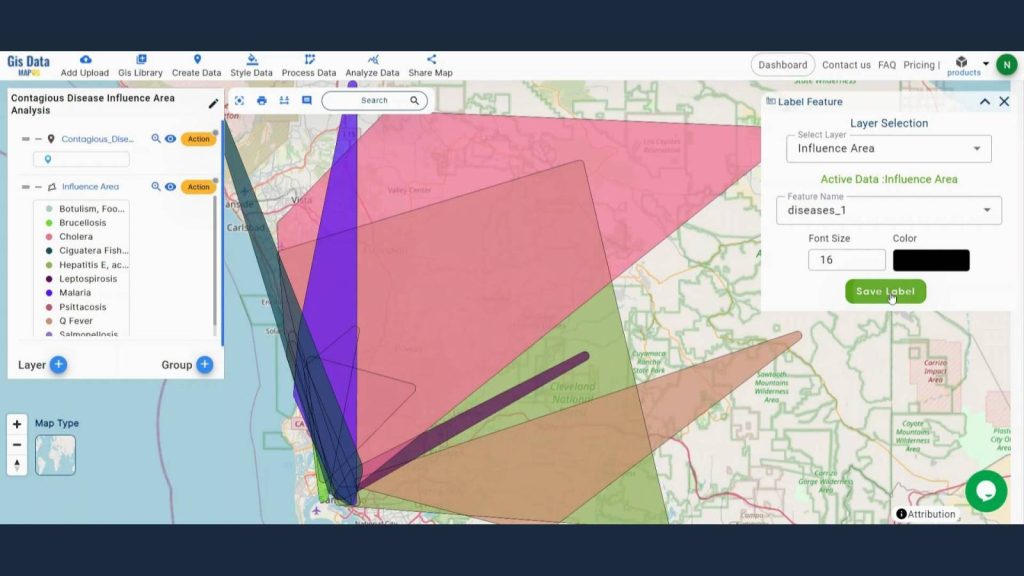
To take the whole thing to a new level by adding label feature in the influence area layer. Go to the action button of Influence Area layer and click on Label feature.
There provide the influence area layer and in the feature name section provide disease name attribute, select preferable font size and color the hir submit.
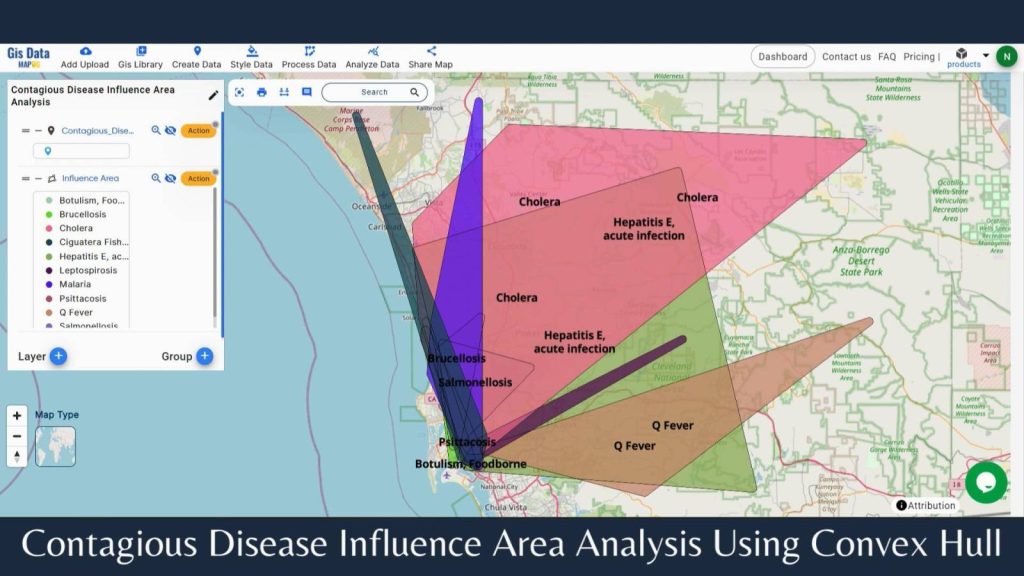
Step 4: Results & Analysis
We can see cholera and Hepatitis E has occupied most of the influence area. We’ve effectively mapped and visualized the influence area of the contagious disease, providing clear insights into its spread and potential impact.
Major Findings
1. Identified Hotspots: Using MAPOG’s convex hull tool, we pinpointed areas with the highest concentration of contagious disease cases, helping target critical zones for intervention.
2. Spread Patterns: The convex hull analysis revealed the spread pattern of the disease, showing how it extends geographically over time and identifying potential future risk areas.
3. Resource Allocation: By outlining the influence area, we optimized the allocation of medical resources and emergency response efforts, ensuring timely support to the most affected regions.
Domain and Industry
This map is a powerful tool for Public Health, Environmental Protection Agencies, Urban Planning, Transportation and Logistics and beyond.
Explore the effects of quarries on the environment by using the ‘Create Map for Pollution Impact Analysis around Quarries‘ Examine how the use of buffer and clip tools can help reveal the level of contamination and enable well-informed judgements regarding public health and conservation.
Conclusion
In conclusion, using MAPOG’s convex hull tool for contagious disease influence area analysis provides a clear and efficient way to visualize and manage outbreak zones. This method enhances public health responses by accurately defining and monitoring affected areas.
Here are some other blogs you might be interested in