Rivers are incredibly important for our world. They shape the land, help plants and animals survive, and give us things we need to live. It’s really important to know all about rivers so we can take care of them properly. “Create a Category Style Map – Mapping Rivers in different Colors”, In this article, we’ll talk about a cool new way to understand rivers better – it’s called category style analysis. This method helps us sort and see rivers based on their special features.
Key Concept to Mapping Rivers in different Colors
Category style analysis is a systematic way to understand and organise different aspects of natural resources like rivers. It helps us sort and understand them better. This method uses GIS data to study rivers and group them based on certain traits. In this article, we’ll explore how category style analysis can give us valuable insights into rivers.
At the end of this article, we’ll also provide a link where readers can access the data we used in our analysis. Additionally, we’ll share examples of how GIS analysis is used in various fields, such as urban planning, military operations, and real estate development. These examples include articles like “GIS Analysis in Urban Planning: Reshaping Transportation Future Insights of state/city,” “Creating Safe Routes for Armies and Rescue Teams,” and “Create Map for Real Estate Developer for Best Site Selection.”
MAPOG Map Analysis, a simple tool designed to simplify the creation and interpretation of Category Style analysis.
Utilizing Category Style for analyzing river diversity is a systematic approach, allowing us to categorize and visualize rivers based on their unique attributes. Let’s break down the process:
Step1: Add the GIS data of rivers into our analysis tool.
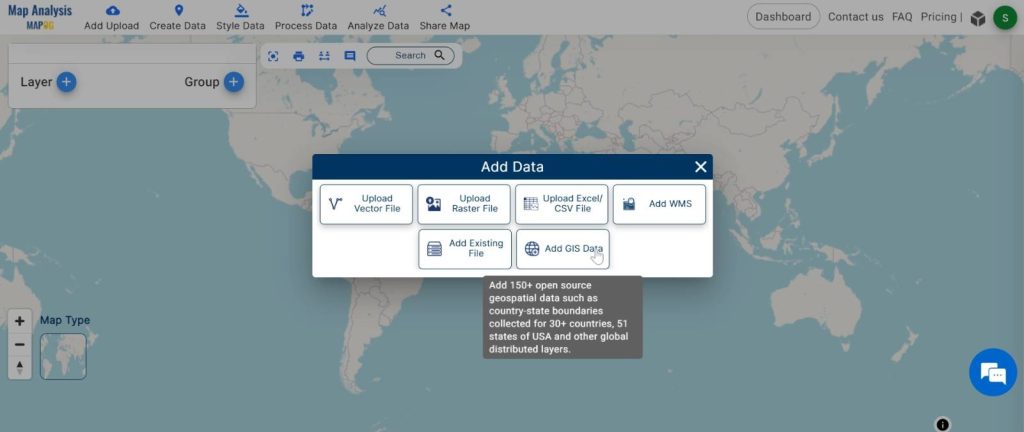
1.Click On the “Add Upload” button and choose the “Add GIS Data” option.
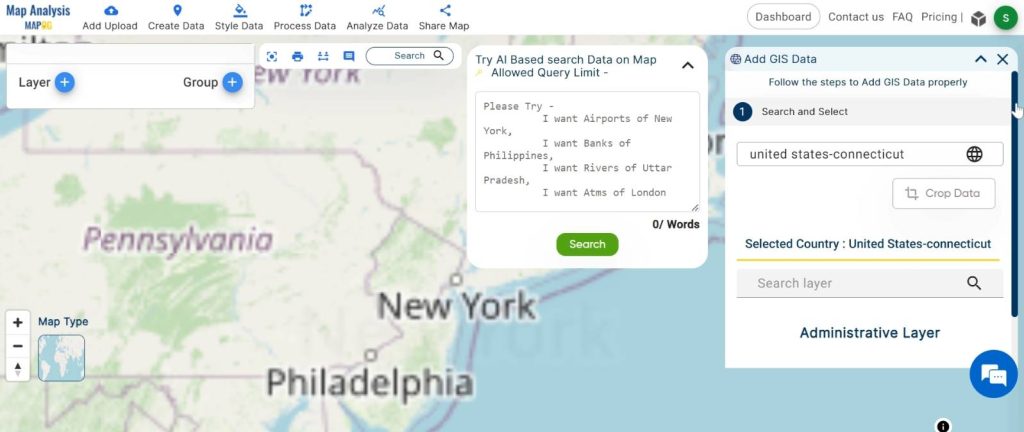
2.Search the country name
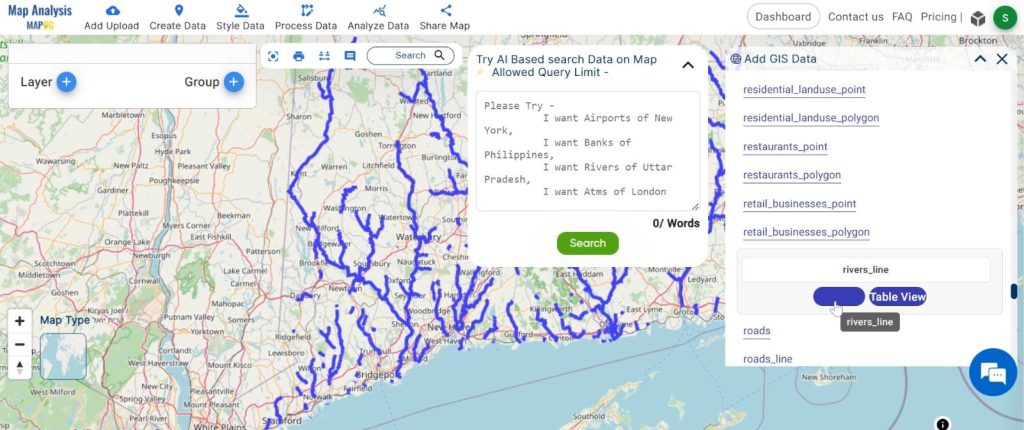
3.Add the River Data. Click on the “Add” Option.
Step 2: Name the untitled map and Rename the layer:
1.Here you have to name the untitled map
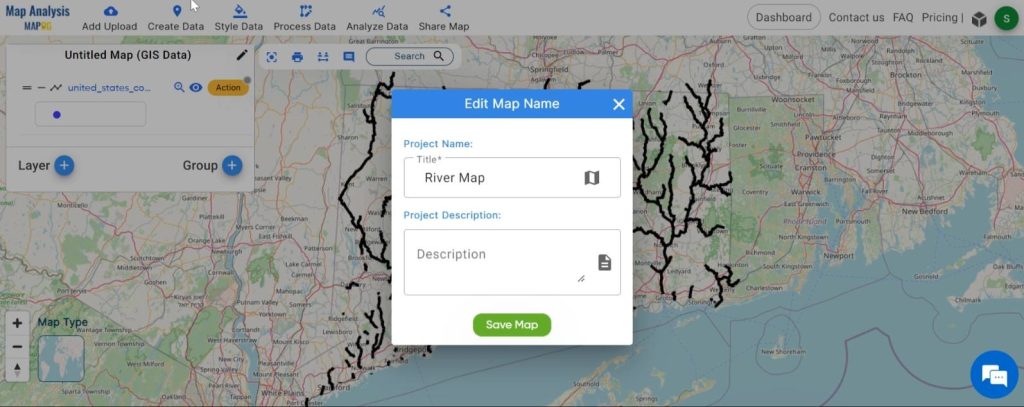
2.Rename the layer
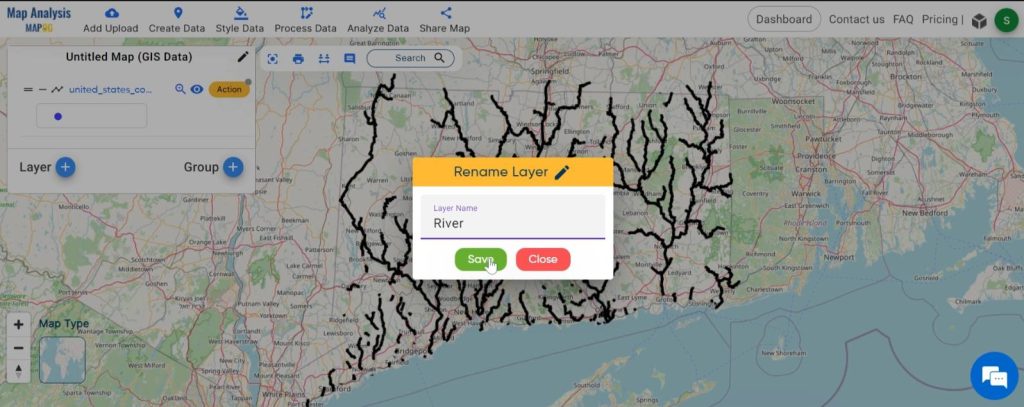
Step3: Employ category style to categorise them based on various attributes.
1.Click on the ‘Style Data‘ button and choose the “Category Style” option.
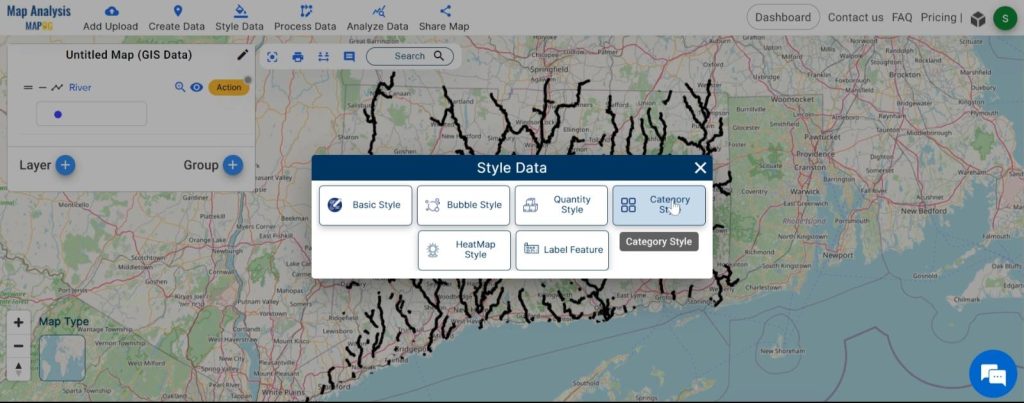
2.You can see the “Basic Style” Tool successfully opened on the right side of the screen.
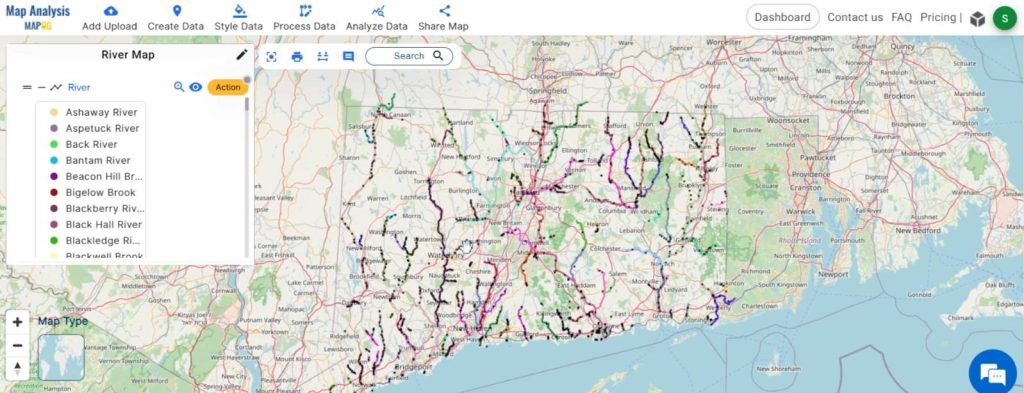
Here, select the layer. then change the colour and click on the “Save Style”.
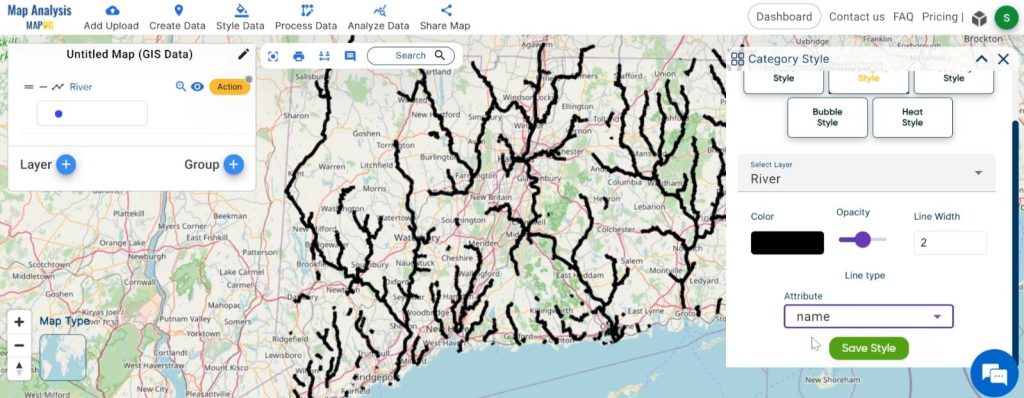
Step4: Share the map with the world.
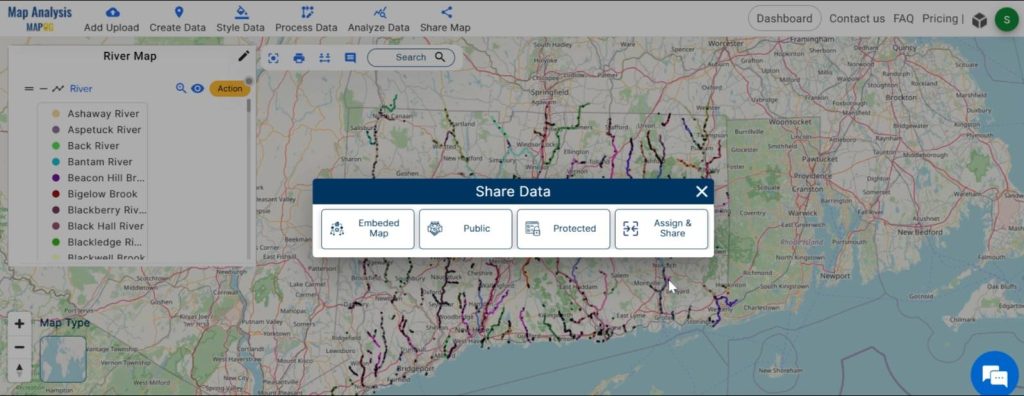
Major Findings:
Through the application of category style analysis, significant insights into the diversity of rivers have emerged:
- Rivers are categorized into distinct groups based on their characteristics, including slow-flowing, fast-flowing, meandering, braided, and more.
- The analysis highlights the ecological significance of slow-flowing rivers, which play a vital role in supporting diverse ecosystems and biodiversity hotspots.
- Understanding the category styles of rivers is instrumental in developing targeted conservation strategies to safeguard these critical ecosystems.
Domain and Industry:
This methodology finds application across environmental conservation, water resource management, urban planning, military operations, and real estate development, offering insights for effective decision-making and strategic planning.
In conclusion, category style analysis presents a valuable tool for understanding the complexity and diversity of rivers, facilitating informed conservation and management efforts. By harnessing this methodology, we can ensure the preservation of vital ecosystems and promote sustainable utilization of our natural resources, safeguarding the health and resilience of our planet for future generations.
Link of the Data:
Explore the data further through our GIS Data product, uncovering valuable information for in-depth analysis and understanding.
Exploring Our Previous Blogs:
- GIS Analysis in Urban Planning: Reshaping Transportation Future Insights of state/city
- Make Routes for Military Aerial Planning- Through Bearing angle and Distance calculation – Online Route Compass
- Create Map for Real Estate Developer for Best Site Selection
- Grid Mapping for Accurate Spatial Analysis: Divide and Conquer with GRID Map Tool