Farming faces big challenges when wars or natural disasters hit. Figuring out the damage to agricultural land is crucial. That’s where tools like MAPOG come in. This article is all about “Agricultural Land Damage Assessment due to War and Natural Calamities.” We’ll explore simple ways to understand and tackle the damage, using tools like MAPOG. Join us to discover how these tools help farmers and decision-makers make smart choices to protect our farms better.
Key Concept:
Assessing and managing agricultural land damage caused by war and natural calamities is a critical aspect of modern farming resilience. Utilizing advanced tools like MAPOG, we can efficiently analyze and understand the extent of damage, empowering stakeholders to make informed decisions for effective recovery and sustainable agricultural management. This key concept revolves around the practical application of technology to navigate challenges and safeguard the future of farming communities in the face of adversities.
Step-by-Step Process for Agricultural Land Damage Assessment
Step 1: Access MAPOG Tool: Start by logging into the MAPOG platform, your dedicated solution for agricultural land damage assessment. Ensure you have the necessary credentials to access the tool and begin the assessment process.
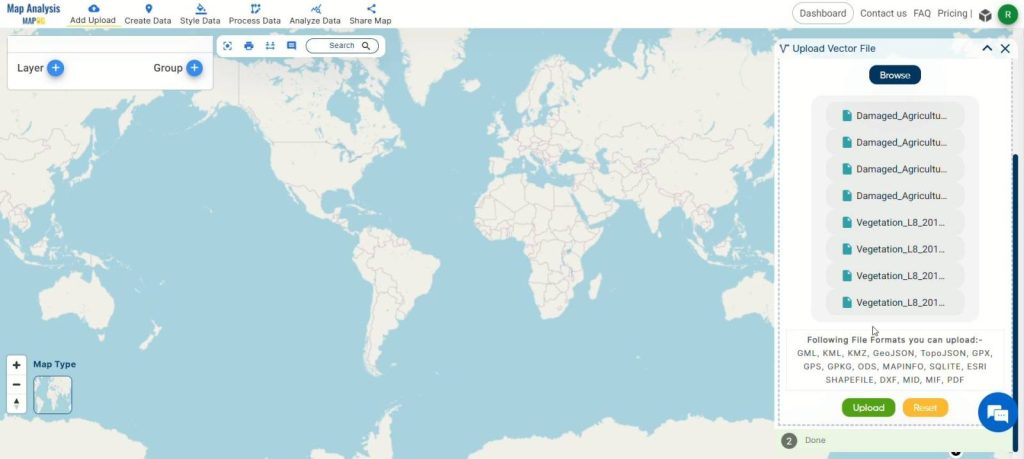
Step 2: Upload Agricultural Data: Within the MAPOG interface, navigate to the analysis tool and click on “Add Upload.” Opt for “Upload Vector File” to input specific agricultural data relevant to the affected area.
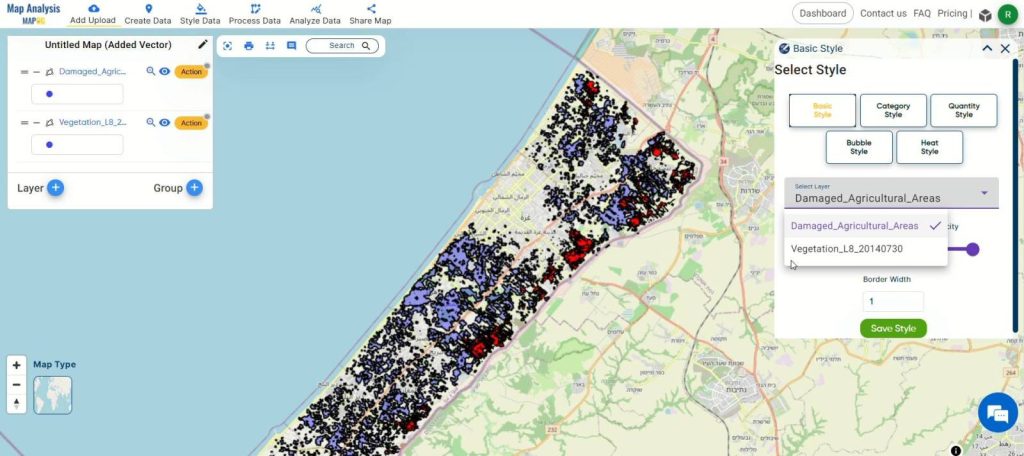
Step 3: Fine-Tune Visual Presentation: Customize the visual style of your datasets by clicking the action button and selecting “Edit Style.” This step allows you to tailor the presentation for better clarity and understanding of the assessment results.
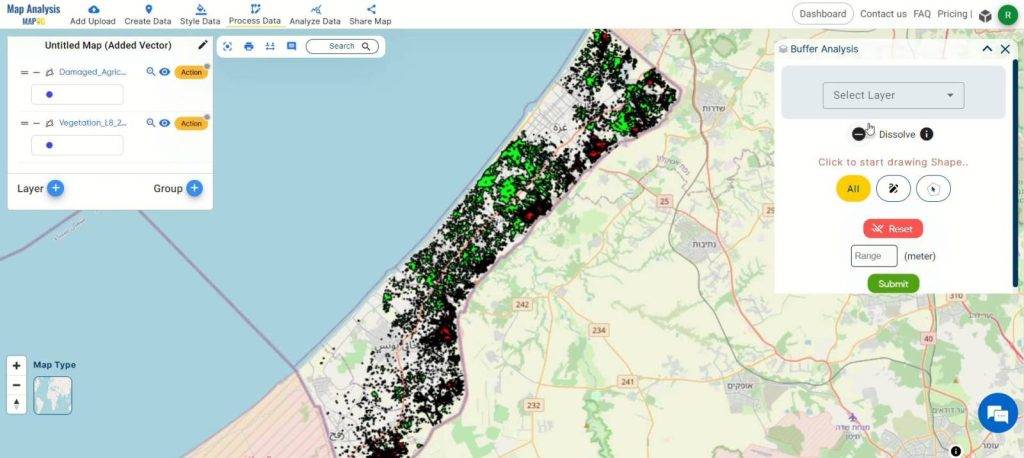
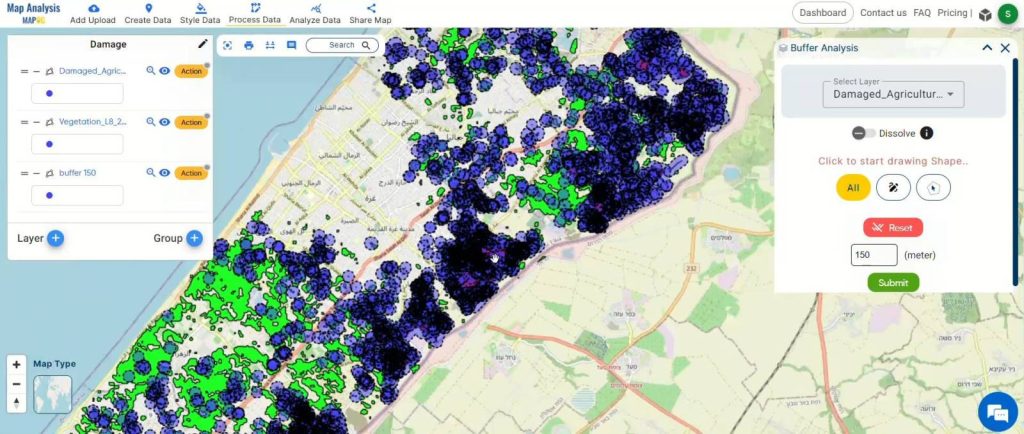
Step 4: Create Buffer Zones: Proceed to create buffer zones around the identified damaged areas layer. Establish buffers at various distances, such as 30, 150, and 300 meters, to gain deeper insights into the spatial relationships and patterns within the agricultural landscape.
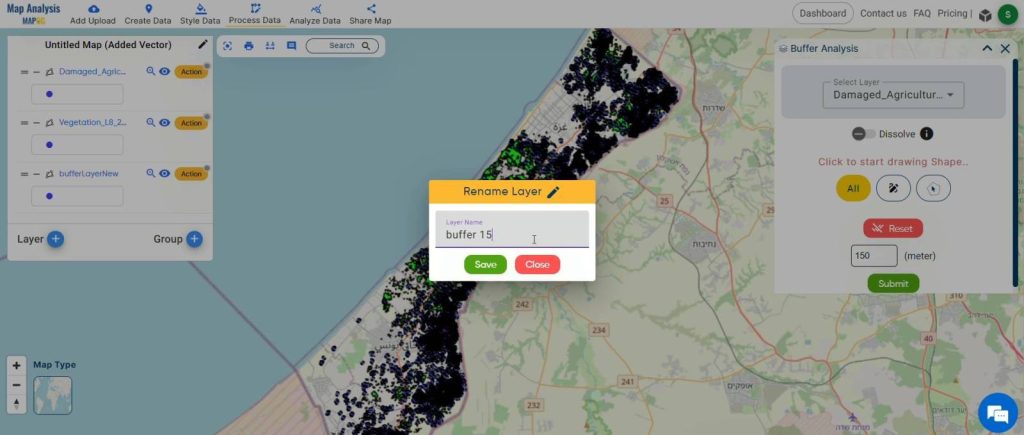
Step 5: Rename Layer: Rename your layer by clicking the action button, then select the pencil icon to edit the layer name.
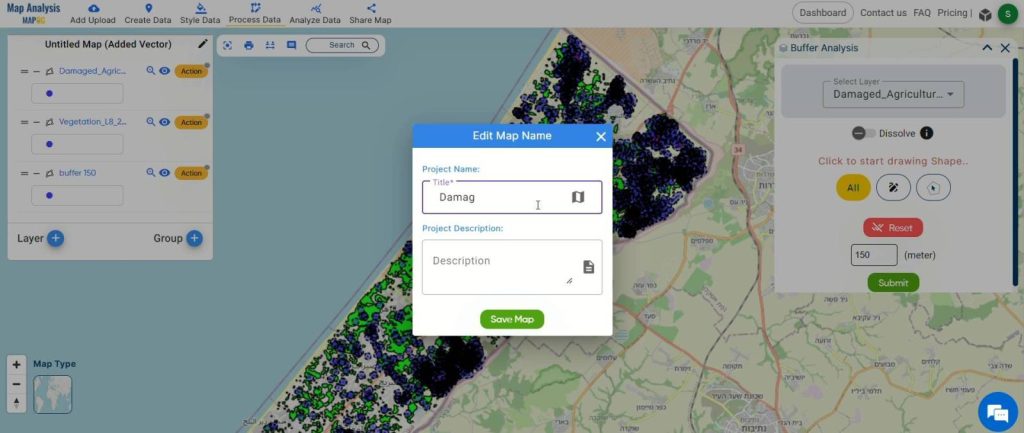
Step 6: Rename and Save the Project
To organize your project efficiently, rename the map by clicking the pencil icon in the top right corner of the left-hand side box. Enter a suitable name for the map and then select “Save Map” to apply the changes.
Step 7: Fine-Tune Visual Presentation of buffer: Customize the visual style of your buffer by clicking the action button and selecting “Edit Style.” This step allows you to tailor the presentation for better clarity and understanding of the assessment results.
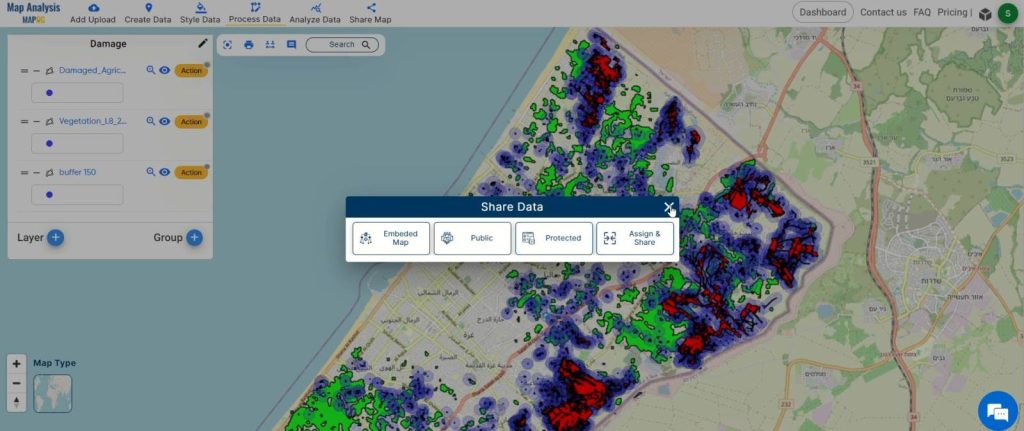
Step 8: Sharing the map :To share the map, click on the Share Map.
Major Findings in Agricultural Land Damage Assessment
- Identification of Affected Areas: Through the use of MAPOG‘s analysis tool, damaged areas resulting from war and natural calamities were accurately identified. This provides a foundational understanding of the scope and magnitude of the agricultural land damage.
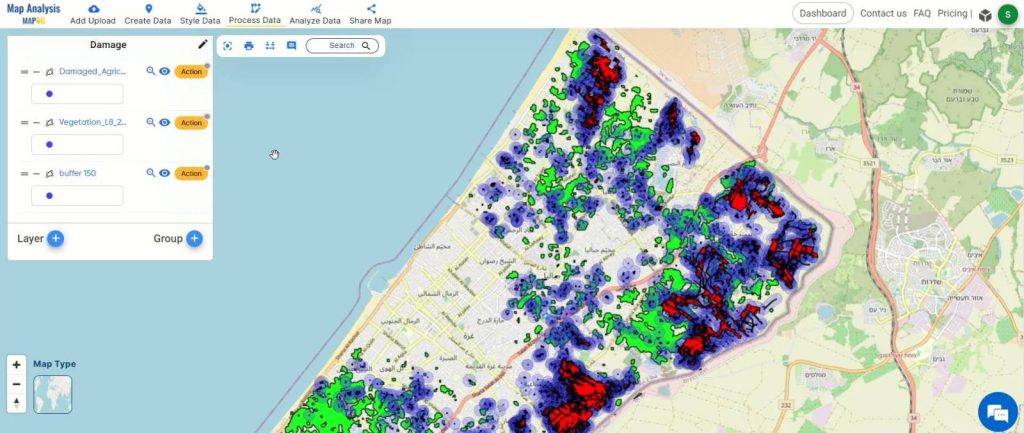
- Buffer Zone Insights: The creation of buffer zones at varying distances (30, 150, and 300 meters) around the damaged areas revealed spatial relationships and patterns within the agricultural landscape. This allowed for a more nuanced analysis of the affected regions.
- Visual Presentation Customization: The fine-tuning of the visual style of the buffer zones played a crucial role in enhancing the clarity of the assessment results.
- Pinpointing Potential Damage: The buffer analysis facilitated the identification of potential areas likely to be affected by agricultural land damage. This step provided insights into the overall extent of the damage, assisting in prioritizing recovery efforts and resources.
These major findings highlight the effectiveness of MAPOG in providing actionable insights for agricultural land damage assessment. The combination of accurate identification, spatial analysis, visual customization, and collaborative features positions MAPOG as a valuable tool in managing the complexities of agricultural challenges arising from war and natural calamities.
Domains and Industries Benefiting
- Agriculture and Farming
- Government and Policy Planning
- Environmental Conservation
- Insurance and Risk Management
- Research and Academia
- Emergency Response and Humanitarian Aid
- Technology and Geospatial Analysis
- Supply Chain and Agribusiness
- NGOs and Non-Profit Organizations
Conclusion
In summary, MAPOG is a crucial tool for assessing agricultural land damage post-war and natural disasters. With its user-friendly features for identifying damaged areas and enabling collaborative decision-making, MAPOG goes beyond agriculture, contributing to various sectors like government planning and environmental conservation. For inquiries, contact us at support@mapog.com, as we continue to innovate and contribute to the resilience of agricultural landscapes and beyond.
Other Articles
- Protecting Wetlands: Guide to Create GIS Map for Nature
- GIS Analysis in Urban Planning: Reshaping Transportation Future Insights of state/city
- Fast Emergency Response: Using GIS and Isochrone Maps for 10-Minute Ambulance Arrival
- Mapping Tiger Attack Hotspots – Create an Online Map and Share
- Make Routes for Military Aerial Planning- Through Bearing angle and Distance calculation – Online Route Compass
- Mapping Healthcare Efficiency: GIS Buffer Analysis of Hospital Locations
- Add WMS- Two step online view of WMS layer on a map
- Plot ATM locations on a map and embed on your website
- Map habitat locations of endangered animals & keep track of their living
- Create Map on Literacy Rate
- Create Map – DIGITIZING SOLAR, HYDROELECTRIC, WIND AND BIOMASS POWER PLANTS – RENEWABLE ENERGY
- Create a Map to find suitable sites for constructing a new house
- Create Map for Analyzing Water Quality using Heat Map Style
- Create Map – School Map Area Coverage Through Buffer Analysis
- Mapping Safety Create GIS Map : Game-Changing Approach to Hospital Risk Analysis