In recent years, electric vehicles have increasingly gained significant traction owing to their environmental benefits and advancements in battery technology. Nonetheless, electric vehicle owners increasingly encounter challenges regarding the accessibility of charging stations. To tackle this issue, this article, “Creating a Map for Electric Vehicle Charging Stations,” focuses on implementing mini charging stations for electric vehicles utilizing Geographic Information System (GIS) technology through the MAPOG platform.
For more information on Urban planning, check out our article ‘GIS Analysis in Urban Planning: Reshaping Transportation Future Insights of state/city‘.
Key Concept for Electric Vehicles Charging Stations
Electric vehicle charging stations are increasingly being meticulously mapped using advanced tools like buffer analysis and proximity analysis, harnessing the power of MAPOG. Moreover, by identifying electric towers within a 100-meter radius from roads, MAPOG facilitates the optimal placement of charging stations, ensuring accessibility and convenience for electric vehicle owners. Links of the GIS data are given at the end of this article. The application of MAPOG in habitat mapping and wetland mapping is so wide.
Steps for Finding Electric Vehicle Charging Stations
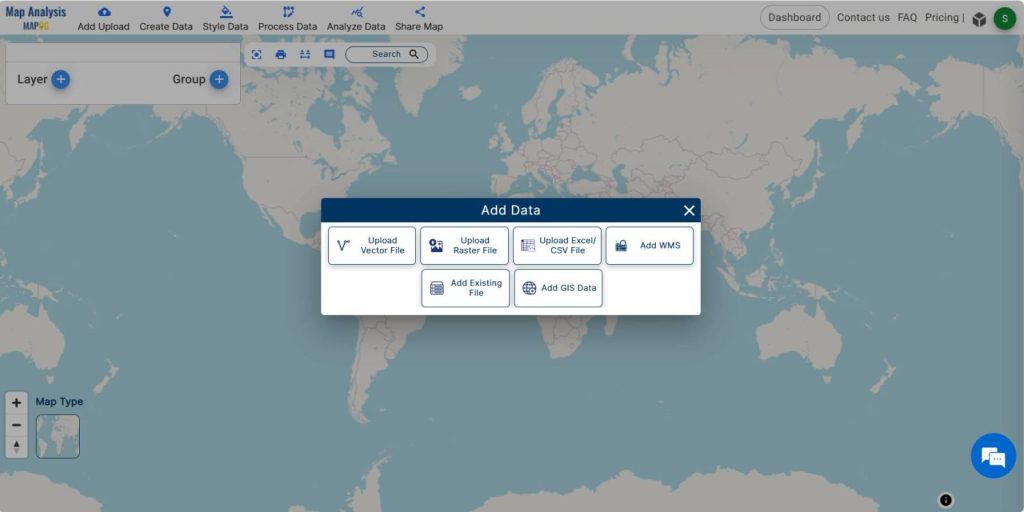
Step-1 Upload the data
To navigate to the MAPOG Map analysis interface, increasingly utilize more and more transition words. Click on the Add Upload option from the menu bar located at the upper left end, and then proceed to the Add GIS Data option to add the required data.
By utilizing the AI search option or manually selecting, increasingly more individuals are choosing the area of study. Subsequently, they scroll down to locate the powerline tower data and road data. Finally, they add the data to the platform by clicking on the Add button.
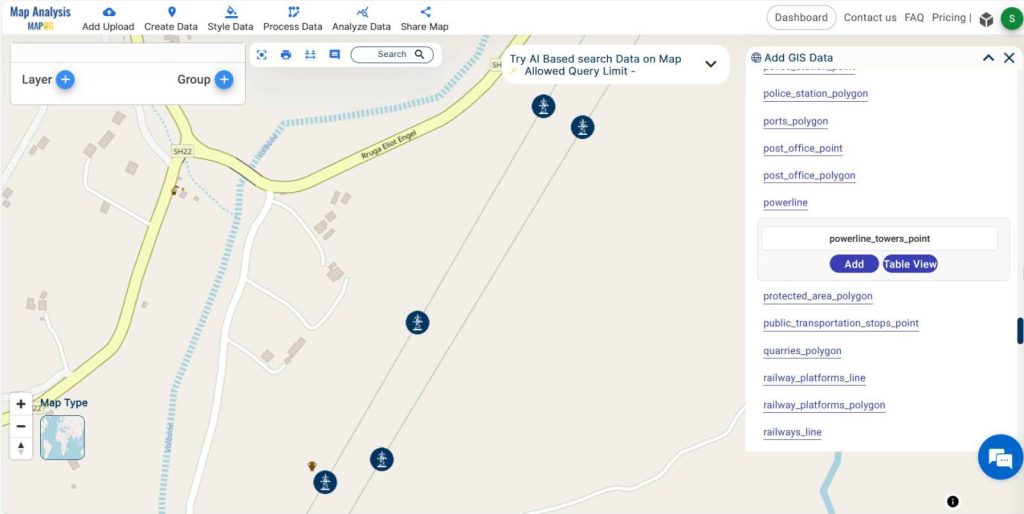
Then add the data to the platform by clicking on the Add button.
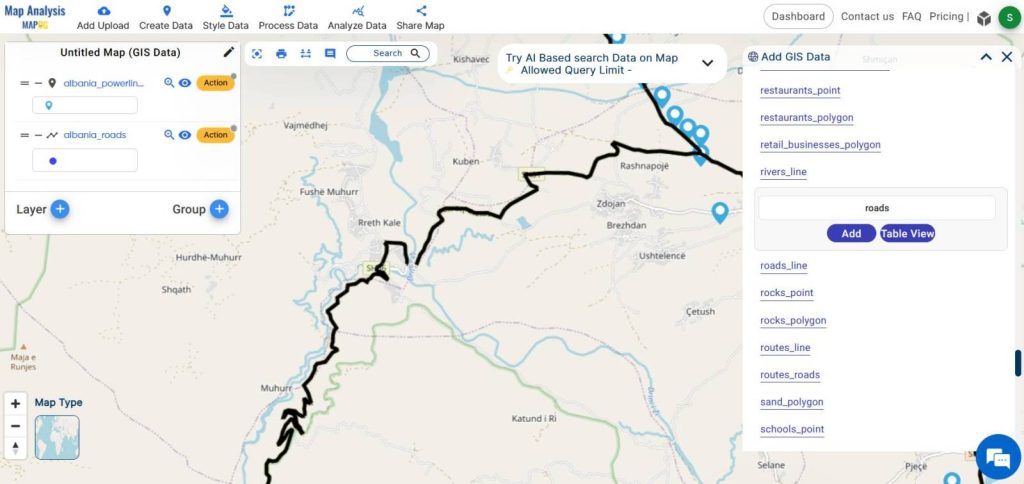
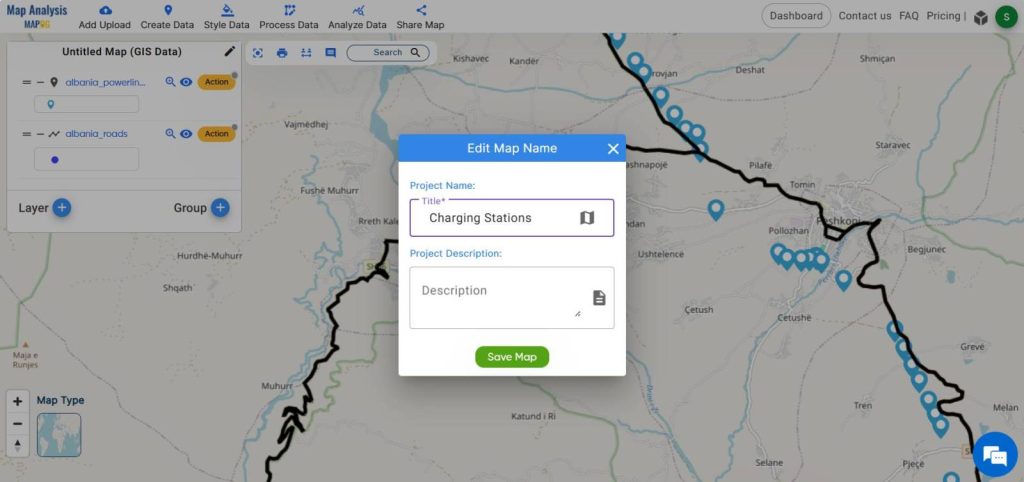
Step-2 Project Title
Successfully adding GIS data, we proceed to rename the untitled project and provide a project description in the description box.
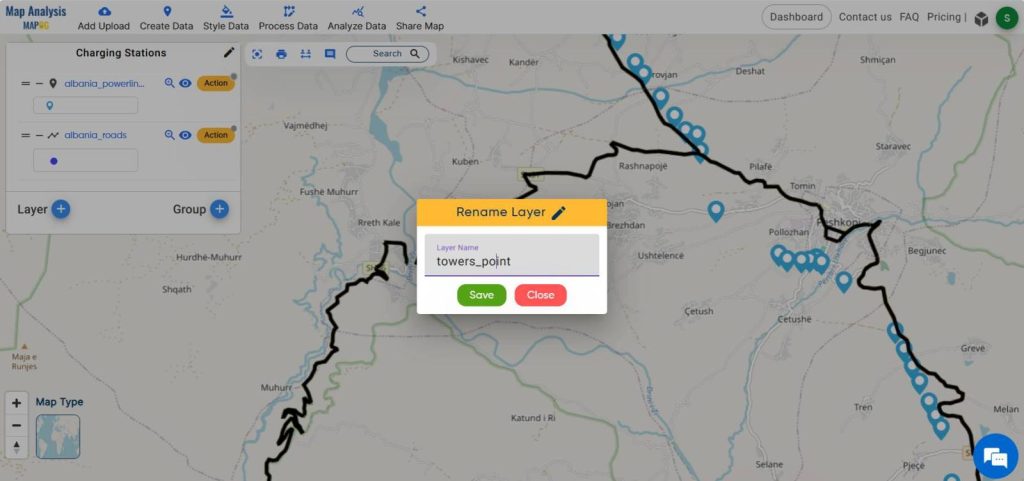
Step-3 Rename the layers
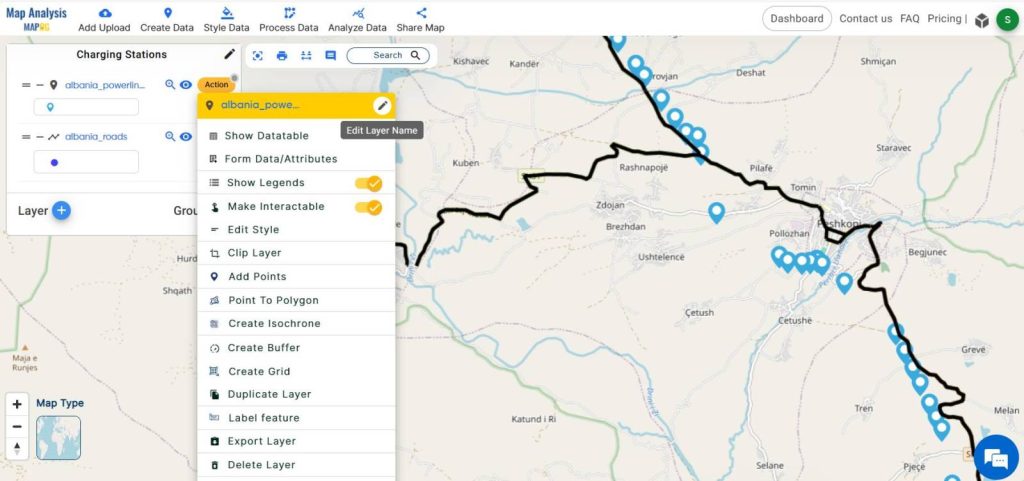
Activating each data layer, associate the action button with it and rename every layer for improved comprehension.
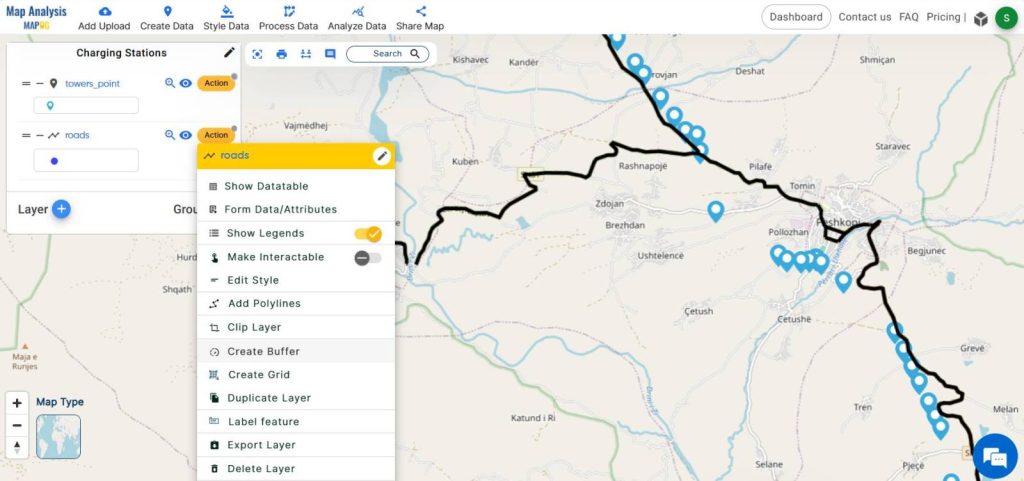
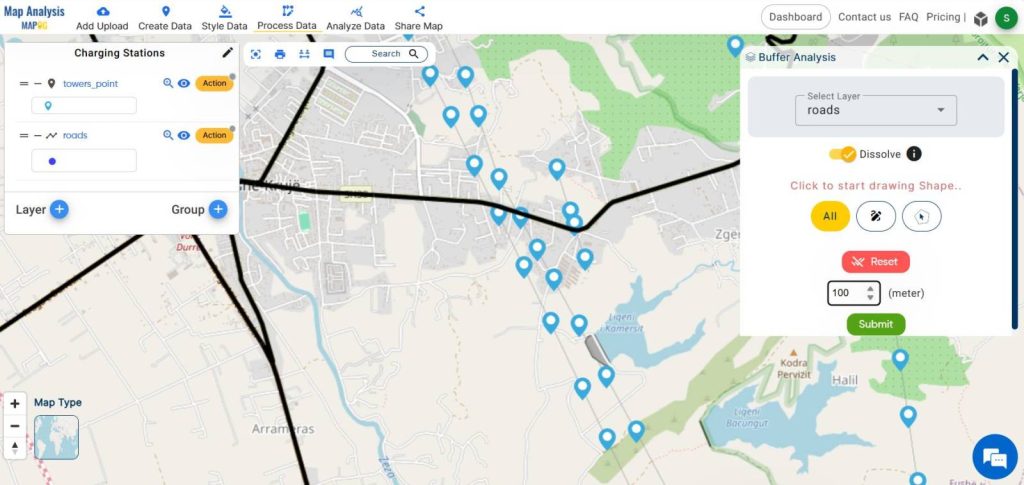
Step-5 Buffer Analysis
To create a buffer zone of 100 meters around the road data, click on the action button in the road data layer, allowing for seamless mapping and analysis.
To achieve better results, select the Create buffer option and activate the dissolve option. Afterward, set a range of 100 meters and click Submit. By following these steps, you can optimize the buffer creation process.
Furthermore, various studies increasingly emphasize the benefits of buffering in protecting wetlands and mapping healthcare efficiencies.
Step-6 Proximity Analysis
We proceed by identifying the powerline towers within this buffer area. To do so, navigate to the Analysis data menu and open the proximity analysis window.
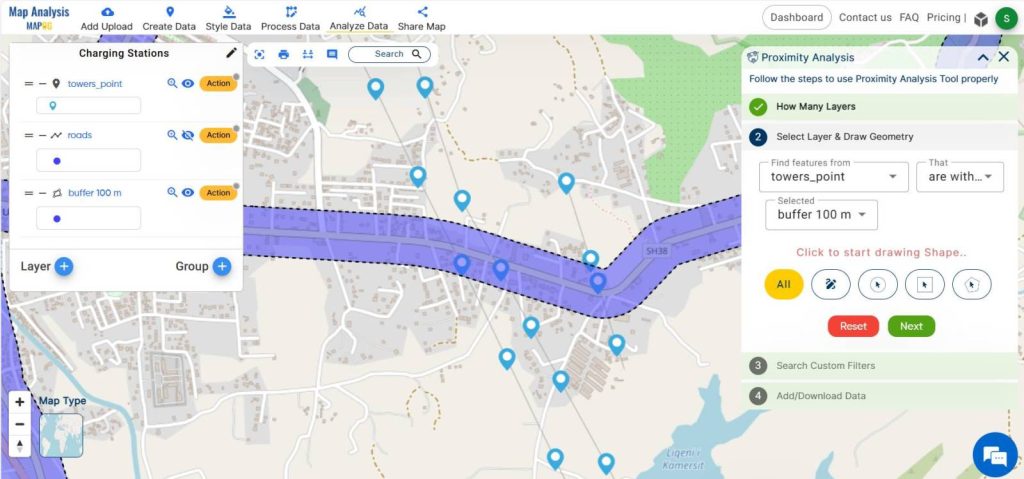
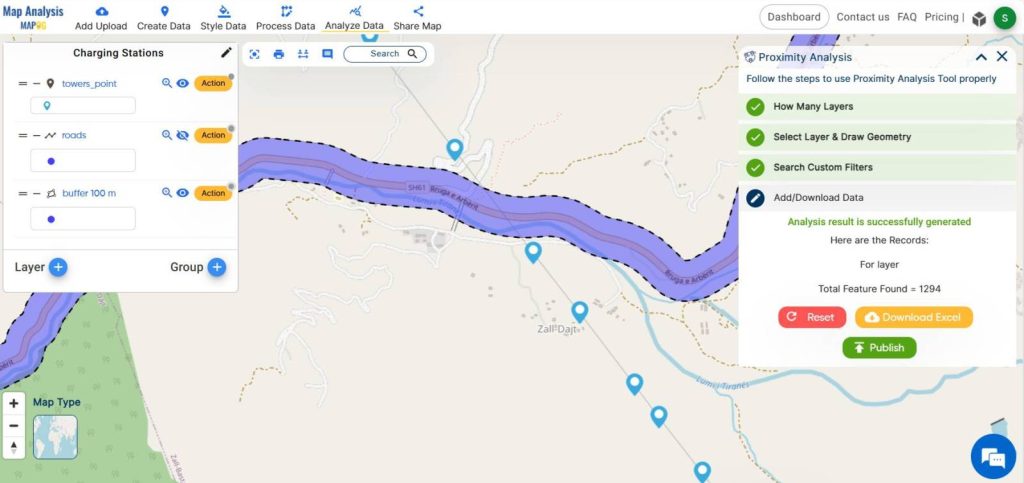
Begin by selecting two layer options for analysis as we have 2 layers to consider. Next, choose the options to locate the powerline towers within the buffer area. Then, proceed to submit the data. The result will display the number of towers within the buffer area.
Several articles have also harnessed the power of proximity analysis tools, showcasing their versatility across various domains, from Urban Planning: Reshaping Transportation Future Insights of state/city.
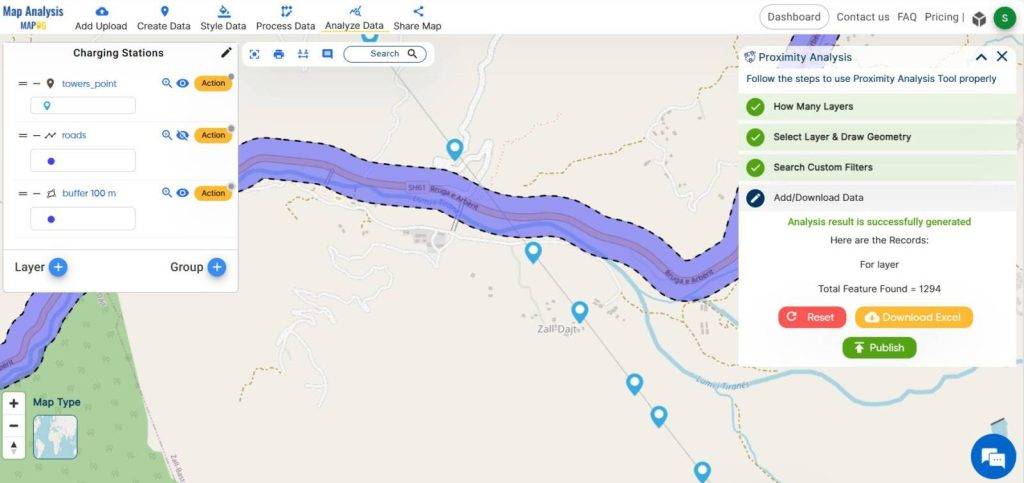
Step-7 Publish the data and Download Excel file
Click on the Publish option to visualize these towers. Rename the data layer as “charging station” for better understanding and hide all other layers. Additionally, download the excel file to obtain more details about these towers.
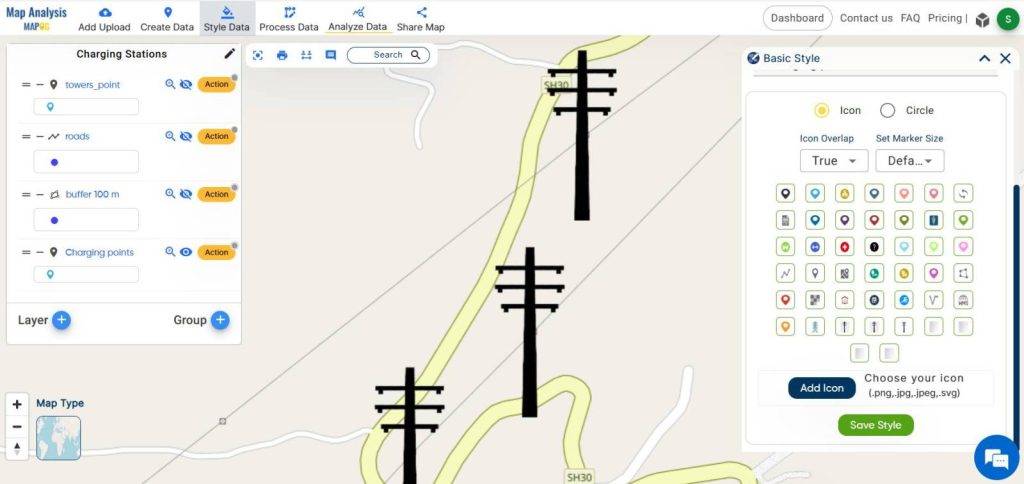
Step-8 Add Icon
Clicking on the “charging Point” data layer allows us to change the icon style by choosing the basic style option. Additionally, as we make these adjustments, we can enhance the visual representation of the charging points on the map.
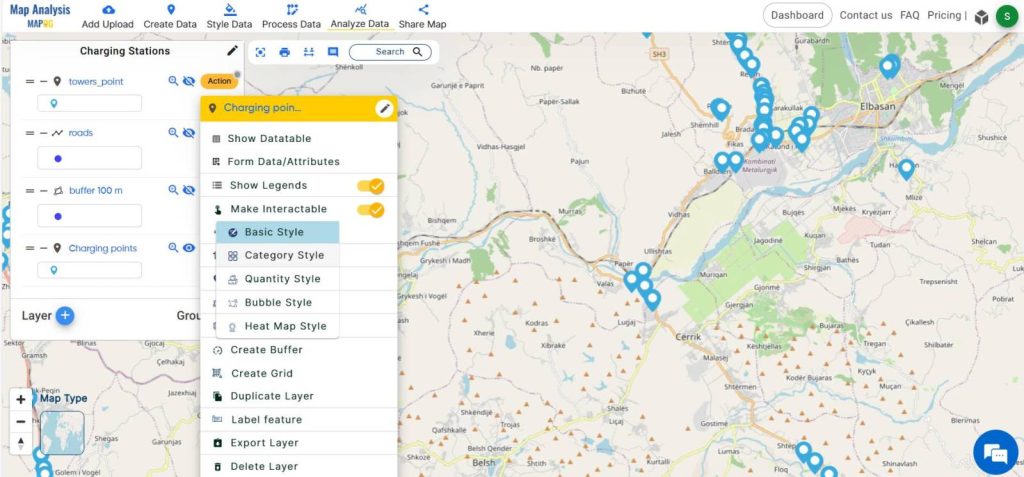
In case the icons for our needs are unavailable, we can import icons from our system files, thereby ensuring we have the necessary resources at our disposal.
Additionally, you can proceed by initiating the process through clicking on the add icon option, followed by selecting the file from our system and uploading it.
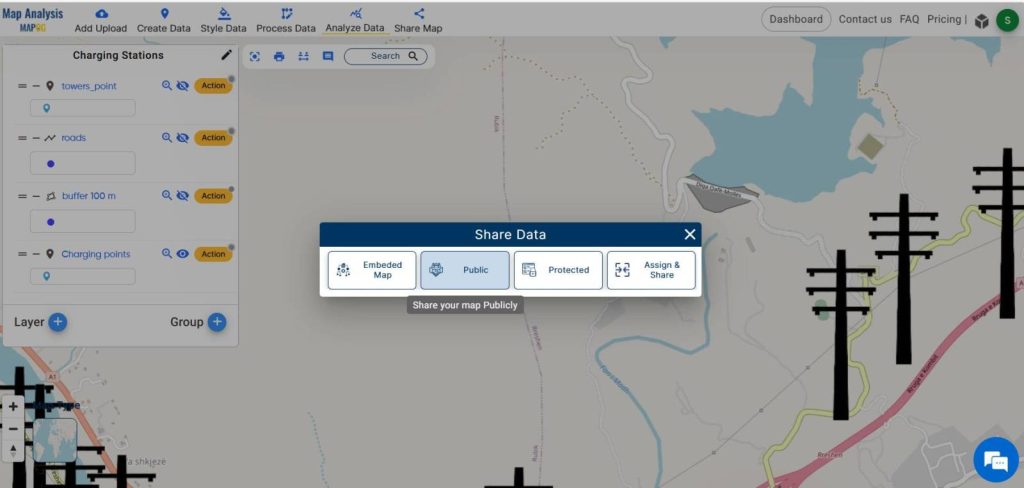
Step-9 Share Your Map
Utilize the share data menu to actively distribute this map to the public.
Findings
- Enhanced Accessibility
- Efficient Proximity Analysis
- Optimal Charging Station Placement
Domain and Industry
Incorporating MAPOG to map electric vehicle charging stations is part of transportation infrastructure development. Transitioning to a greener and more efficient transportation system, MAPOG‘s GIS platform acts as a valuable tool for transportation authorities and stakeholders. It facilitates the effective mapping and implementation of charging infrastructure, enabling the gradual transition to a sustainable future.
Conclusion
MAPOG‘s utilization in mapping electric vehicle charging stations marks a pivotal advancement in transportation infrastructure planning. Additionally, as we strive towards a more sustainable future, integrating innovative solutions like MAPOG becomes instrumental. This ensures the shaping of transportation systems that are not only efficient but also environmentally friendly.
GIS Data Links
Powerline Tower Data- https://mapanalysis.mapog.com/map-analysis/add-gis/powerline_towers_point
Road Data– https://mapanalysis.mapog.com/map-analysis/add-gis/roads