In the realm of natural resource management, “Create A Map For Forest- Water Management: GIS in Water Impacts” understanding the intricate relationship between forests and water bodies is paramount for making informed decisions towards sustainability. Leveraging MAPOG Map Analysis provides a powerful toolkit to unravel these complexities, offering insights that aid in better Water Management. In this article, we delve into how GIS analysis can accurately assess the impact of water bodies on forests, facilitating targeted actions for conservation and sustainable resource utilization.

Key Concept for Creating Water Impact Maps for Forestry Management
Our article is centred on using GIS technology to develop maps highlighting the relationship between water bodies and forests. By integrating data on forest boundaries and water locations, we can identify areas within the forest that are significantly influenced by nearby water sources. We’re dedicated to ensuring our findings are easily accessible, which is why we’ll include the data link at the end of the article. Moreover, we draw inspiration from recent articles like “GIS Analysis in Urban Planning: Reshaping Transportation Future Insights of state/city” and “Make Routes for Military Aerial Planning- Through Bearing angle and Distance calculation – Online Route Compass“, emphasizing the broad applicability of GIS across diverse fields beyond forestry management.
Unlocking the potential of GIS analysis for understanding the impact of water bodies on forests is a straightforward process that empowers natural resource managers and conservationists.
Let’s walk through a step-by-step example of how we can analyze this interaction:
Step 1: Data Gathering:
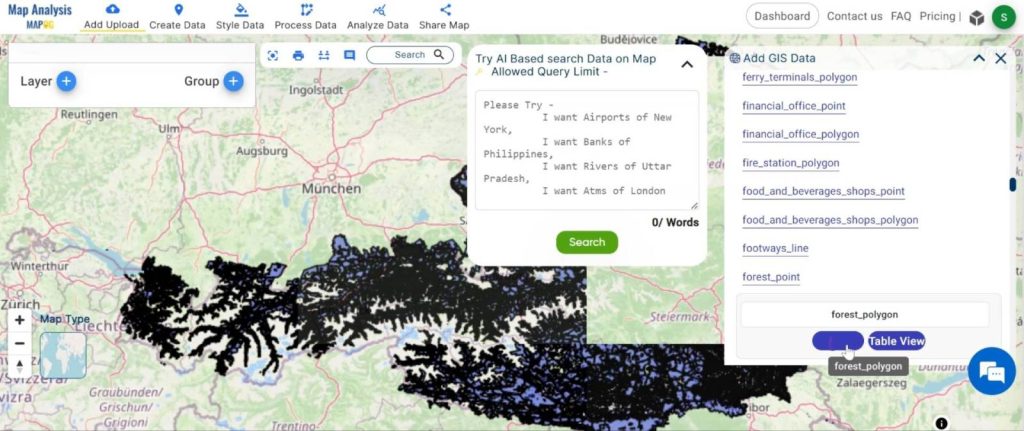
Begin by collecting relevant data, including forest polygon data delineating forested areas and water land point data marking the locations of water bodies.
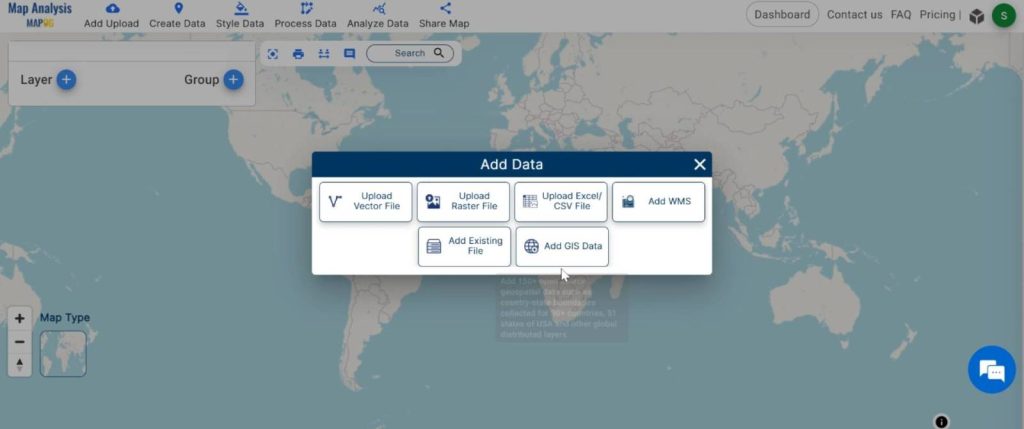
1.Click On the “Add Upload” button and choose “Add GIS Data” option.
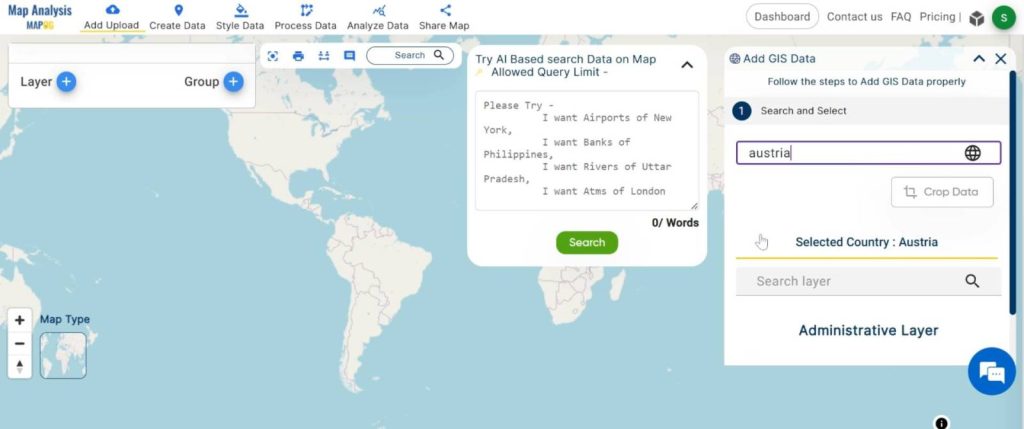
2.Search the country name
3. Add the Forest and Water Body Data. Click on the “Add” Option.
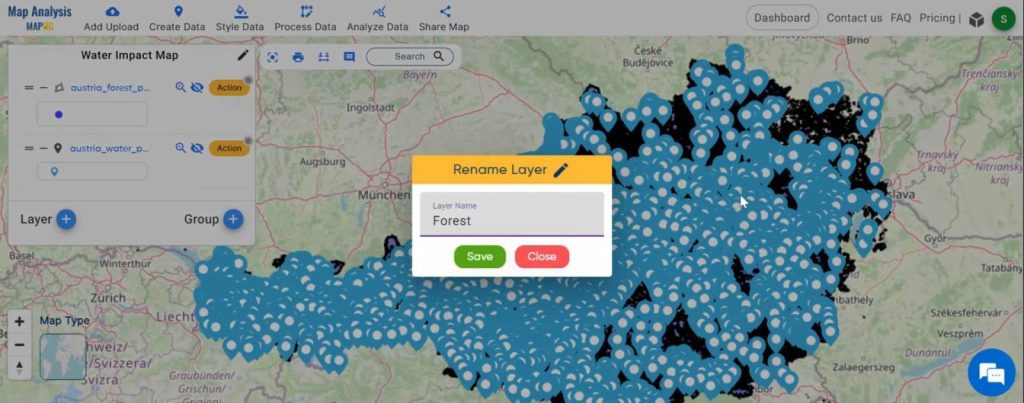
Step 2: Name the untitled map and Rename the layer:
Here you have to name the untitled map
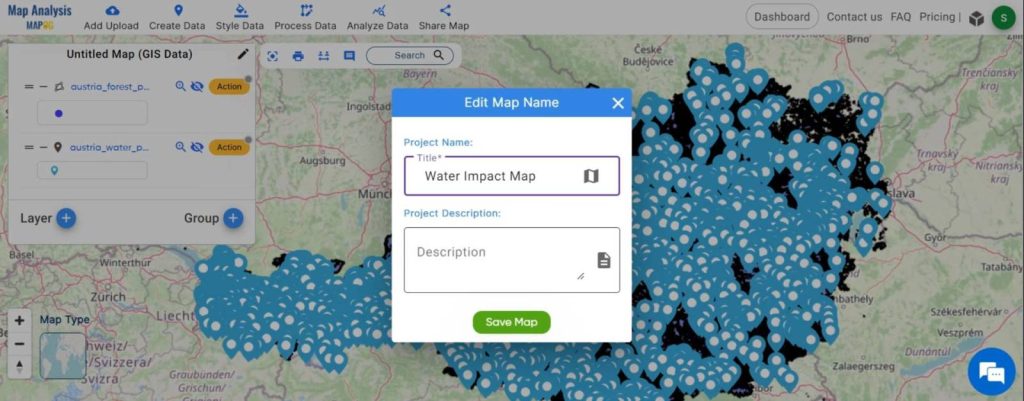
Rename the layer
Step 3: Data Integration:
Import the collected forest and water data into GIS software, ensuring that the layers are compatible and properly aligned spatially.
1.Click on the ‘Style Data‘ button and choose the “Basic Style” option.
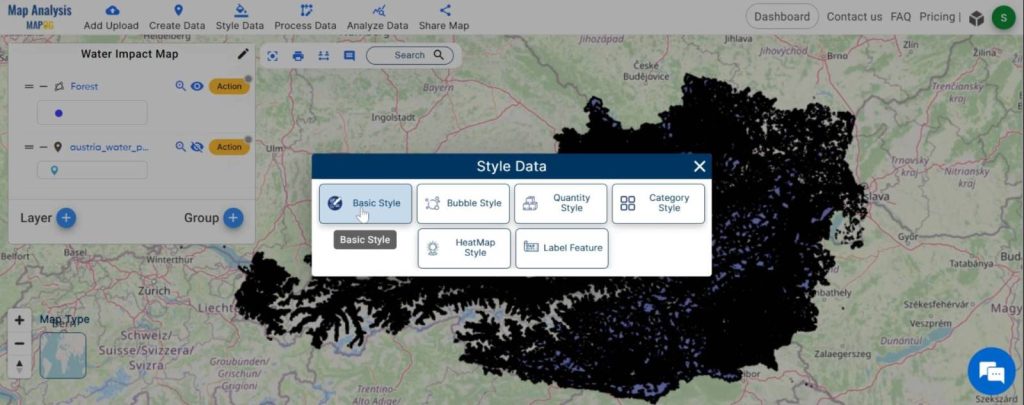
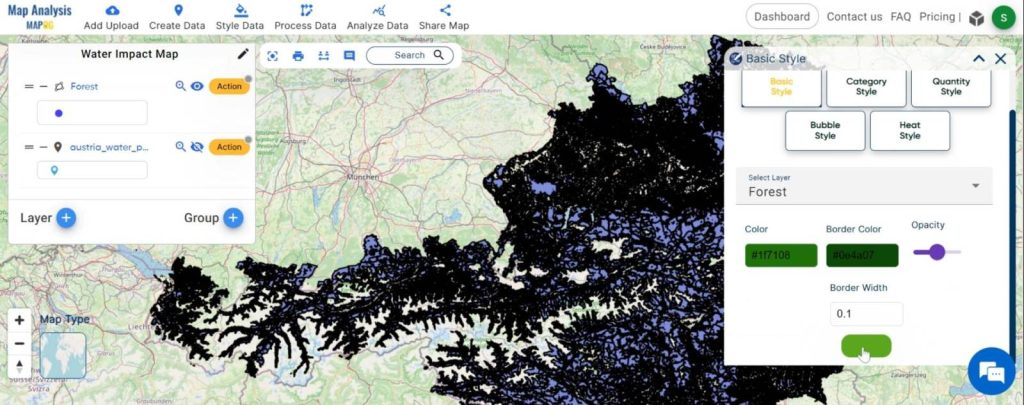
2.You can see the “Basic Style” Tool successfully opened on the right side of the screen.
Here, select the layer. then change the colour and click on the “Save Style”.
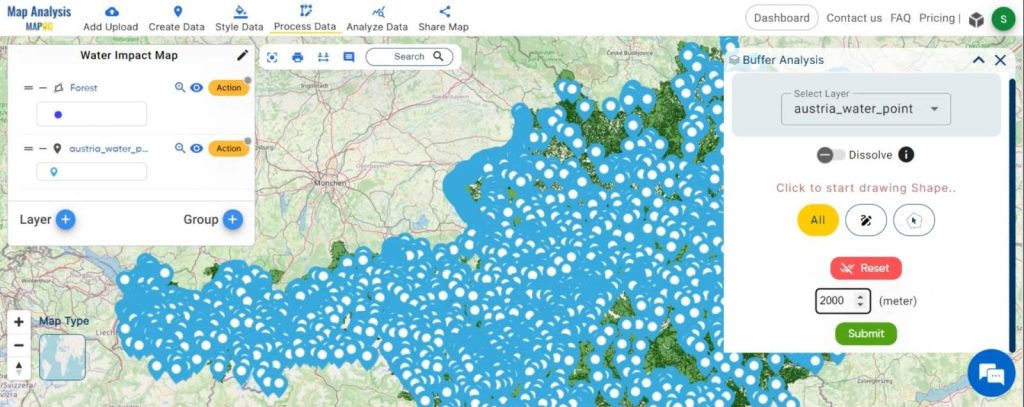
Step 4: Buffer Creation:
Employ GIS techniques to create buffer zones around the water land points, typically extending to a certain distance (e.g., 2000 meters) into the forest. These buffers represent areas where water influence is likely to be significant.
1.Click on the “Process Data” tool. And choose “Buffer tool”.
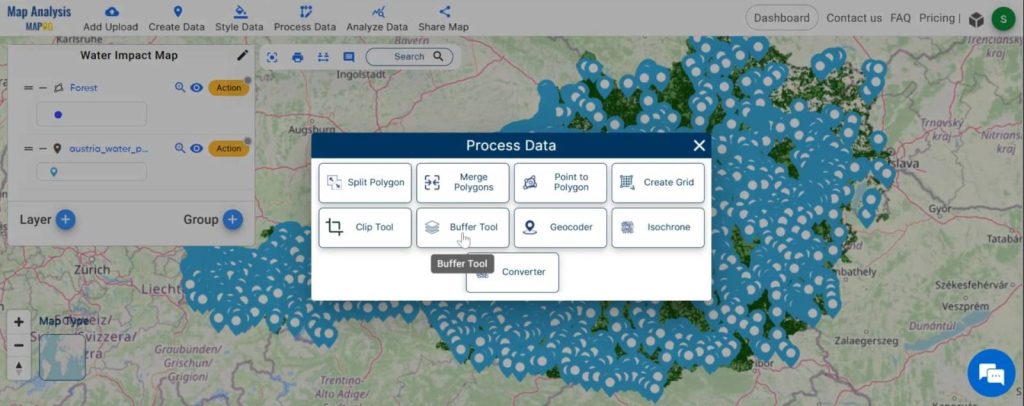
2.Here select the Layer and set the buffer range 2000 meter. Then click on the “Submit” button.
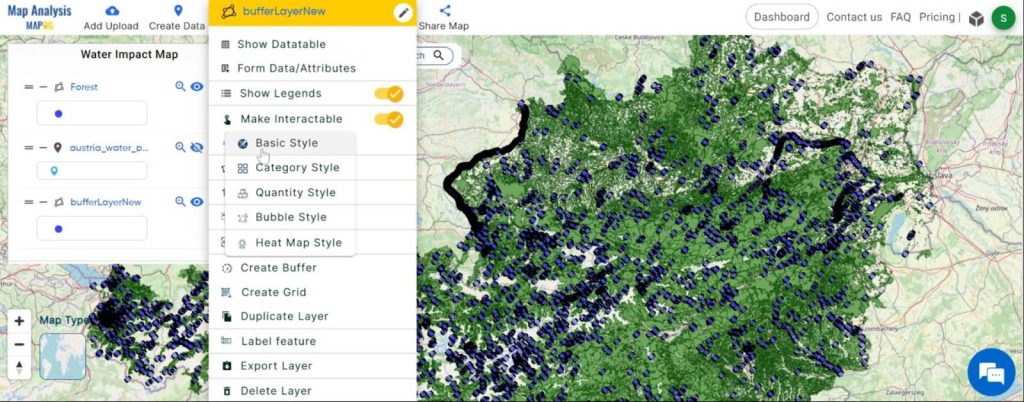
Step 5: Style the Buffer:
Styling the buffer zone to visually distinguish it from the forest polygons enhances clarity and comprehension of the water-forest interaction.
1. Click on the “Action” button and choose the “Basic Style” option.
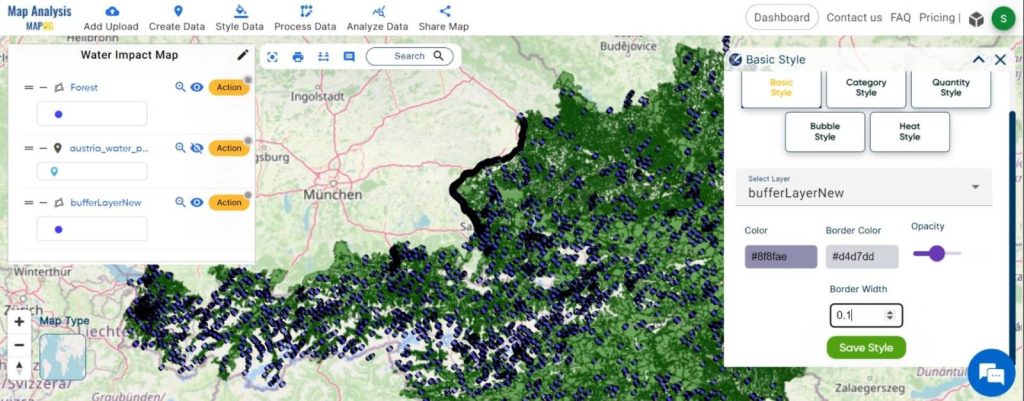
2.You can see the “Basic Style” Tool successfully opened on the right side of the screen.
Here, change the colour and click on the “Save Style”.
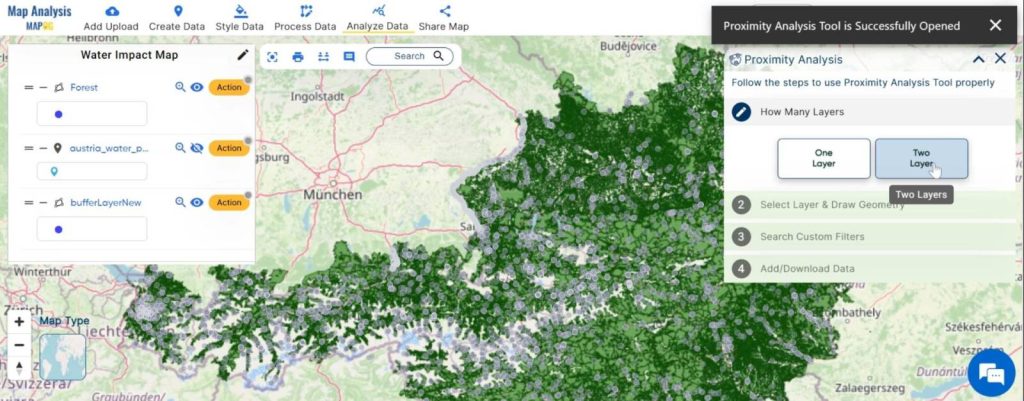
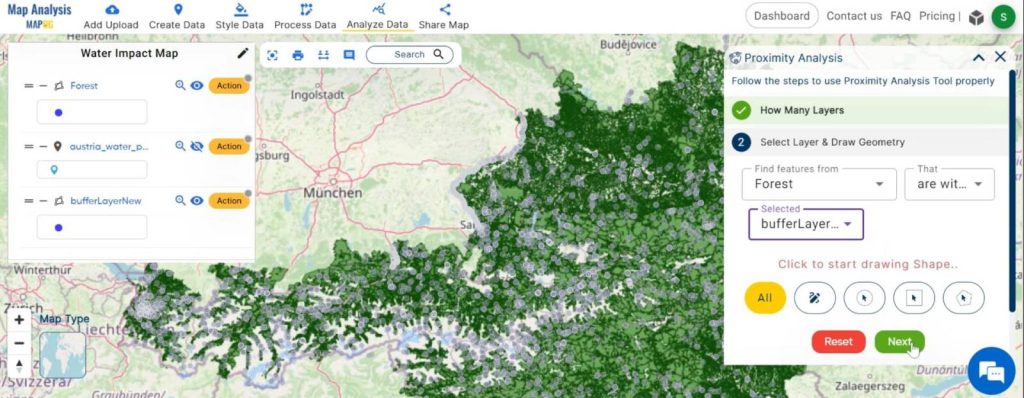
Step 6: Proximity Analysis:
Perform proximity analysis using GIS tools to identify forest areas that fall within the buffer zones. This analysis highlights regions within the forest that are most influenced by nearby water bodies.
1.Click on the “Analyze Data” button and choose “Two Layer”.
2.Here, select the finding feature and selected layer and click on the “Next” button.
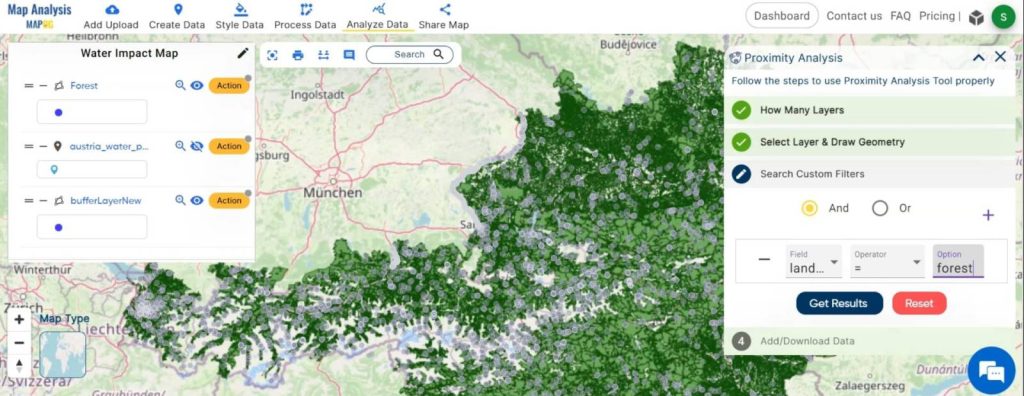
3.Choose the field and write the option and click on the “Get Result” option.
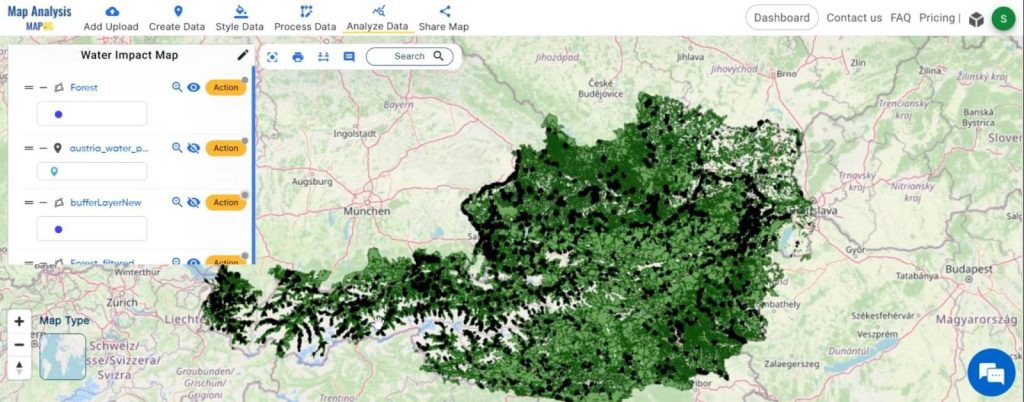
Step 7: Result Interpretation:
Review the analysis results to understand which forest areas are most affected by water bodies. This step involves interpreting spatial patterns and identifying water impact within the forest landscape.
Major Findings:
The analysis yields valuable insights into which areas within the forest are most susceptible to water impact. These findings have far-reaching implications for various industries, including timber harvesting, water resource management, ecotourism, and environmental conservation. Armed with this information, stakeholders can prioritize actions such as selective logging, watershed protection measures, ecotourism site development, and habitat conservation efforts.
GIS analysis, coupled with tools like MAPOG Map Analysis, empowers decision-makers to adopt a proactive approach towards sustainable forestry management. By accurately assessing the impact of water bodies on forests, stakeholders can implement targeted interventions that balance economic, ecological, and social objectives. As we navigate the complexities of managing natural resources in the face of environmental challenges, GIS emerges as an indispensable tool for fostering resilience and sustainability in forest ecosystems.
Link of the Data:
Explore the data further through our GIS Data product, uncovering valuable information for in-depth analysis and understanding.