In energy infrastructure management, ensuring the safety and integrity of pipeline networks is very important. The influence of pipelines extends far beyond their physical footprint, encompassing the communities, ecosystems, and infrastructure that lie in their vicinity. Understanding and mitigating the potential risks of pipeline activities necessitate a holistic approach. In this article, we delve into the intricate process of utilising the buffer tool in MAPOG to Create map for pipeline impact zones.
Key Concept– Create map for pipeline impact zones
The buffer tool in MAPOG creates zones of influence around specific geographic features. In the context of pipelines, buffers can be utilized to identify areas potentially affected by pipeline-related activities or events. Thus, we uncover insights crucial for informed decision-making, proactive risk management, and stakeholder engagement in the realm of pipeline safety and sustainability. Delve into our blog and discover more articles like Creating Travel Guides: Mapping with GIS Buffer Zones and Precision Agriculture: Using GIS Buffer Zones for Eco-friendly Fertilizer Management to learn about various applications of buffer tool in various industries. At the end of the article, you will find the links to the GIS data we have utilised here, enabling you to replicate this analysis.
Follow the below process Step-by-step to Create map for pipeline impact zones
Step 1: Open Map Analysis
Navigate to Map analysis interface from MAPOG platform.
Step 2: Upload data
Begin by adding all the data required. For this click on the Add Upload option from the menu bar at the upper left end, and then go to the Add GIS Data option.
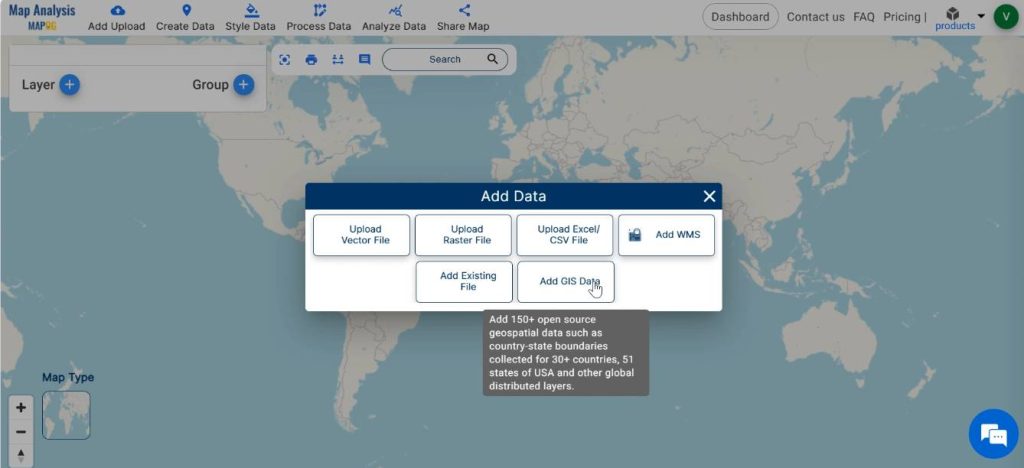
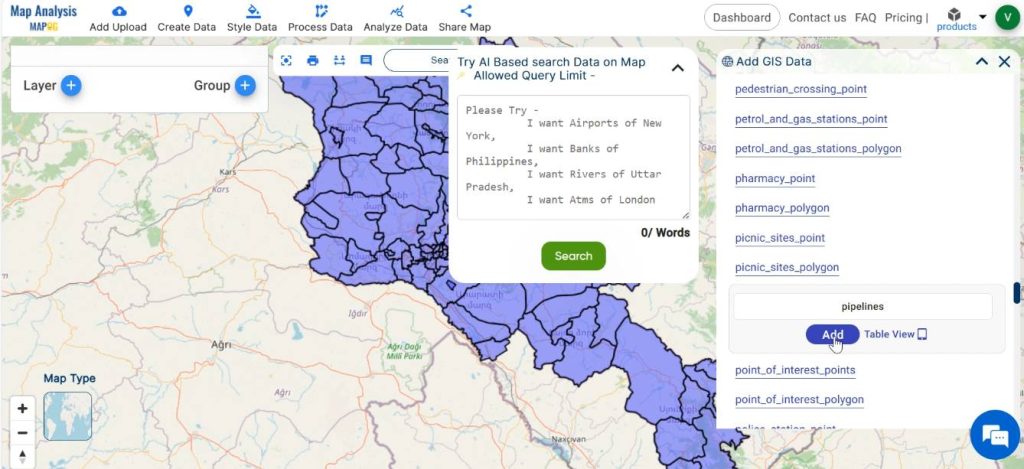
Select the country of your interest. From the built-in GIS data, search for and Add pipeline layer. Table view option facilitates the preview of the data table of the chosen layer.
Step 3: Save map
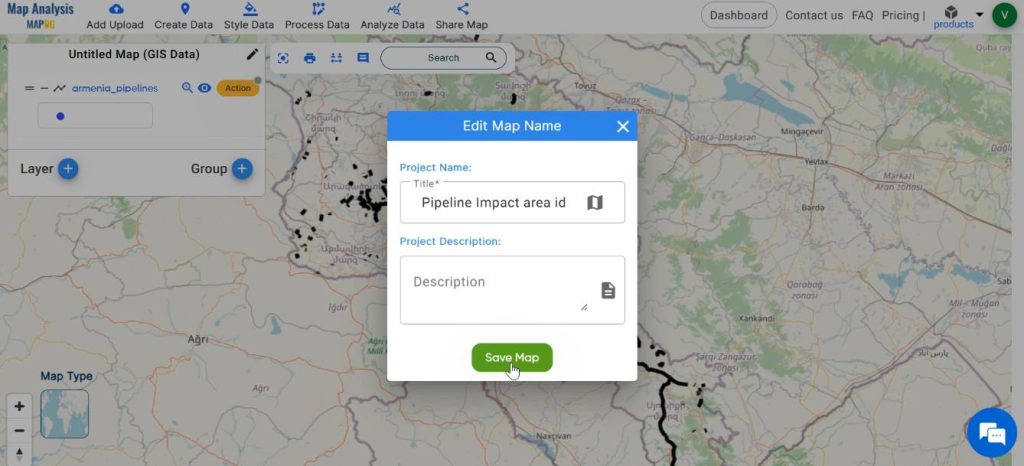
Then save your map with a suitable name. For this, click on the pencil icon near the “Untitled Map” text. Enter a suitable name, and if desired, provide a brief description of your project. Finally, save the map by clicking on the “Save Map” button.
Step 4: Create buffer zone
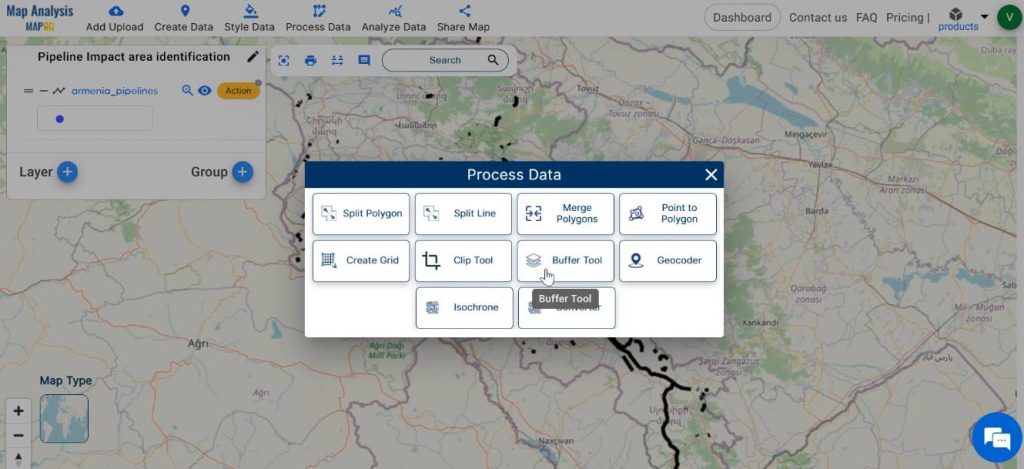
To delineate the impact area around pipelines, create a buffer zone of a particular range around pipelines. For this, click on Process Data and select the Buffer tool.
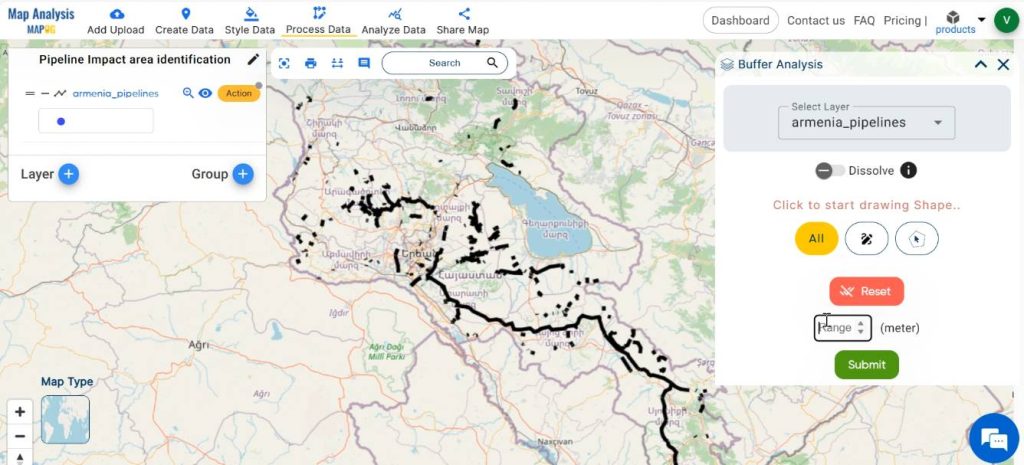
Select the pipeline layer in the given tab. Enter a suitable value as the range of the buffer zone. Click on Submit.
Step 5: Rename Layer
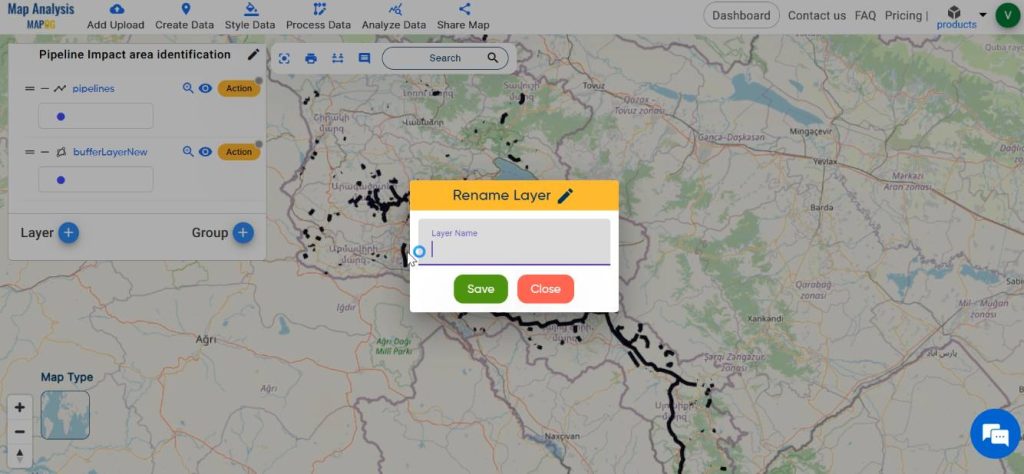
Rename the added layers by clicking on Action near the layer, followed by the pencil icon. Enter a suitable name. Then, click on save.
Step 7: Enhance the map
Enhance the visual appearance of the map by styling the layers with different and appealing colours. In order to do this, click on Style Data and select Basic Style.
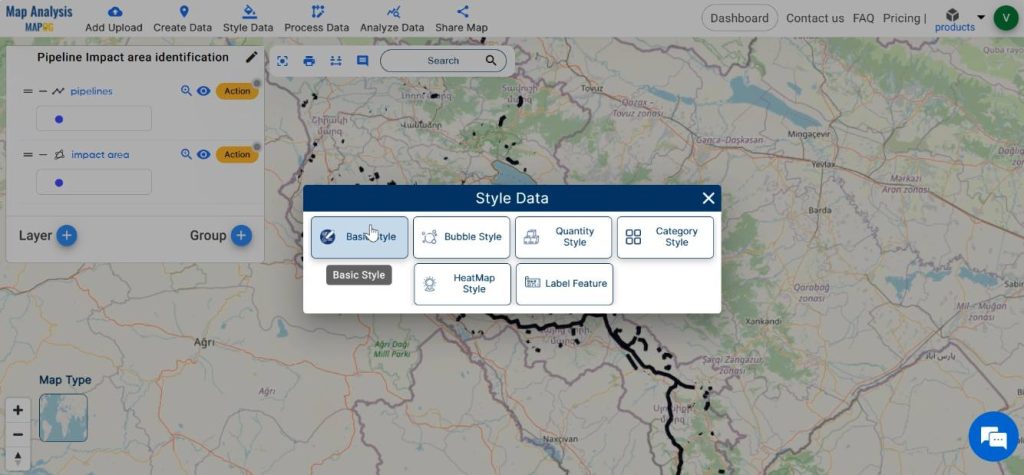
Select the layer to be styled, then choose the suitable colour gradient for the layer from the available colour palette. Save your changes by clicking on Save Style.
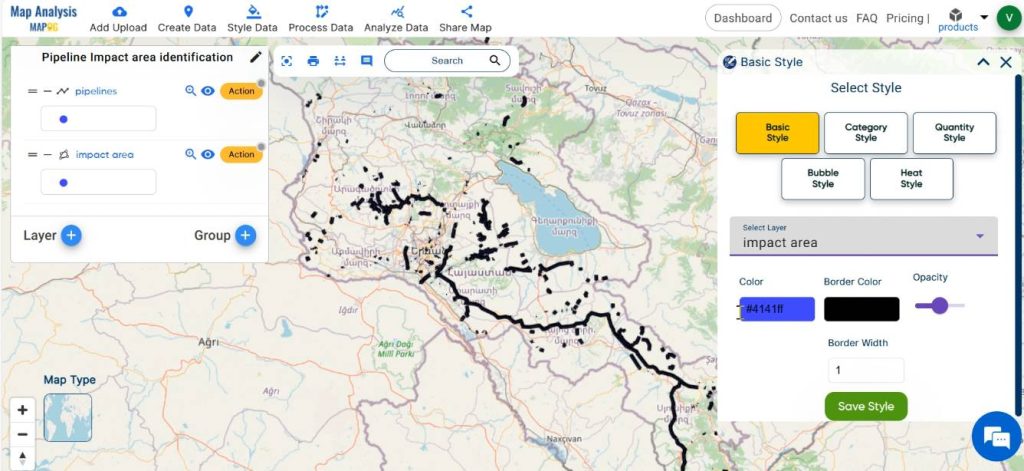
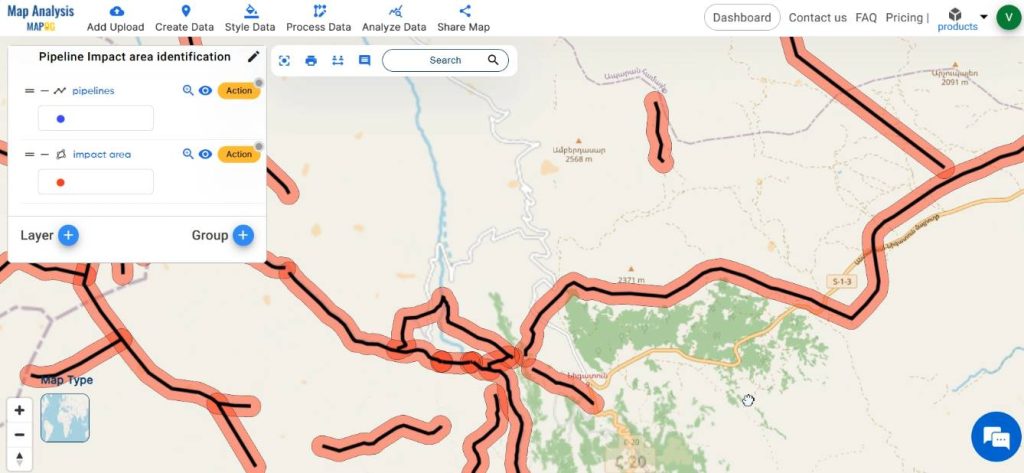
Finally, we have generated a map that depicts the pipelines and the potential impact area around the pipelines.

Major Findings
- High-Risk Zones Identification: The map delineates zones of high risk level surrounding the pipeline infrastructure.
- Emergency Response Planning Prioritization: The delineation of impact areas informs the prioritisation of emergency response planning efforts.
- Stakeholder Engagement Opportunities: The impact area map serves as a powerful visual tool for stakeholder engagement and communication.
Industry and Domain
- Environmental Conservationists:They leverage the map to identify and prioritise conservation efforts, ecological restoration projects, and habitat preservation initiatives within or adjacent to pipeline impact areas.
- Pipeline Operators: Pipeline operators benefit from the map by gaining a comprehensive understanding of the spatial extent of potential impact areas surrounding their infrastructure. Thus enabling them to implement targeted safety measures, prioritise maintenance activities.
- Communities: Residents and communities residing near pipeline corridors benefit from the map by gaining awareness of potential risks and vulnerabilities associated with pipeline infrastructure.
Conclusion–Create map for pipeline impact zones
In conclusion, the utilisation of the buffer tool in MAPOG to create impact area maps around pipelines enhances decision-making processes, promotes safety and environmental stewardship, and facilitates collaboration among stakeholders. By leveraging MAPOG tools, pipeline managers can effectively identify, assess, and mitigate risks associated with pipeline operations, ultimately contributing to the safe and sustainable management of energy infrastructure.
GIS Data Links
Explore more content on our blog:
Create Map- DIGITIZING SOLAR, HYDROELECTRIC, WIND AND BIOMASS POWER PLANTS- RENEWABLE ENERGY
Create Map- School Area Coverage through Buffer Analysis
Mapping Safety Create GIS Map: Game-changing Approach to Hospital Risk Analysis