In the dynamic realm of disaster response, precision and adaptability are crucial. The MAPOG Map Analysis tool emerges as a groundbreaking solution that transcends traditional limitations in mapping seismic events. This comprehensive guide spotlights MAPOG’s unique feature: the ability to create a map for visualizing Earthquake Data without constraints. Unlike conventional tools, MAPOG empowers users to import and categorically style an extensive array of earthquake records, offering unprecedented freedom in map creation. This article explores MAPOG’s distinctive capability, showcasing its role in crafting maps without boundaries. With an emphasis on limitless scalability, MAPOG becomes a strategic asset, allowing users to navigate and analyze seismic landscapes with unparalleled freedom and precision. To know more about seismic data analysis using MAPOG, read our latest blog on Creating Maps for Seismic Analysis.
Key Concept
At the heart of MAPOG’s innovation lies a key concept that reshapes the landscape of mapping tools – the freedom from limitations in handling data points. Unlike conventional tools, MAPOG defies constraints, offering users the unprecedented ability to import and categorically style an extensive number of earthquake records on a single map. This key concept revolutionizes how seismic events are visualized and empowers users to navigate and analyze data with unparalleled ease and precision. By eliminating restrictions on the number of points that can be plotted, MAPOG opens new avenues for exploration and understanding in disaster response, making it a transformative solution for those seeking dynamic and scalable mapping capabilities.
Steps to Create a Map for Visualising Earthquake Data Without Constraints
Step 1: Add Data
Open the MAPOG Map Analysis interface. Click on the ‘Add Upload’ button in the upper left corner. A dialog box will open. Select the ‘Upload CSV/Excel‘ option.
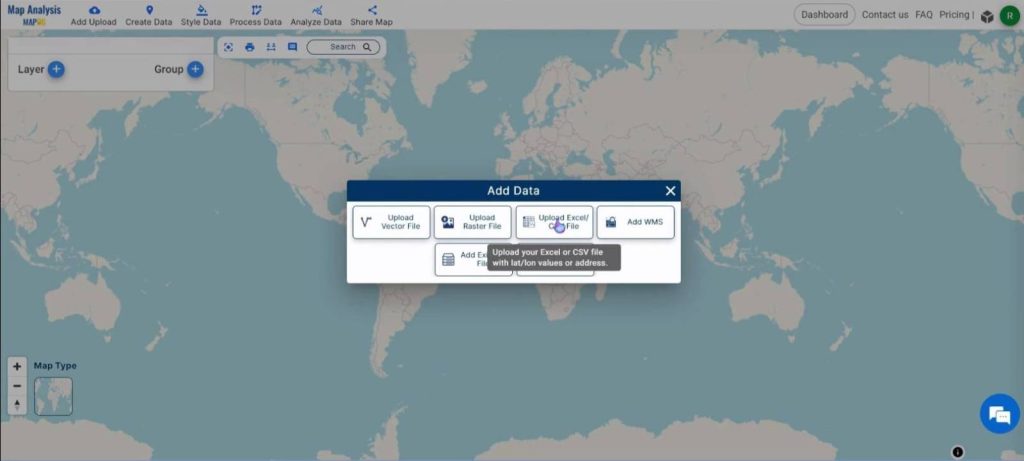
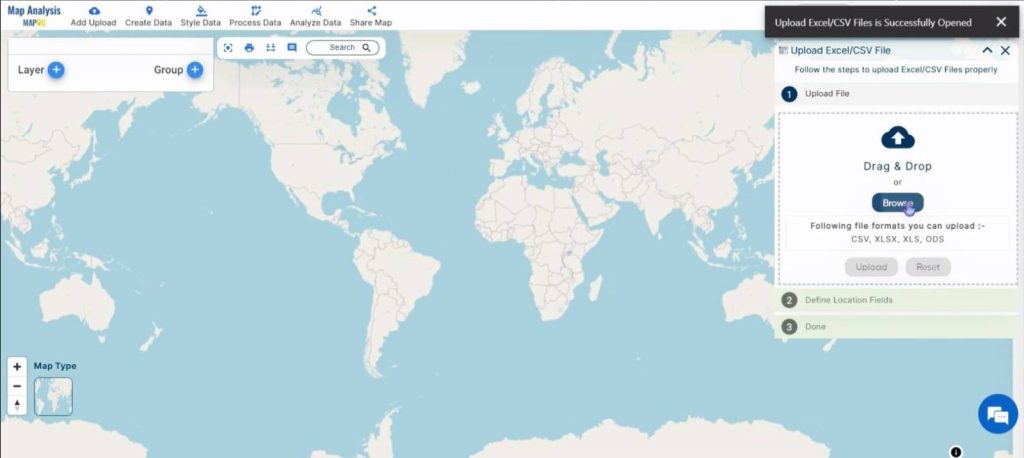
In the Upload Excel/CSV dialog box that opens on the right, click on ‘Browse‘ to select the CSV file.
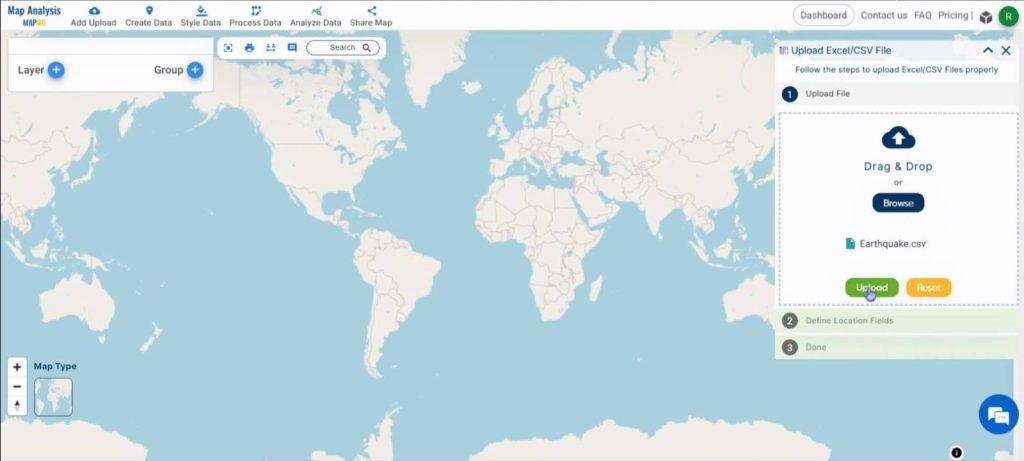
Click on ‘Upload’ once the required file is chosen.
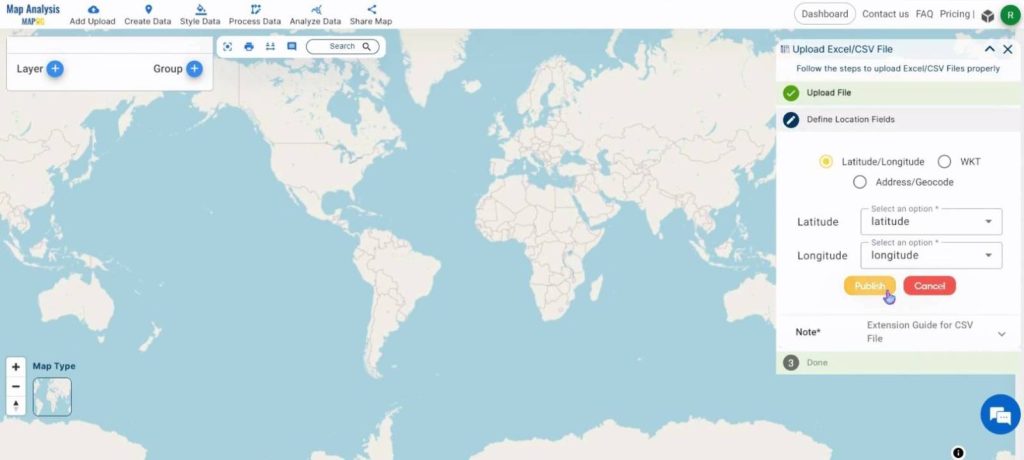
Next, assign the latitude and longitude to their respective columns in the CSV file and click on ‘Publish‘.
To rename the map, click on the pencil icon in the top right corner of the box on the left. Once the name is given, click on Save Map.
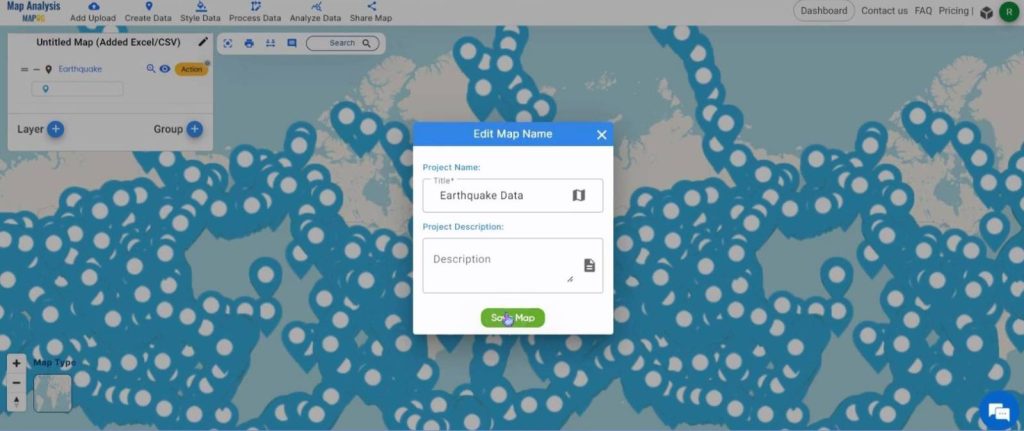
Step 2: Change the symbology
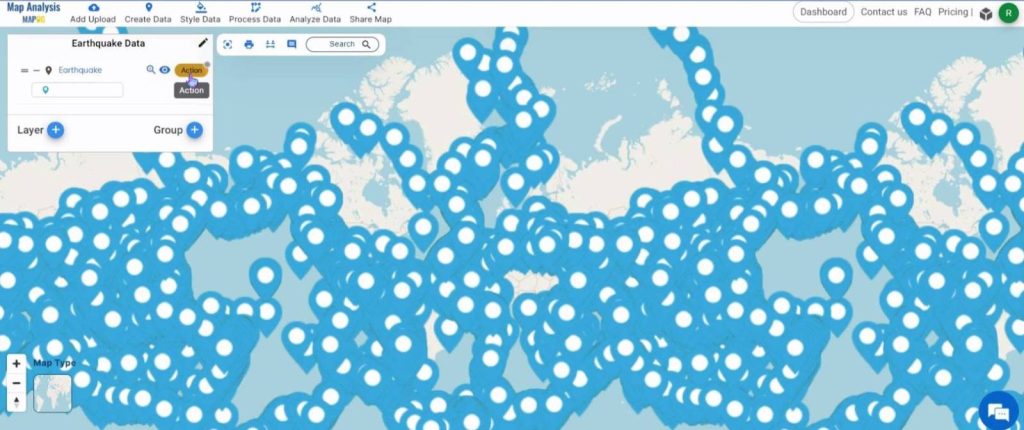
To change the symbology of the layer, first click on the Action button near the name of the layer.
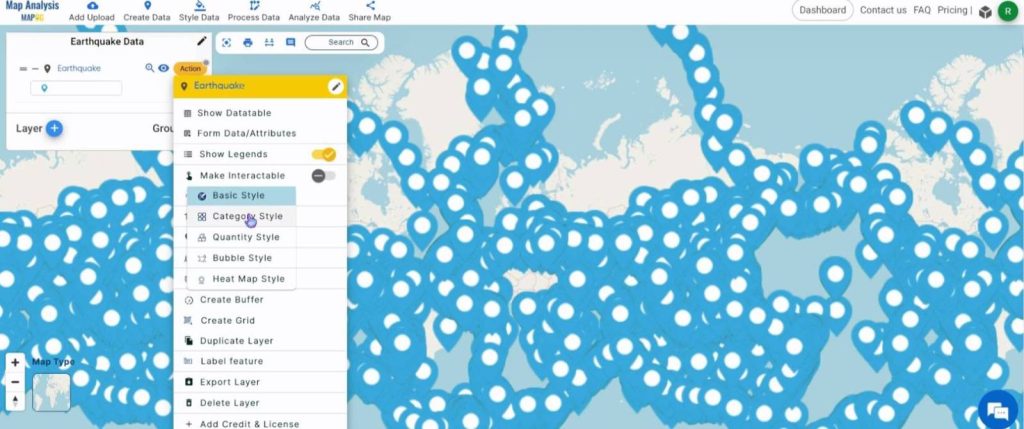
Select Category Style in the Edit Style option.
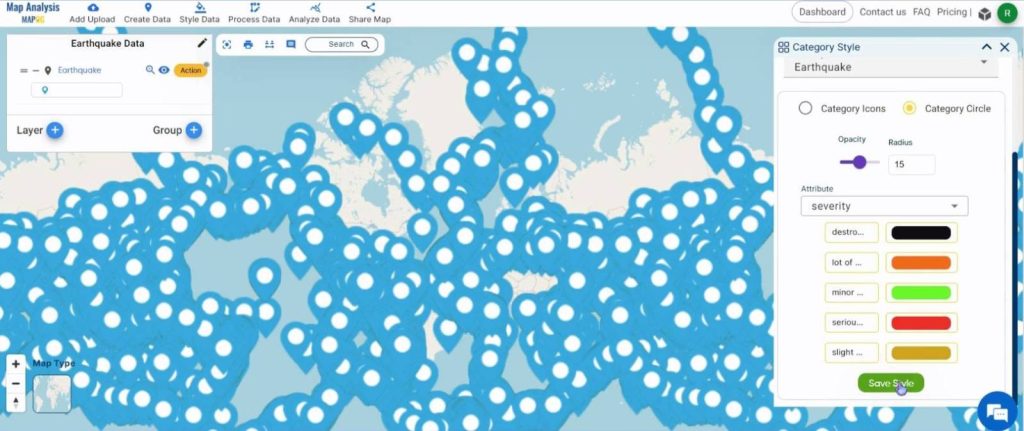
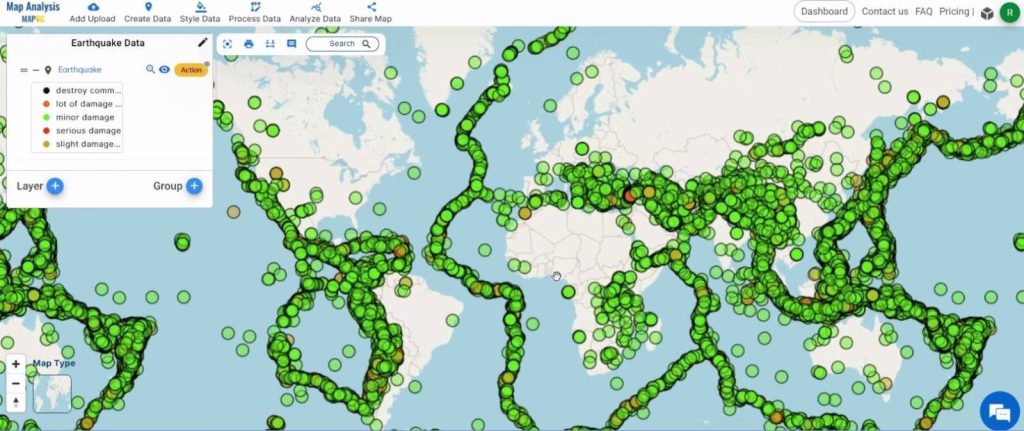
Choose Category Circle and assign an appropriate radius value. Select ‘Severity’ as the attribute and pick appropriate colors for each category from the gradient. then, click on Save Style.
Shown below, is the final map.
Major Findings – Create a Map for Visualising Earthquake Data Without Constraints
- Unrestricted Data Handling: MAPOG’s standout feature lies in its ability to handle a vast number of earthquake data points without limitations, providing users with unprecedented freedom in map creation.
- Seamless Import and Categorical Styling: Regardless of the quantity, MAPOG facilitates the effortless import and categorical styling of earthquake records, showcasing its scalability and adaptability in disaster response scenarios.
- Scalability Advantage: MAPOG’s scalability becomes evident as it empowers users to navigate and analyze seismic events with ease, eliminating restrictions on the number of data points that can be plotted on a single map.
- User-Friendly Interface: The tool’s user-friendly interface stands out, making it accessible to a wide range of users involved in disaster response and mapping activities.
Domain and Industry – Create a Map for Visualising Earthquake Data Without Constraints
- Emergency Responders: MAPOG’s capacity to handle a large volume of earthquake data points provides emergency responders with a powerful tool for rapid and accurate situational awareness during disaster events.
- Risk Assessment Specialists in Insurance: The precision in seismic intensity visualization caters to risk assessment specialists within the insurance sector, offering them a strategic advantage in evaluating potential risks associated with seismic activities.
- Government Agencies: MAPOG serves as a valuable resource for government agencies involved in disaster management, enabling them to create detailed and informative maps for efficient response planning and resource allocation.
- General Public: Through its dynamic and visually appealing maps, MAPOG also benefits the general public by raising awareness about seismic activities and fostering a better understanding of geographical vulnerabilities.
Conclusion
In conclusion, the MAPOG Map Analysis tool revolutionizes disaster response and geospatial analysis by eliminating limitations in handling data points. Its precision in visualizing seismic intensities provides strategic advantages, particularly in the disaster management sector. Overall, MAPOG emerges as a catalyst for innovation, offering a dynamic and accessible approach to understanding and responding to seismic events globally.
Other articles
- Protecting Wetlands: Guide to Create GIS Map for Nature
- GIS Analysis in Urban Planning: Reshaping Transportation Future Insights of state/city
- Fast Emergency Response: Using GIS and Isochrone Maps for 10-Minute Ambulance Arrival
- Mapping Tiger Attack Hotspots – Create an Online Map and Share
- Make Routes for Military Aerial Planning- Through Bearing angle and Distance calculation – Online Route Compass
- Mapping Healthcare Efficiency: GIS Buffer Analysis of Hospital Locations
- Add WMS- Two step online view of WMS layer on a map
- Plot ATM locations on a map and embed on your website
- Map habitat locations of endangered animals & keep track of their living
- Create a Map to find suitable sites for constructing a new house