In the dynamic landscape of disaster response, precision and efficiency are important. The MAPOG Map Analysis tool is a transformative solution designed for creating maps to analyze earthquake data and navigate potential crises. This article serves as a comprehensive guide to the functionalities of MAPOG, focusing on the creation of earthquake heat maps and the delineation of buffer regions. Notably, we explore the tool’s practical application within the insurance sector, showcasing how MAPOG empowers users to create a map that vividly visualizes seismic intensities, providing a strategic advantage in risk assessment.
Key Concept
The article’s key concepts involve applying the MAPOG Map Analysis tool in disaster management, focusing on earthquake data analysis, creating impactful heat maps, and establishing buffer regions. Within the insurance domain, the article underscores how these functionalities contribute to a nuanced understanding of seismic events, facilitating strategic planning and risk assessment.
Steps to Create a Map for Analyzing Earthquake Data
Step 1: Add Data
Open the MAPOG Map Analysis interface. Click on the ‘Add Upload’ button in the upper left corner. A dialog box will open. Select the ‘Upload CSV/Excel‘ option.

In the Upload Excel/CSV dialog box that opens on the right, click on ‘Browse‘ to select the CSV file.
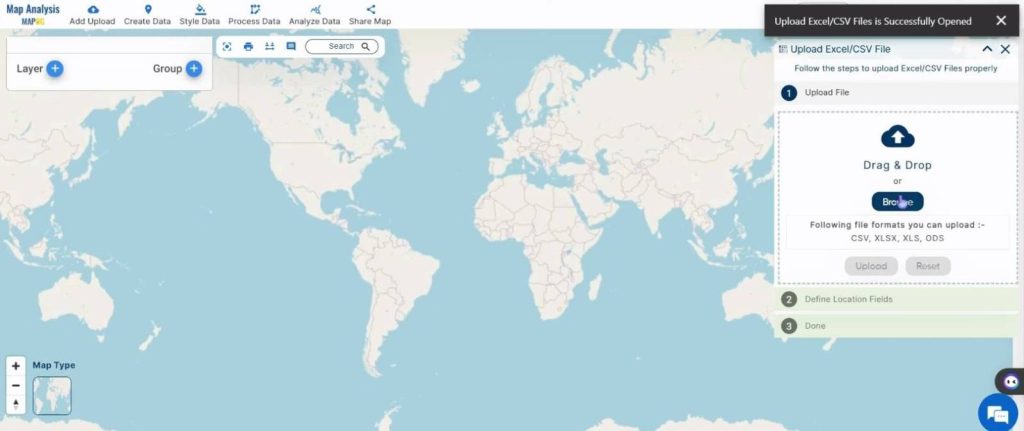
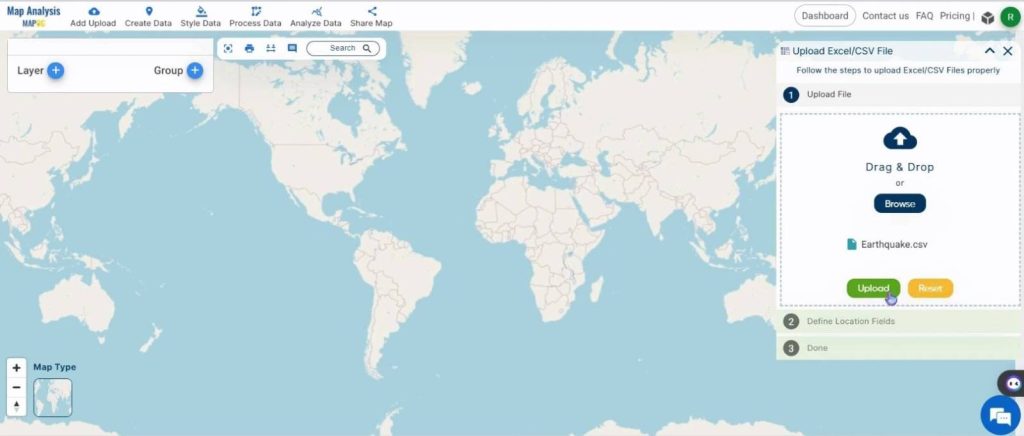
Once the required file is chosen, click on ‘Upload’.
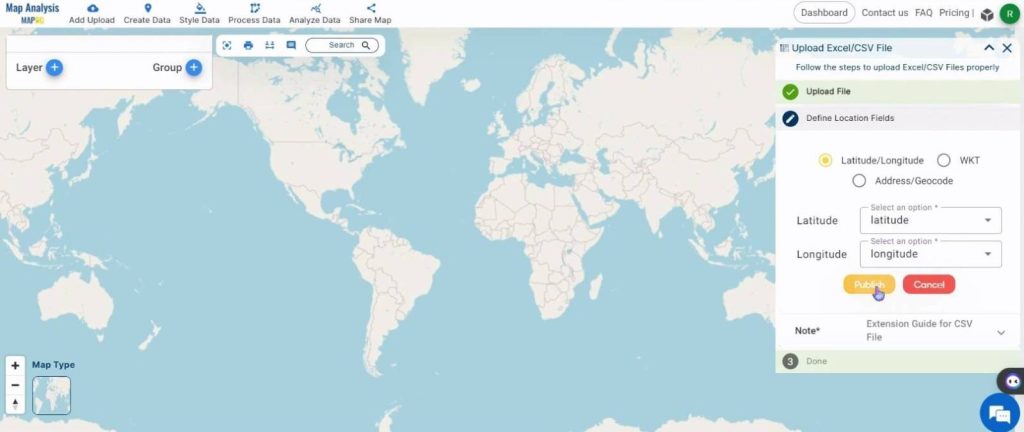
Next, assign the latitude and longitude to their respective columns in the CSV file and click on ‘Publish‘.
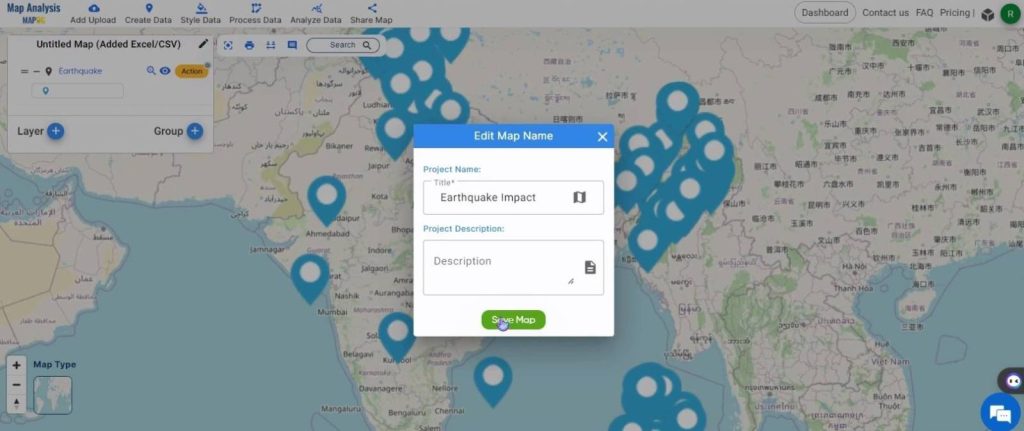
To rename the map, click on the pencil icon in the top right corner of the box on the left. Once the name is given, click on Save Map.
Step 2: Create a Heat Map
To change the symbology of the layer, first click on the Action button near the name of the layer.
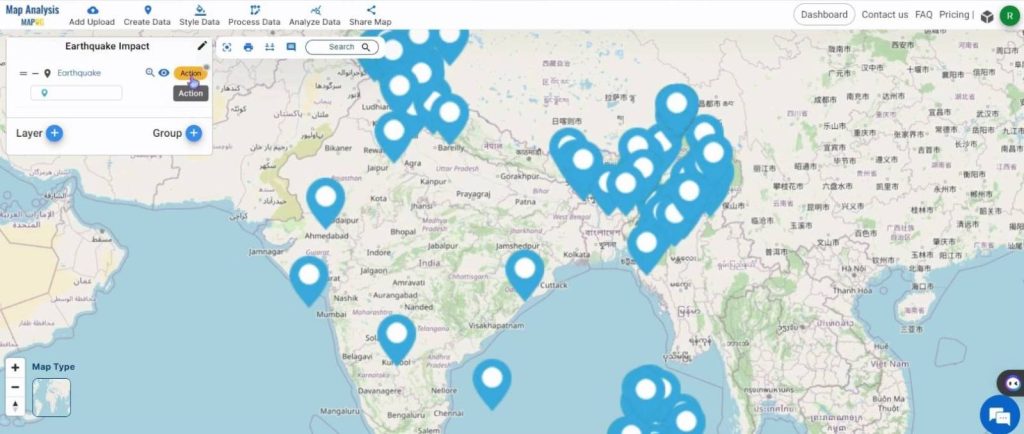
Select the Heat Map style in the Edit Style option.
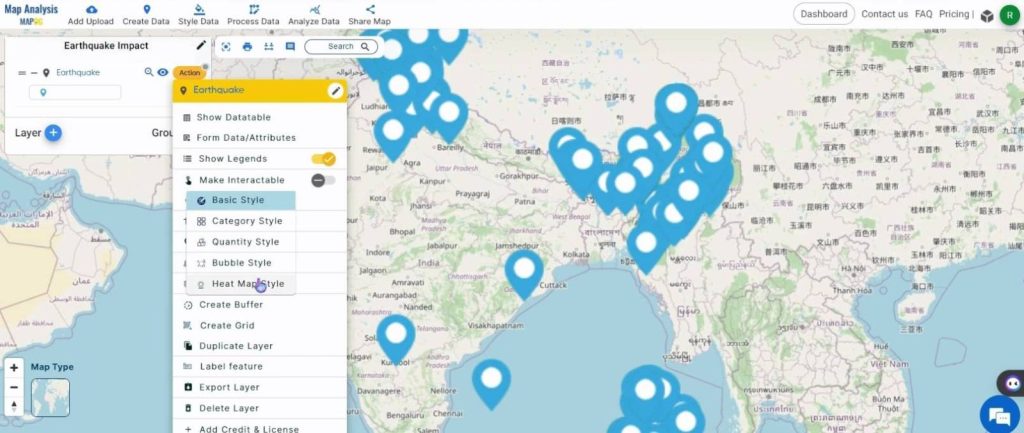
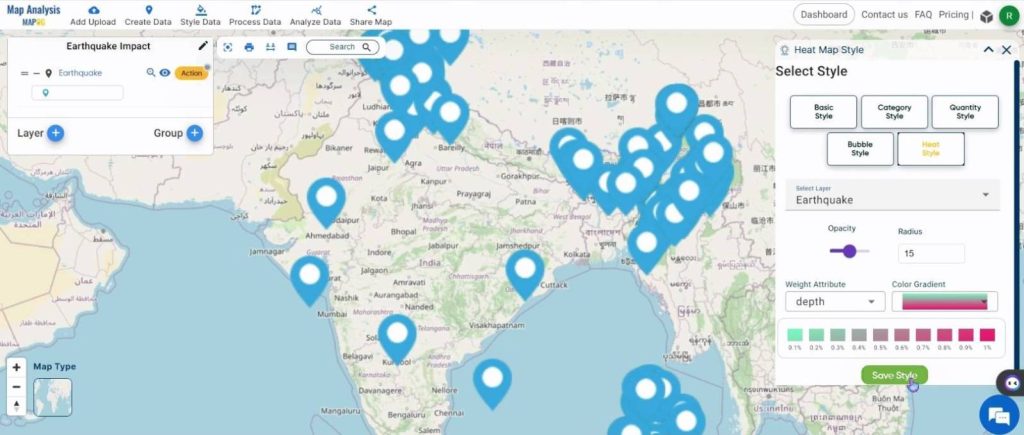
Assign an appropriate radius value and weight attribute. Choose a color gradient and click on Save Style.
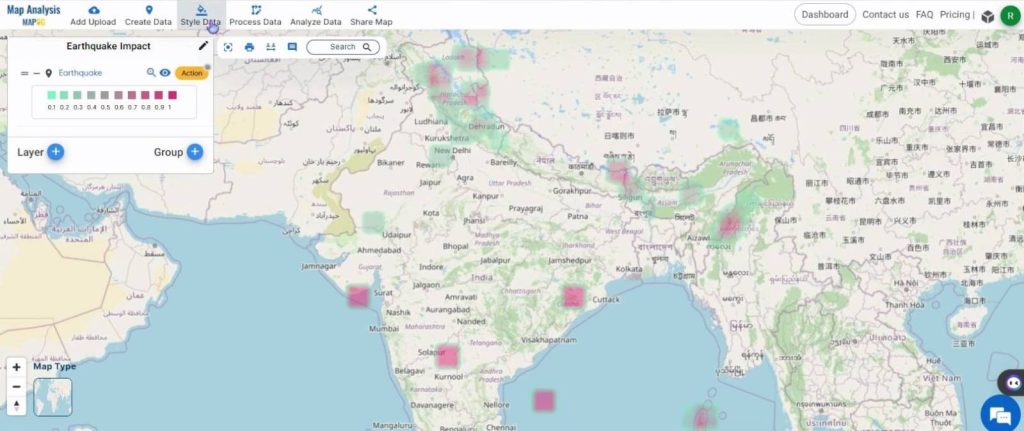
The heat map is shown below.
Step 3: Create Buffer zones
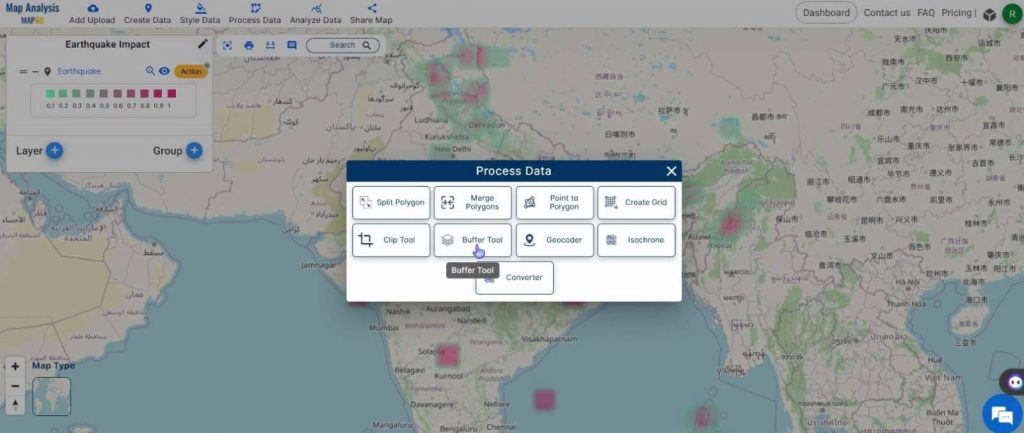
Click on the Process Data option and select Buffer Tool.
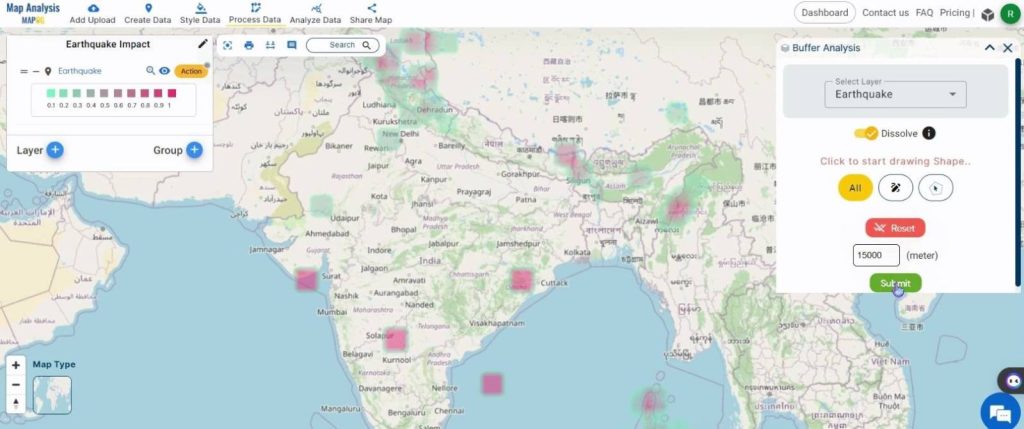
In the dialog box that appears on the right, select the layer and toggle Dissole. Then, assign a range distance to locate the affected regions and click on Submit.
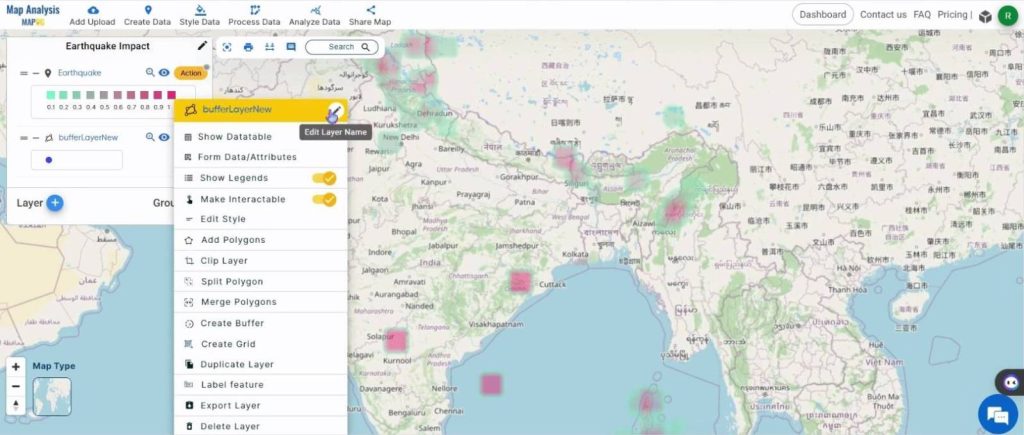
Then, rename the layer to a suitable name by clicking on the Action button, and then on the pencil icon near the name of the layer.
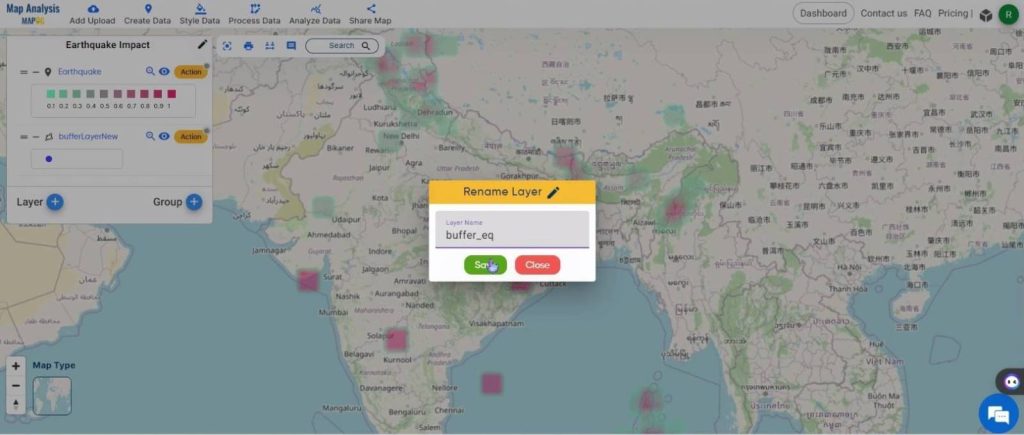
Once an appropriate name is given, click on Save.
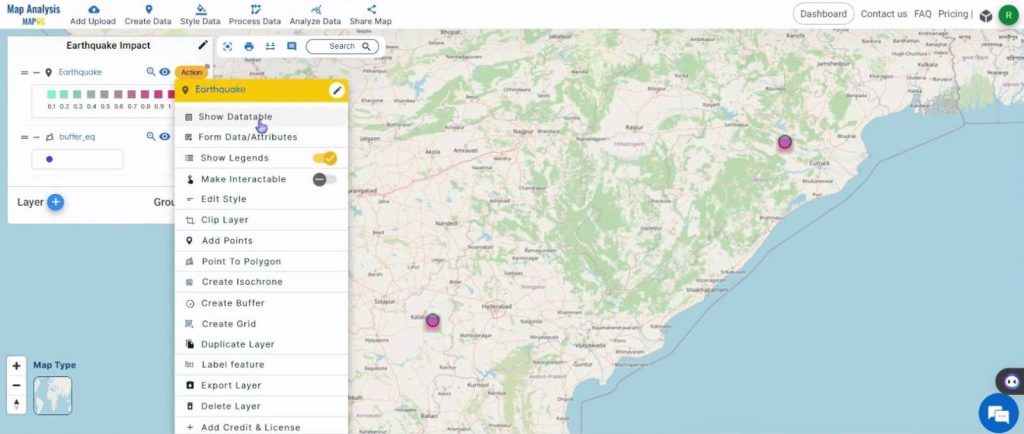
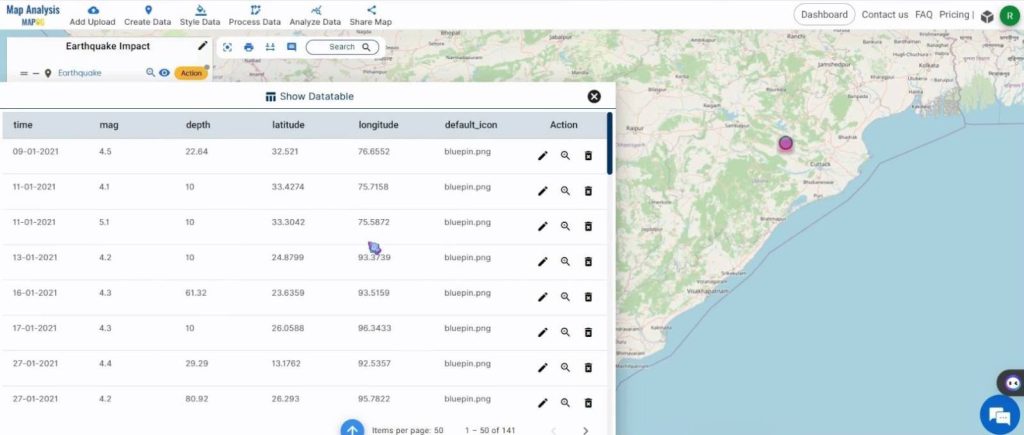
Utilize the Show Datatable option to see the features of the earthquakes. For this, click on the Action button and select Show Datatable.
The contents of the CSV will be displayed.
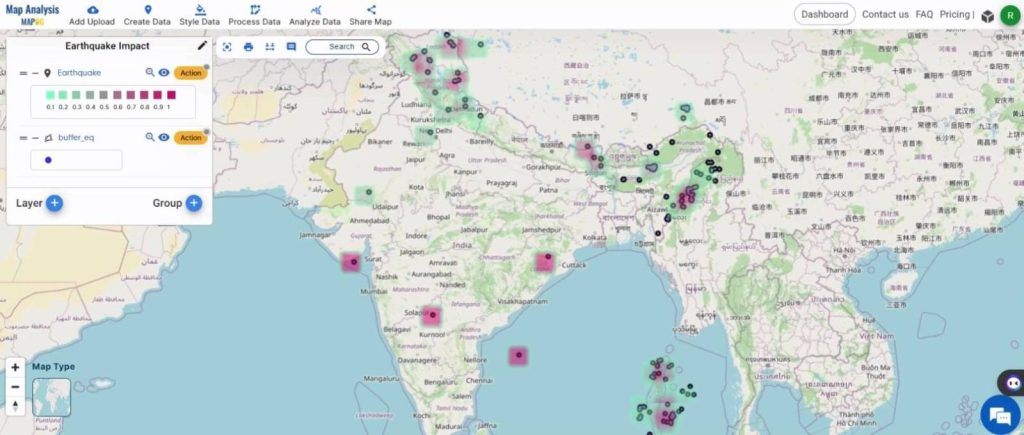
Shown below, is the final map.
Major Findings – Create a Map to Analyze Earthquake Data
The major findings of the article highlight the impactful role of the MAPOG Map Analysis tool in disaster management, specifically within the context of earthquake data analysis:
- Efficient Visualization with Heat Maps: MAPOG’s ability to generate detailed earthquake heat maps provides a visually intuitive representation of seismic intensity, aiding users in quickly assessing the areas most affected.
- Strategic Buffer Region Creation: The article emphasizes the significance of creating buffer regions around earthquake points, showcasing the extent of potentially damaged areas. This feature proves crucial in identifying zones requiring heightened preparedness and resource allocation.
- Tailored Application in the Insurance Domain: By focusing on the practical application within the insurance sector, the article reveals how MAPOG’s features contribute to a more nuanced understanding of seismic impact. This understanding is instrumental in risk assessment for insured areas.
- Technology-Driven Disaster Preparedness: The central theme revolves around the integration of cutting-edge technology, represented by MAPOG, to enhance disaster preparedness. The findings emphasize a data-driven approach that reshapes how seismic events are interpreted and responded to in real time.
Domain and Industry
The analysis facilitated by the MAPOG Map Analysis tool benefits various stakeholders involved in disaster management, particularly in the context of earthquake data. The primary beneficiaries include:
- Emergency Responders and Authorities: Quick and accurate visualization of earthquake-affected areas enables emergency responders and authorities to plan and deploy resources more efficiently. They can prioritize areas at higher risk, improving the overall responsiveness to disaster events.
- Insurance Companies: In the insurance domain, the analysis assists companies in assessing and managing risk. The identification of seismic impact zones through heat maps and buffer regions allows insurers to refine their risk models, leading to more precise underwriting and claims management.
- Urban Planners and Decision-Makers: City planners and decision-makers can use the insights from MAPOG to inform urban development strategies. Understanding seismic vulnerabilities helps in designing more resilient infrastructure and developing land-use policies that mitigate risks.
- Public Safety Agencies: The public safety sector benefits from the analysis by having a clearer understanding of areas prone to seismic events. This information is valuable for formulating public safety campaigns, evacuation plans, and community awareness initiatives.
- Communities and Residents: Local communities and residents in earthquake-prone regions benefit from increased awareness and preparedness. Access to accurate and visualized data empowers individuals to take proactive measures, such as securing their homes and participating in community disaster drills.
Conclusion
In conclusion, the MAPOG Map Analysis tool emerges as a pivotal asset in revolutionizing earthquake preparedness and disaster response. Its ability to generate insightful heat maps and define buffer regions provides critical data for emergency responders, authorities, and insurers, fostering more efficient resource allocation and precise risk assessments. Beyond immediate applications, the tool empowers urban planners and communities to make informed decisions, promoting resilient infrastructure and fostering a culture of preparedness. As technology continues to reshape disaster management, MAPOG offers a dynamic platform that enhances our collective ability to understand, respond, and adapt to seismic events, ultimately contributing to a safer and more resilient future.
Other articles
- Protecting Wetlands: Guide to Create GIS Map for Nature
- GIS Analysis in Urban Planning: Reshaping Transportation Future Insights of state/city
- Fast Emergency Response: Using GIS and Isochrone Maps for 10-Minute Ambulance Arrival
- Mapping Tiger Attack Hotspots – Create an Online Map and Share
- Make Routes for Military Aerial Planning- Through Bearing angle and Distance calculation – Online Route Compass
- Mapping Healthcare Efficiency: GIS Buffer Analysis of Hospital Locations
- Add WMS- Two step online view of WMS layer on a map
- Plot ATM locations on a map and embed on your website
- Map habitat locations of endangered animals & keep track of their living
- Create a Map to find suitable sites for constructing a new house