Today, we’re excited to show you how to use heatmaps for density mapping. These easy steps will help you visualize data intensity or density with color variations, unlocking new insights and possibilities. Whether you’re in urban planning, environmental management, transportation, real estate, or any other field, MAPOG helps you make better decisions with clear spatial data analysis. Let’s dive in and see how to take your mapping projects to the next level!
Key Concept: Density Mapping with Heatmaps
The main idea here is to use MAPOG to create heatmaps that show data density. This helps you understand where things are more concentrated or spread out. With MAPOG’s easy-to-use Map Analysis Tool, you can make heatmaps that fit your specific needs and goals.
Step-by-Step Process:
Step 1: Uploading Your Data
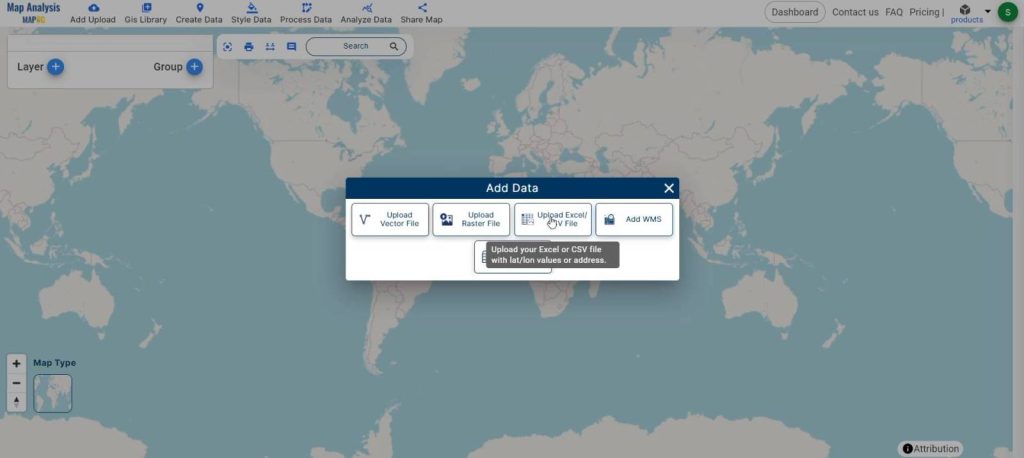
First, go to the analysis tool and start by clicking “Add Upload.” Choose “Upload Excel/CSV File” to add your density data for analysis.
Step 2: Creating the Heat Map
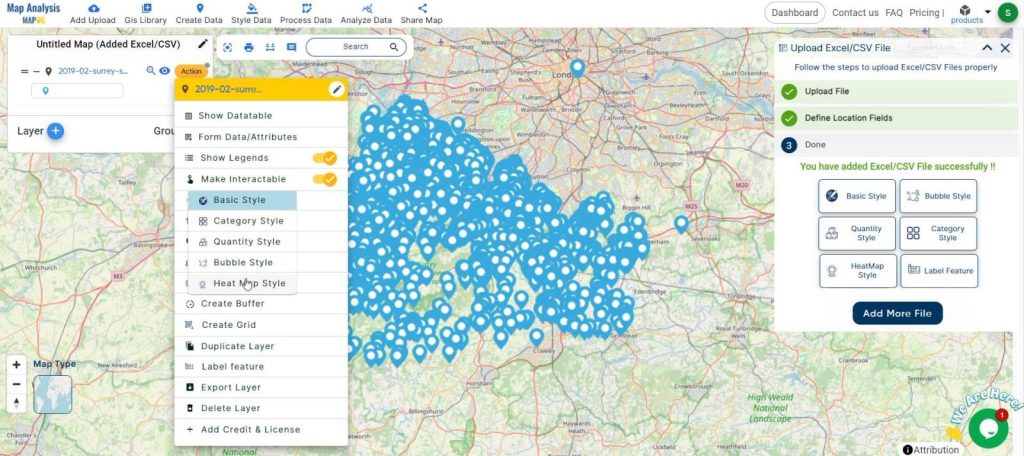
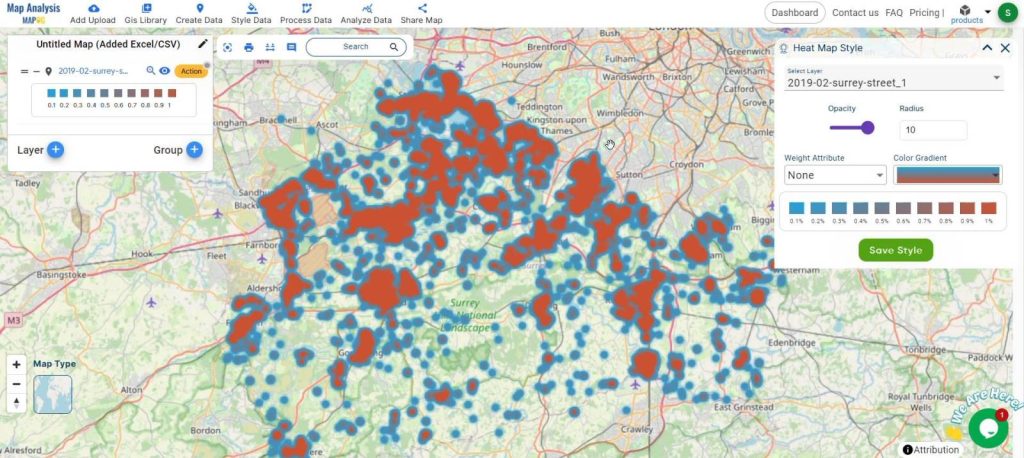
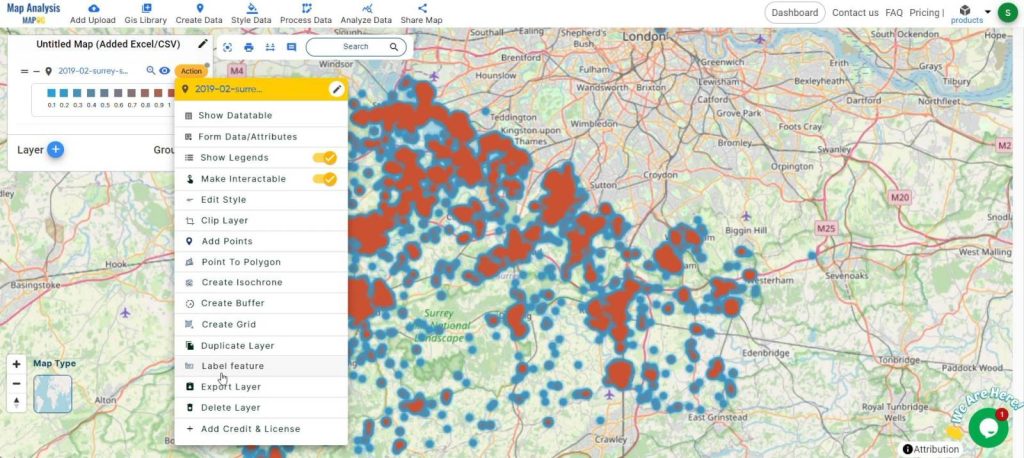
To create the heat map, start by opening the layer style. Click on the action menu of the layer, then select “Edit Style.” Next, choose “Heat Map Style” from the options. Pick the attribute you want to visualize and finally, click “Save style” to apply the changes.
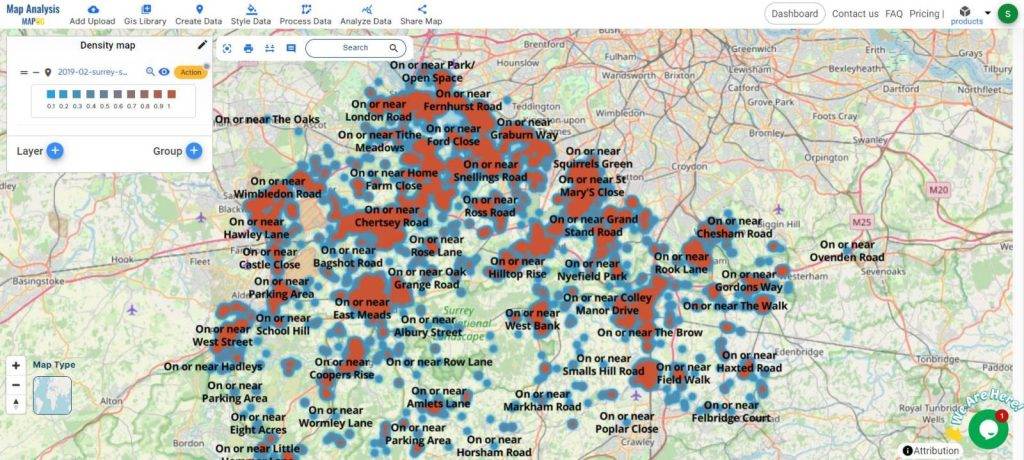
Step 3: Adding Labels for Clarity
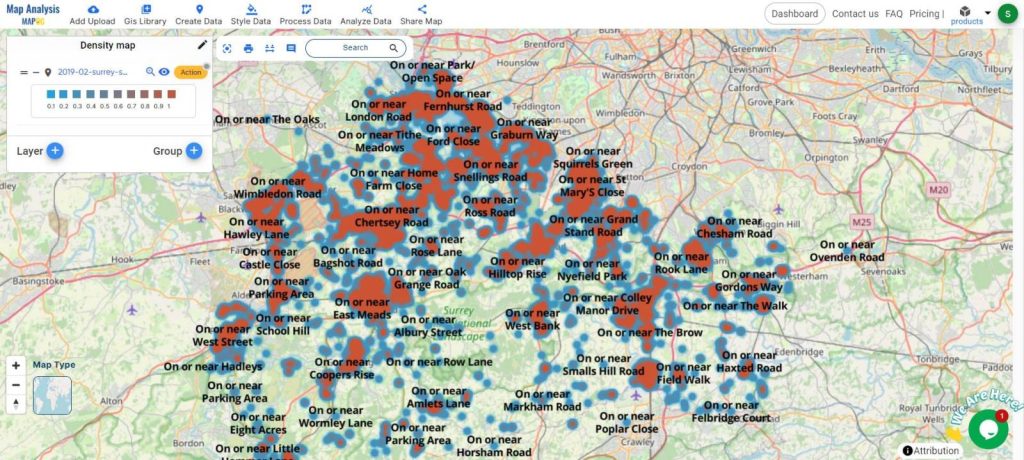
Use the “Label Feature” in the action button of the density layer to label data points, making your map clearer.
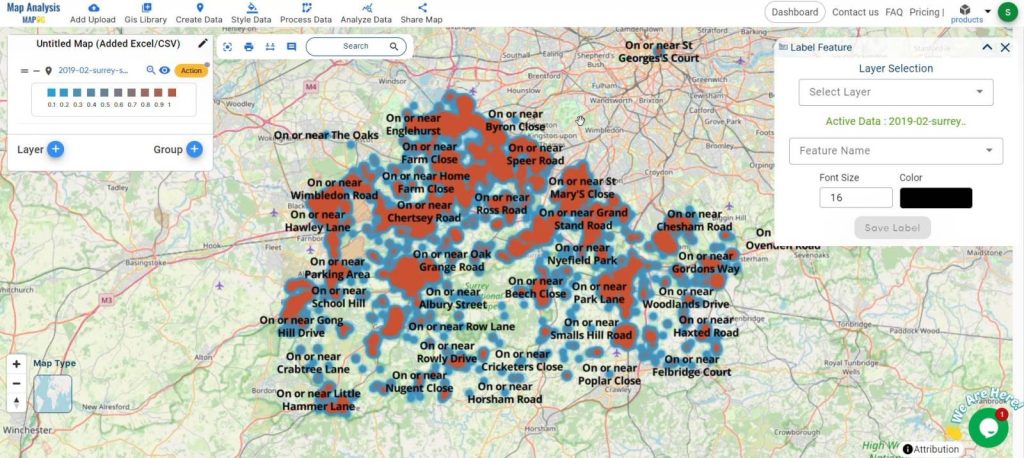
The labeled heat map lets you see specific data points more clearly, making the map easier to understand and use.
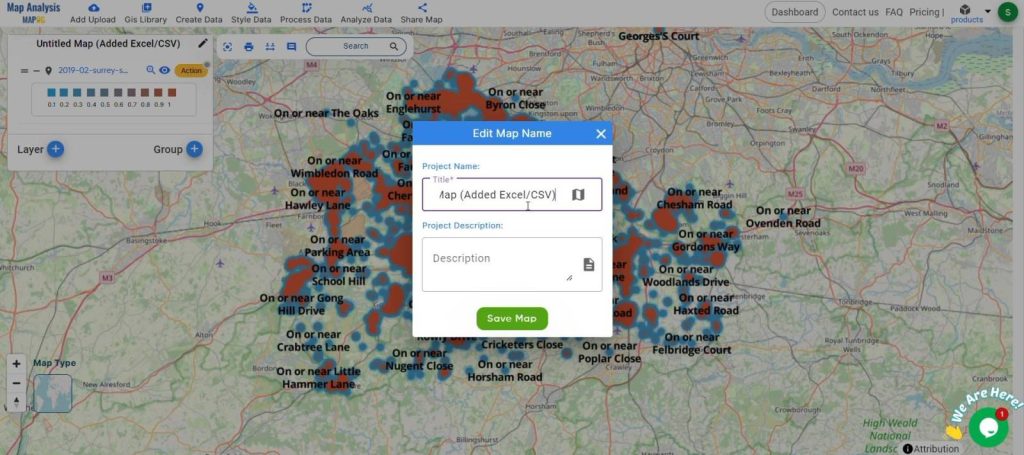
Step 4 : Renaming and Saving Your Map
Click on the pencil icon to rename the map if you want. Then, click “Save Map” to keep your changes and organize your data.
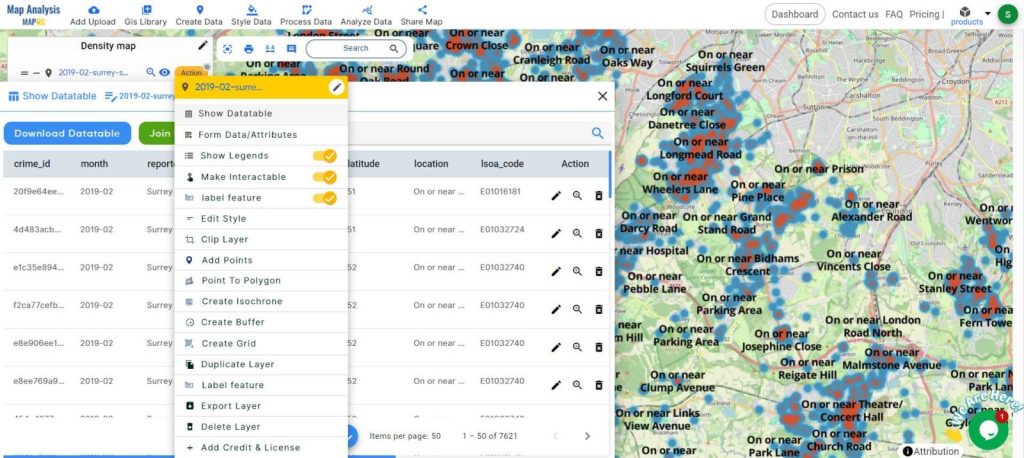
Data Table Feature: MAPOG also has a data table feature that shows your data in a table format, making it easy to look at and analyze details.
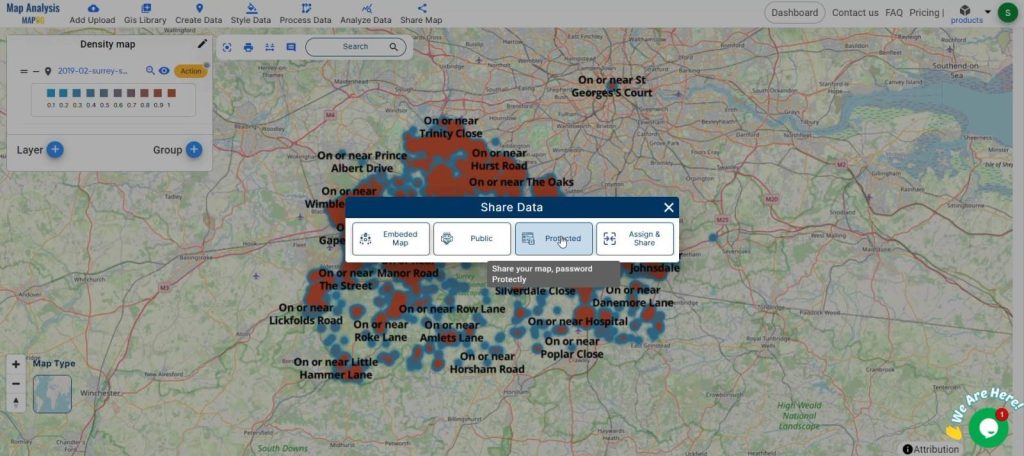
Step 6: Sharing Your Findings
Share your results easily by exporting and sharing your heatmaps. This helps you work with others and keep everyone informed.
Major Findings:
By using MAPOG to create heatmaps, we’ve improved the detail and usefulness of our maps. This helps with better analysis and decision-making. MAPOG makes it simple to add new attributes to your data, which is helpful for various needs like demographic analysis, environmental studies, or infrastructure planning. This process shows how effective MAPOG is for creating detailed, custom spatial data for many different uses.
Domains and Industries Benefiting:
- Urban Planning: Understand population density, zoning areas, and resource allocation.
- Agriculture: Visualize crop production, soil quality, and irrigation needs.
- Hydrology: Map water bodies, flood zones, and water quality.
- Public Health: Track disease outbreaks, healthcare facilities, and population health data.
- Transportation: Analyze traffic patterns, public transit usage, and infrastructure development.
- Wildlife Conservation: Monitor animal populations, habitats, and migration patterns.
- Real Estate: Assess property values, market trends, and development opportunities.
- Emergency Management: Plan for disaster response, evacuation routes, and resource distribution.
- Energy: Map energy consumption, renewable energy sites, and grid infrastructure.
Conclusion
In conclusion, using MAPOG’s Map Analysis Tool to create heatmaps is a straightforward and powerful way to enhance your spatial data projects. By following these steps, you can create detailed, insightful maps that help with better analysis and decision-making. Whether you are working in urban planning, agriculture, public health, or any other field, MAPOG’s tools allow you to tailor your data to meet your specific needs.
Thank you for joining us on this journey to explore the potential of heatmaps in your mapping projects. If you have any questions or need further assistance, please don’t hesitate to contact us at support@mapog.com. We’re here to help you make the most out of your data with MAPOG.
Other Articles
- Create a Map to find suitable sites for constructing a new house
- Create Map for Analyzing Water Quality using Heat Map Style
- Create Map – School Map Area Coverage Through Buffer Analysis
- Mapping Safety Create GIS Map : Game-Changing Approach to Hospital Risk Analysis
- Create Map for Real Estate Developer for Best Site Selection
- Create Map for Landfill Optimization: Spatial Analysis Approach