Coastal erosion poses a significant threat to coastal regions, jeopardizing not only the natural beauty of beaches but also the structural integrity of sea walls essential for coastal protection. In response to this challenge, MAPOG undertakes a comprehensive mapping initiative for coastal erosion assessment and mitigation. This article explores how MAPOG delineates erosion-prone areas along beaches and identifies crucial regions where sea walls are required for enhanced coastal resilience.
Key Concept for Creating Map for Coastal Erosion Assessment and Mitigation
The MAPOG buffer tool helps to delineate the regions impacted by coastal erosion to varying degrees around beaches, facilitating the identification of highly susceptible regions and areas requiring immediate protective measures. Additionally, with the Create Polyline tool it is possible to accurately represent the necessary protective structures on the map. By utilising the Measure tool in conjunction with the polyline tool, the precise length of these protective barriers can be calculated, providing detailed insights into the scope and scale of required interventions. Furthermore, we encourage readers to delve into additional articles available on our blog covering diverse fields, like Create Map for Analyzing Water Quality using Heat Map Style, Create Map for Landfill Optimization: Spatial Analysis Approach. The links for GIS Data which we are using here are mentioned at the end of the article.
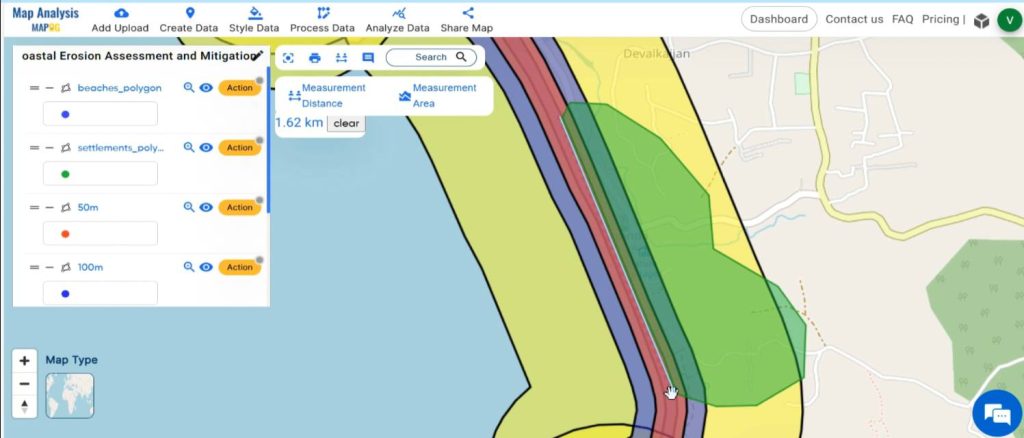
Follow the below process Step-by-step for creating map for Coastal erosion assessment
Step 1: Open Map Analysis
Open Map analysis interface from MAPOG platform.
Step 2: Upload data
To add the required data, click on the Add Upload option from the menu bar at the upper left end, and then go to the Add GIS Data option.
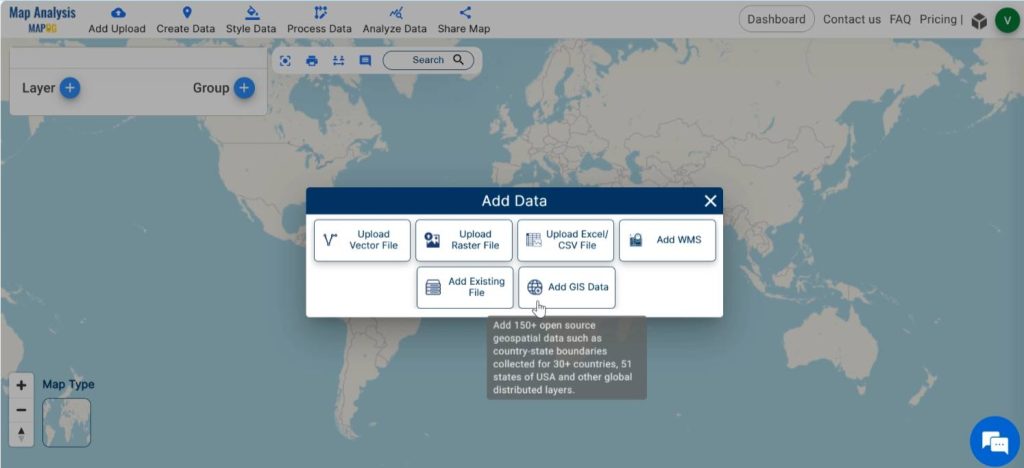
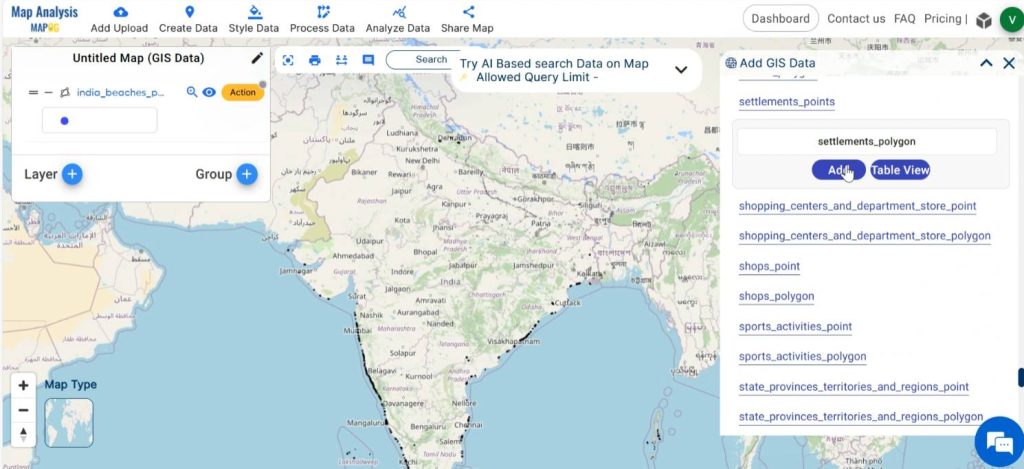
First, choose your desired country from the GIS data. Then, scroll down to locate the necessary layers. Utilising the Table view option, we can access the data table of the layer. Finally, click on Add. Here, we are adding beach polygons and settlement polygons accordingly.
Step 3: Save map
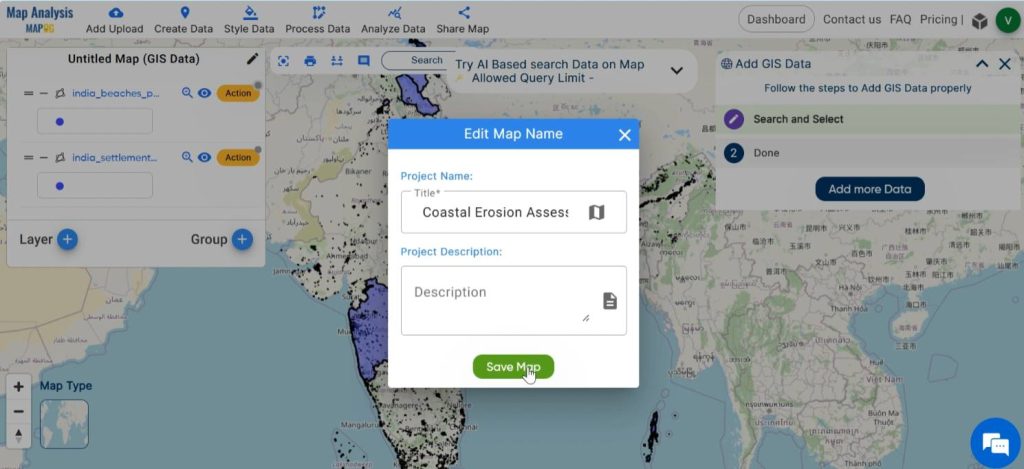
To save your map with suitable names, click on the pencil icon positioned near the “Untitled Map” text. Replace “Untitled Map” with an appropriate name and you can also add a description about your project. Then click on Save Map.
Step 4: Customise the layers
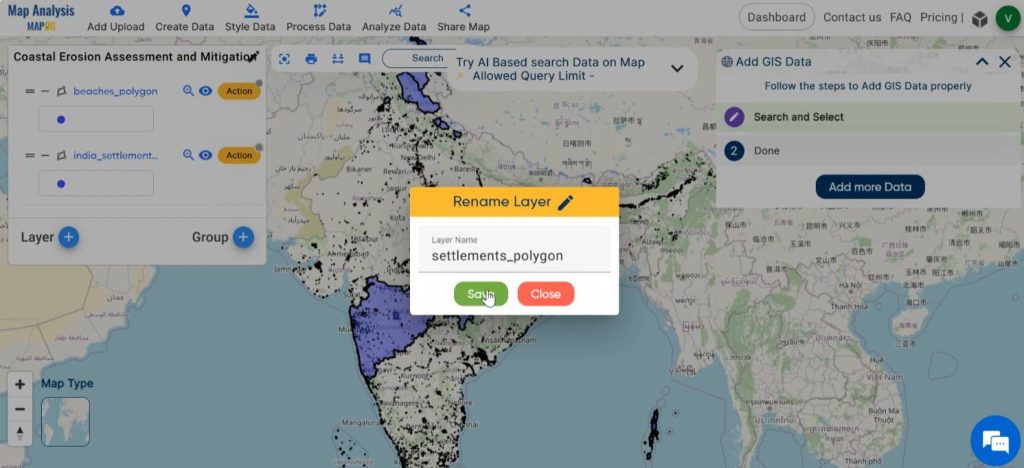
For naming the layers, click on Action next to each layer, then click the pencil icon to enter the appropriate name. Finally, save your changes.
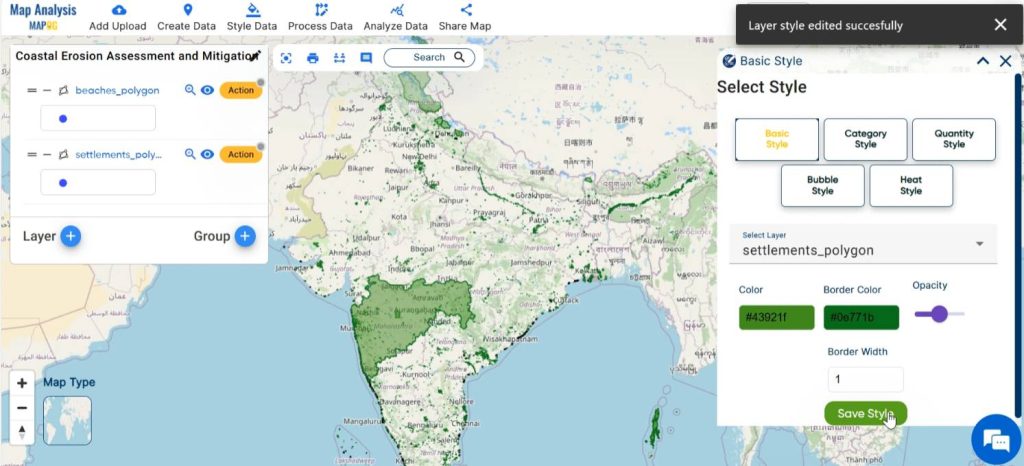
Next, style the layers with suitable colours: Choose Action followed by Edit Style, then select Basic Style. Basic style can be also selected from the Style Data option in the menu bar. Pick suitable colour gradients and save the changes by clicking on save style.
Step 5: Create Buffer
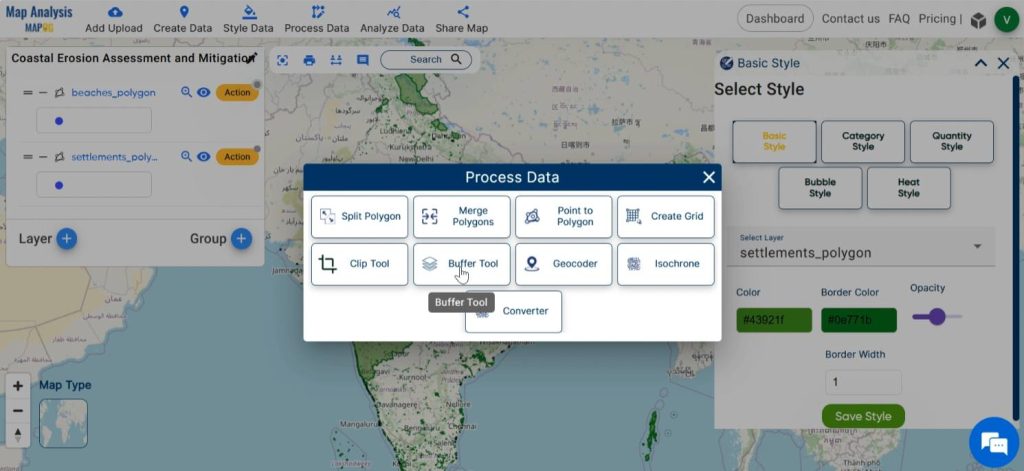
To determine the extent and severity of the erosion-affected region around the beach, we can generate a buffer. For this, navigate to Process Data and select the buffer tool.
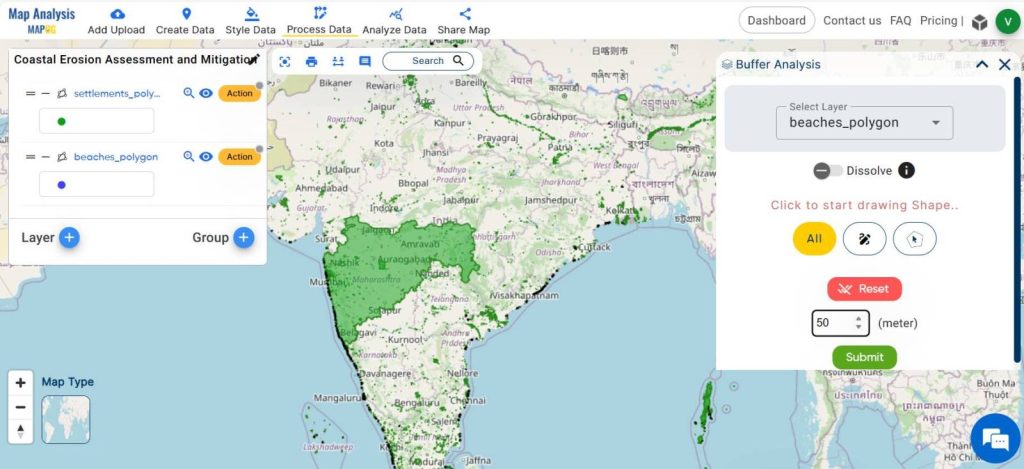
Choose the beach polygon layer and input suitable ranges for the buffer and click on submit. Here, we are creating buffers of 50m, 100m, and 500m.
To differentiate between the buffer layers, rename each layer with proper names. For this, click on the action menu next to the layer, then select the pencil icon. Enter proper names and click on Save.
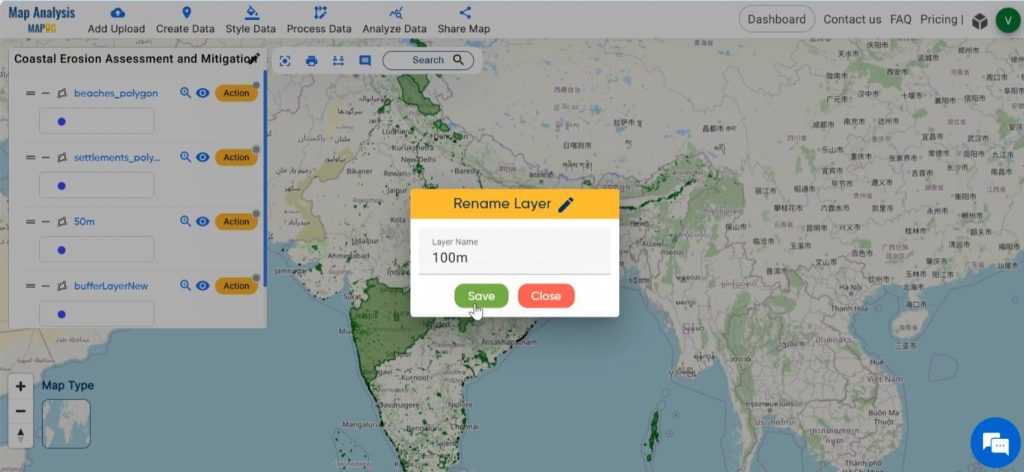
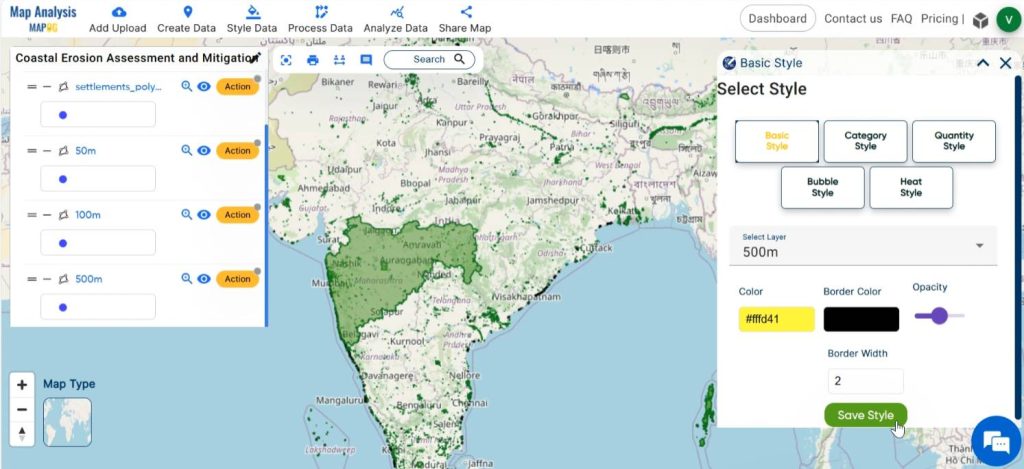
For enhanced visual clarity, apply appropriate colours to the buffer layers. To achieve this, click on Style data and then Basic Style. Choose the buffer layer you wish to style and select a suitable colour gradient. Once done, click on Save Style.
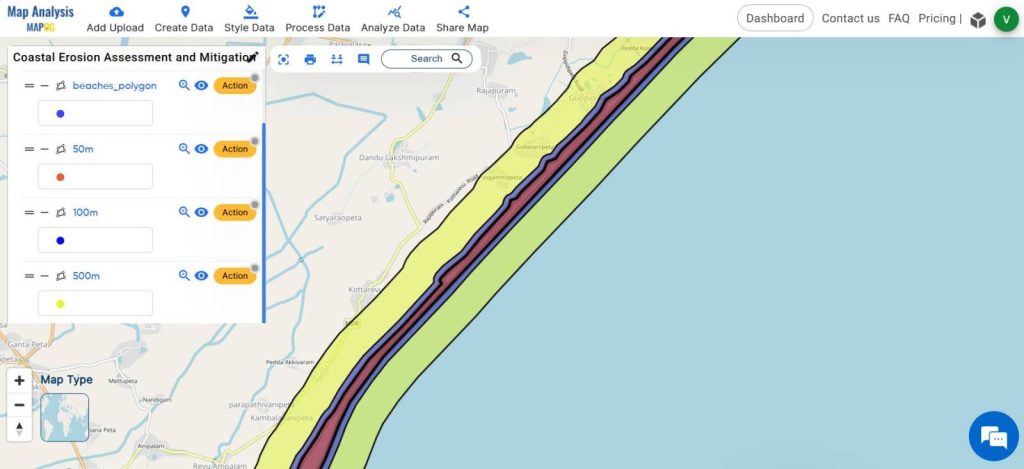
This map reveals that the red-coloured 50m zone denotes areas highly susceptible to coastal erosion. Conversely, the blue-coloured 100m buffer zone indicates regions with a lower immediate risk. Additionally, the wider 500m buffer zone includes areas potentially facing future erosion challenges, highlighting the necessity for proactive measures.
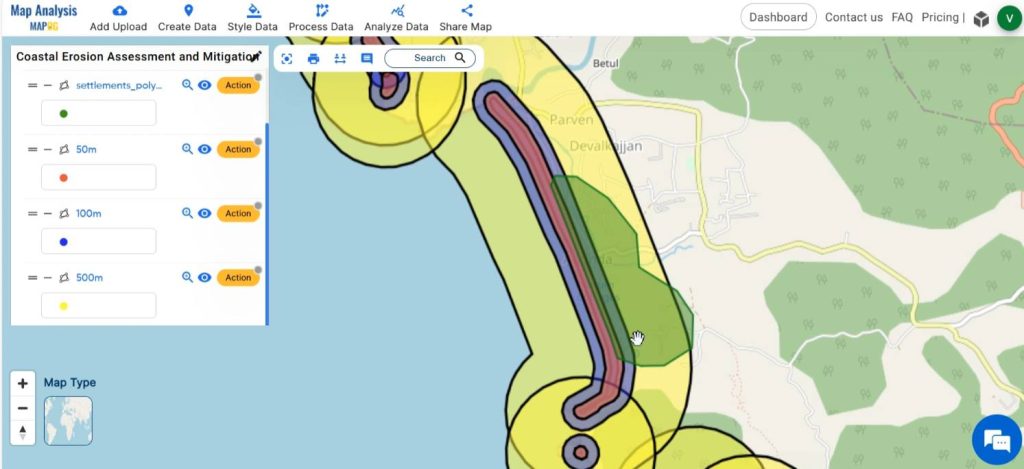
Some settlements are located in high-risk erosion areas, emphasising the urgency of implementing immediate protective measures such as constructing sea walls.
Step 6: create polyline layer
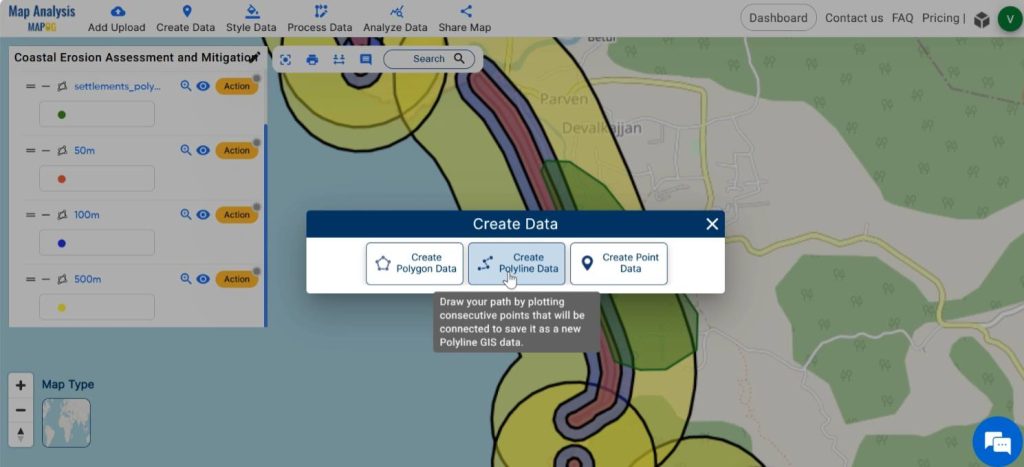
The sea walls that have to be employed for protection can be represented in the map using a line layer. For this click on Create Data and select Create Polyline Data.
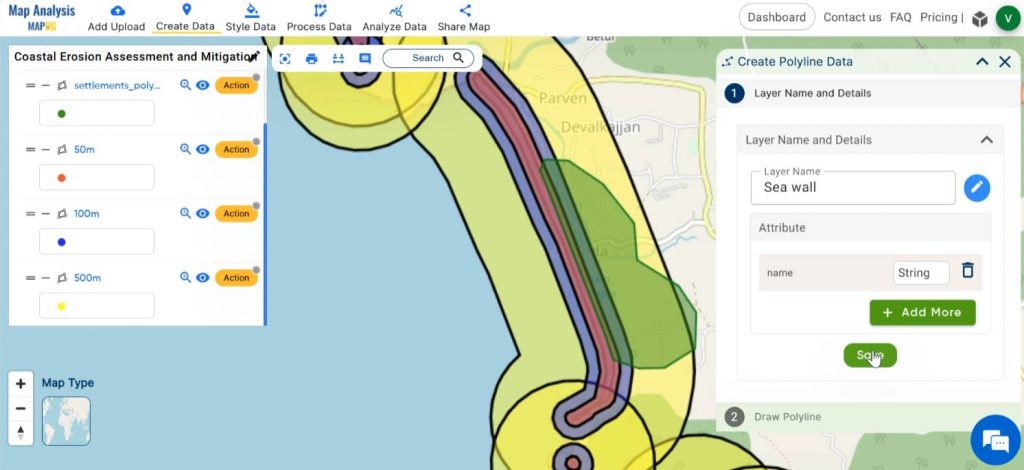
Give the polyline layer a suitable name and required attributes, then save it.
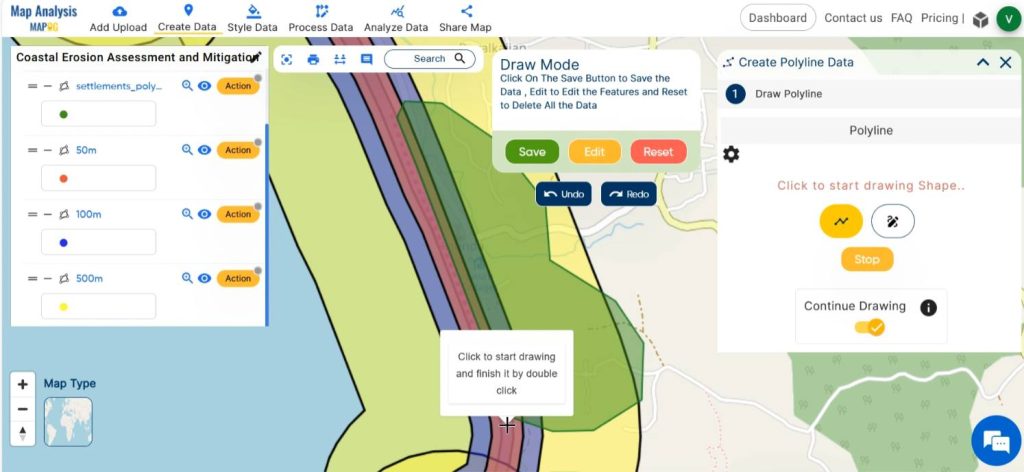
By enabling any of the icons in the dialogue box, draw the line between the beach and the settlements. Enable the Continue drawing, so that we can draw all the lines in the map uninterruptedly. And click on Add.
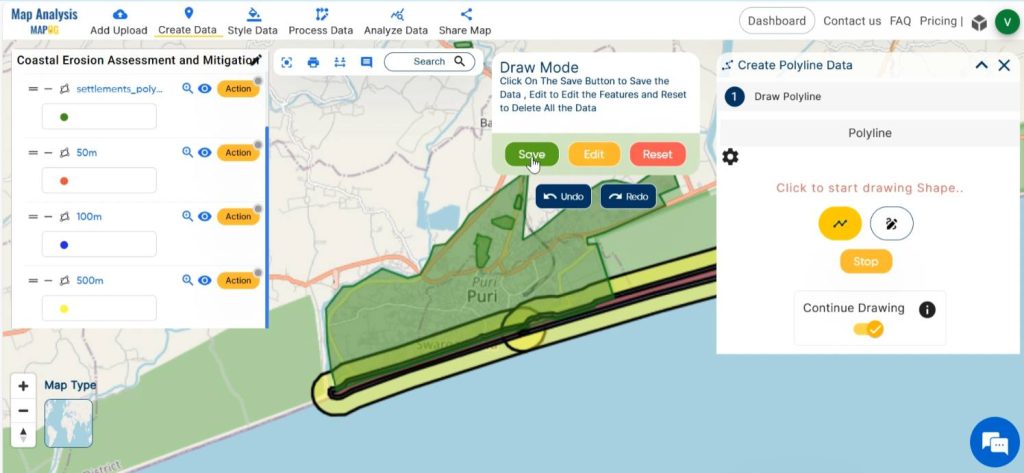
In the same way add as many lines needed to represent the sea wall. Finally save the line.
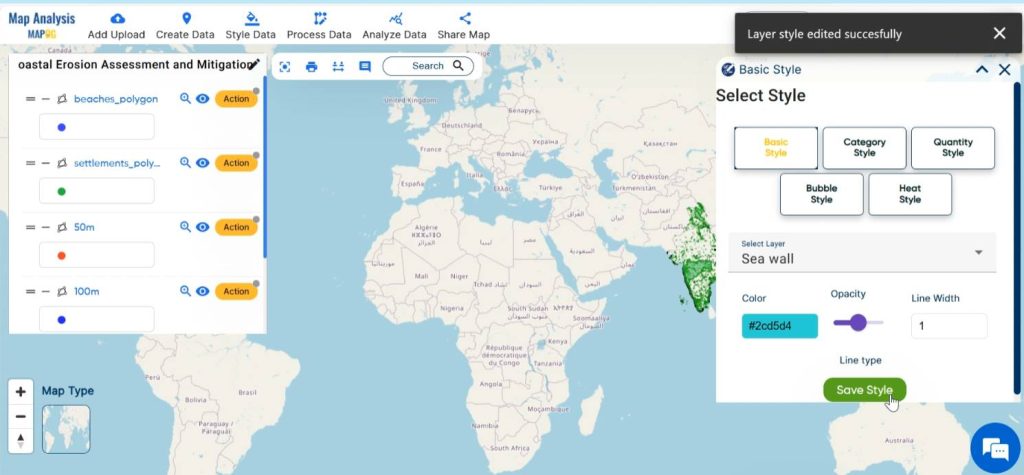
Style the layer with suitable colours using Basic Style.
Step 7: Measure the length of Sea wall
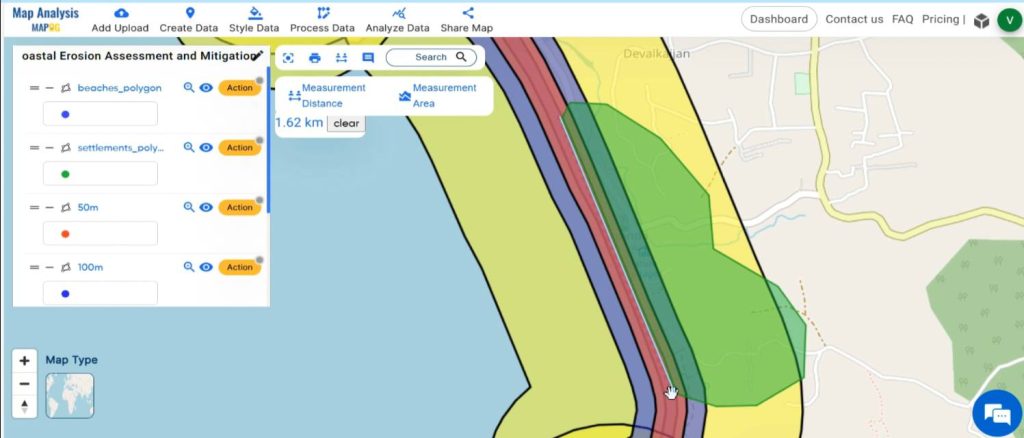
To measure the length of the protection wall, utilise the Measure tool near the AI search bar. Click on the Measure tool and select Measurement Distance. Then draw a line along the protection wall. The length of the protection wall will be displayed. Do the same for all lines created.
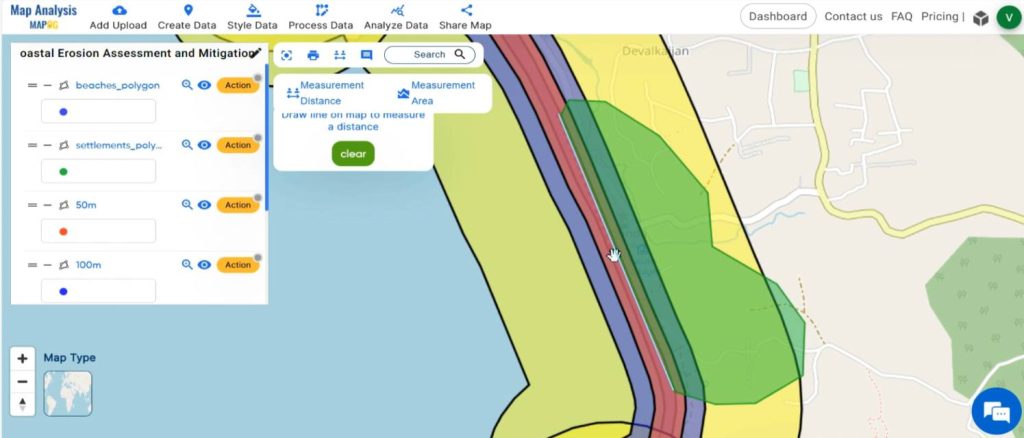
Finally, we have generated a map outlining coastal erosion-prone areas near beaches, pinpointing regions requiring immediate protective measures. Furthermore, we’ve determined the lengths of protection walls necessary for construction.
Step 8: Share Map
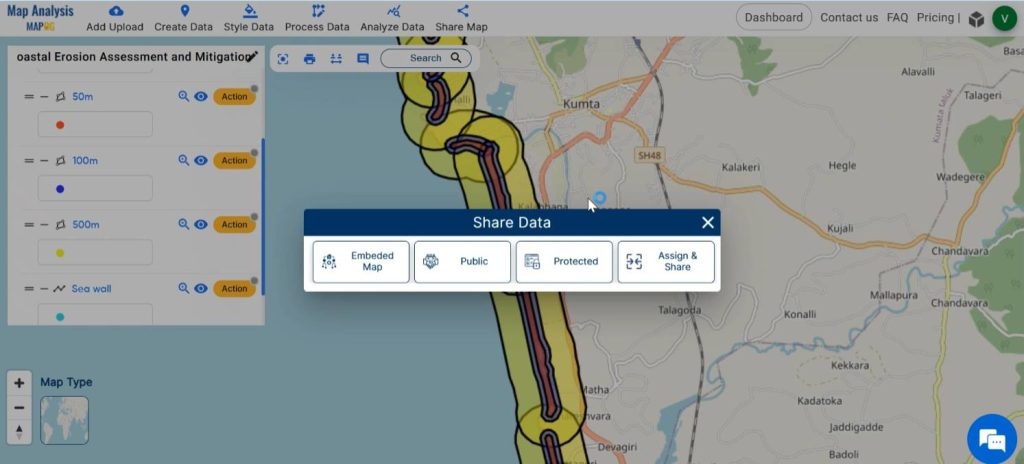
Using the Share tool, share the map or post it on social media.
Major Findings of Creating Map for Coastal Erosion Assessment and Mitigation
- Identification of high-risk erosion zones: The map highlights areas susceptible to erosion along the beachfront, providing crucial information for risk assessment and management.
- Location of regions requiring sea walls: Specific areas where sea walls are needed for protection against erosion are clearly marked, aiding in the strategic planning.
- Data-driven decision-making: The map facilitates informed decision-making by providing a visual representation of coastal erosion risks and the necessity for protective infrastructure such as sea walls
- Enhanced preparedness and resilience: With the delineation of erosion-prone areas and identification of regions requiring sea walls, stakeholders can proactively address coastal erosion challenges, enhancing community resilience to coastal hazards.
Industry and Domain
- Coastal communities: Residents living in coastal areas benefit from improved understanding of erosion patterns and the implementation of effective mitigation measures.
- Government Agencies: By identifying vulnerable areas government bodies responsible for coastal management can make informed decisions.
- Environmental conservation organisation: Identifying and prioritising areas for coastal conservation helps in designing strategies for sustainable coastal management.
- Infrastructure Developers: This data facilitates site selection, risk assessment, and the incorporation of environmental considerations into infrastructure planning and design.
- Insurance industry: Helps in setting insurance premiums, estimating potential losses, and developing risk management strategies to protect both insurers and policyholders.
Conclusion–Create Map for Coastal Erosion Assessment and Mitigation
In conclusion, by harnessing the power of MAPOG tools, this mapping initiative for coastal erosion assessment and mitigation provides a valuable tool for policymakers, coastal managers, and communities to make informed decisions aimed at safeguarding our coastal environments for future generations.
GIS Data Links
Explore more content on our blog:
Protecting Wetlands: Guide to Create GIS Map for Nature
GIS Analysis in Urban Planning: Reshaping Transportation Future Insights of state/city
Fast Emergency Response: Using GIS and Isochrone Maps for 10-Minute Ambulance Arrival