Pollution sites consistently pose threat to human welfare, primarily by directly causing numerous health issues and by contaminating vital natural resources. In many regions the presence of quarries exacerbates this threat. For monitoring pollution impact analysis around quarries, the initial step is to identify the areas affected by quarries. And then assess the extent of impact in each region. For this we can Create map for pollution impact analysis around quarries using MAPOG tools –clip tool and buffer tool.
Key Concept- Create Map for Pollution impact analysis
Clip tool helps to cut out an input layer to the extent of our interest and thus helps to focus our analysis on quarries of specific regions. Thus, helps to isolate relevant data for examination. With the Buffer tool in MAPOG we can create buffer zones of different distances around pollution sites like quarries, which allows us to assess the potential impact of pollution sites.

Step-by-Step Process for Creating map for Pollution Impact Analysis
Step 1: Open Map Analysis tool
Open Map analysis interface from the MAPOG platform.
Step 2: Add Quarry polygons
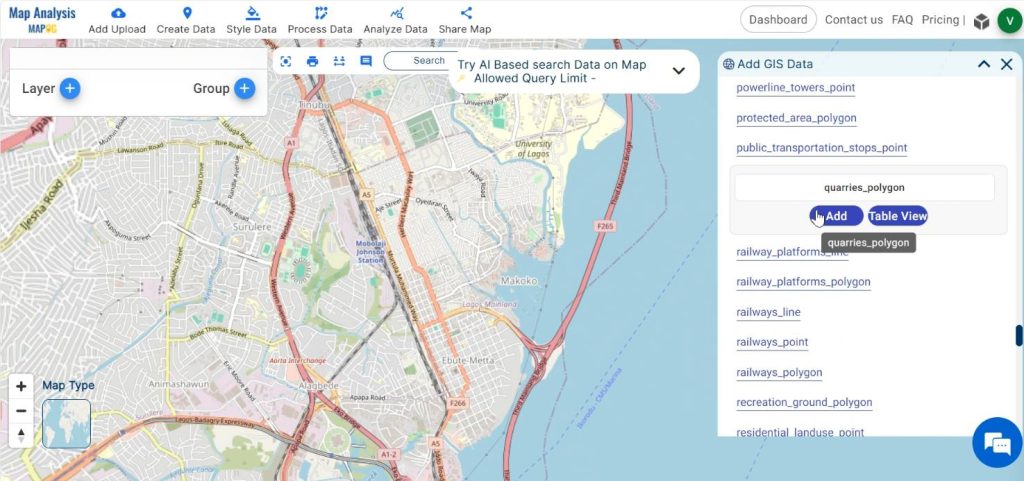
Within the MAPOG interface, navigate to the top and choose the “Add Upload” tool. opt for Add GIS data and then select the country.
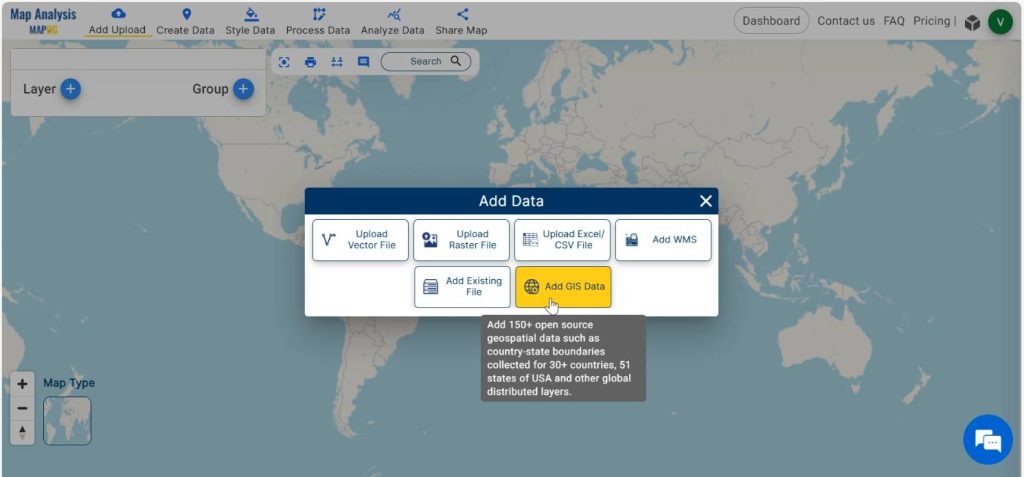
Then, add quarry polygons from the In-built GIS data in MAPOG.
Step 3: Save Map
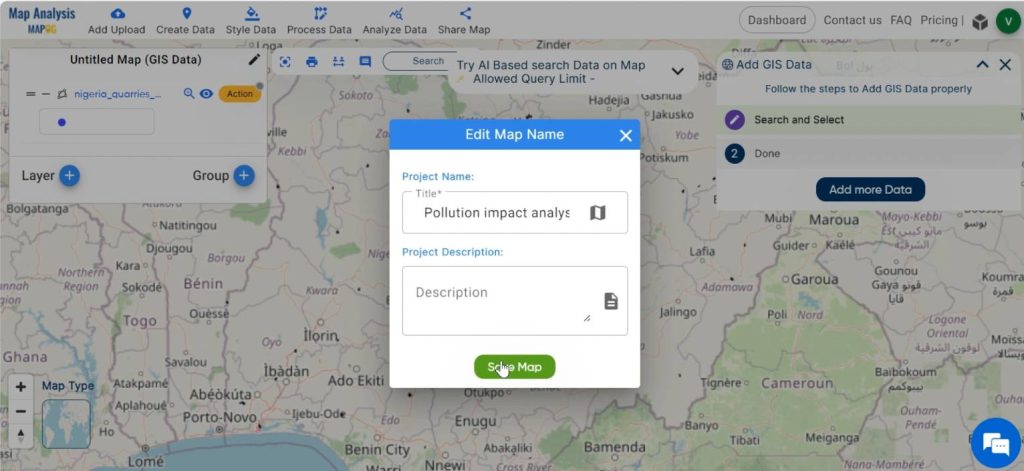
To save your map, simply click on the pencil icon located next to the ‘Untitled Map’ text. In the dialog box that appears, enter appropriate names and descriptions. Then, click on the ‘Save Map’ option. Your project will be saved.
Step 4: Clip the layer
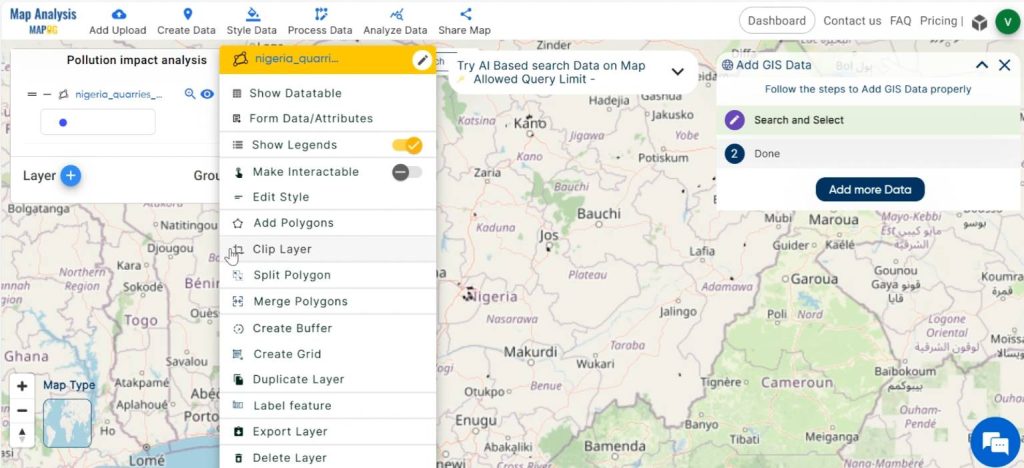
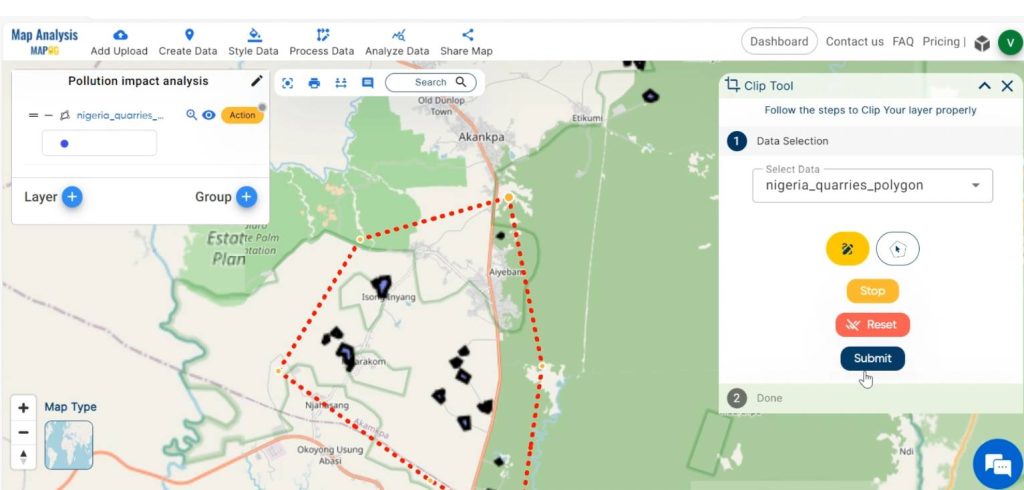
In order to extract out the specific region of our interest. Select the clip tool either from the Process data tool or by clicking on the option “Action” at the right of the layer.
In the dialogue box opened, “select data” as the layer to be clipped. Click on the pencil or polygon icon and draw a polygon around the quarry polygons which is considered for analysis. Then click on “submit”.
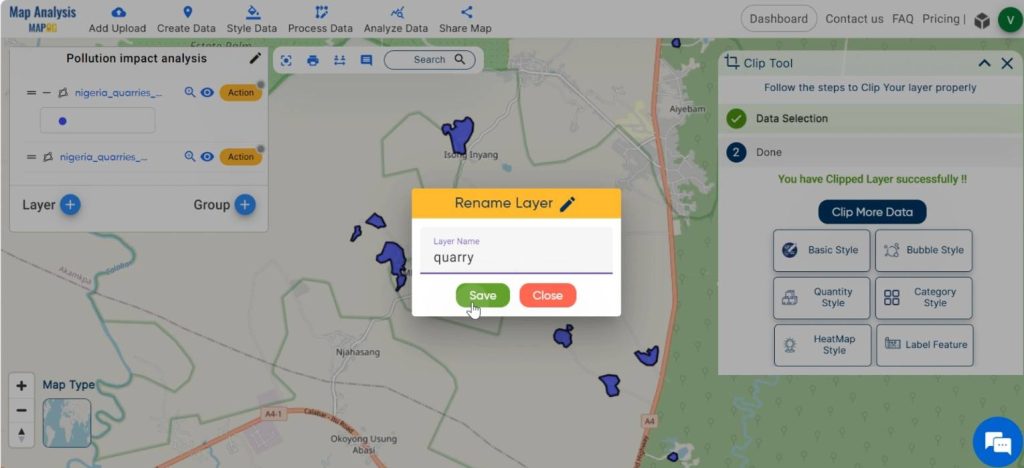
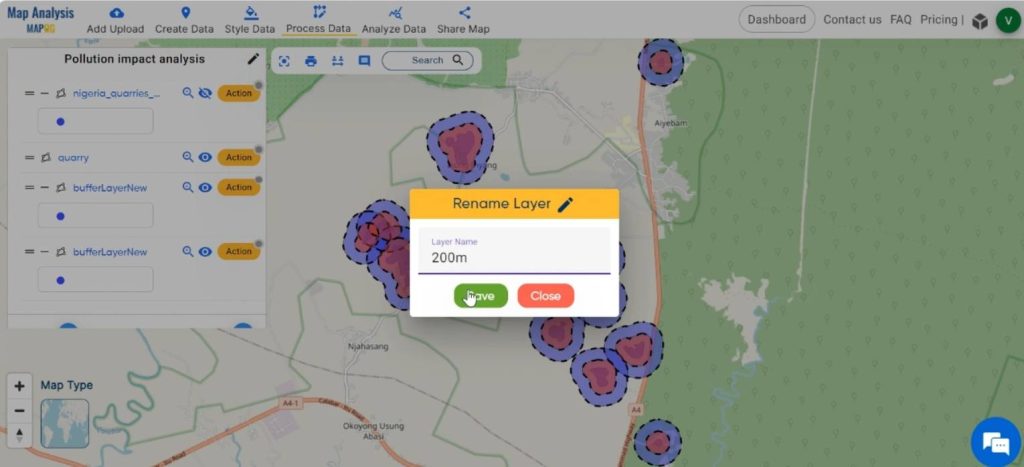
Rename the new clipped layer, by clicking on the pencil icon in the Action.
Step 5: Create Buffer Zone
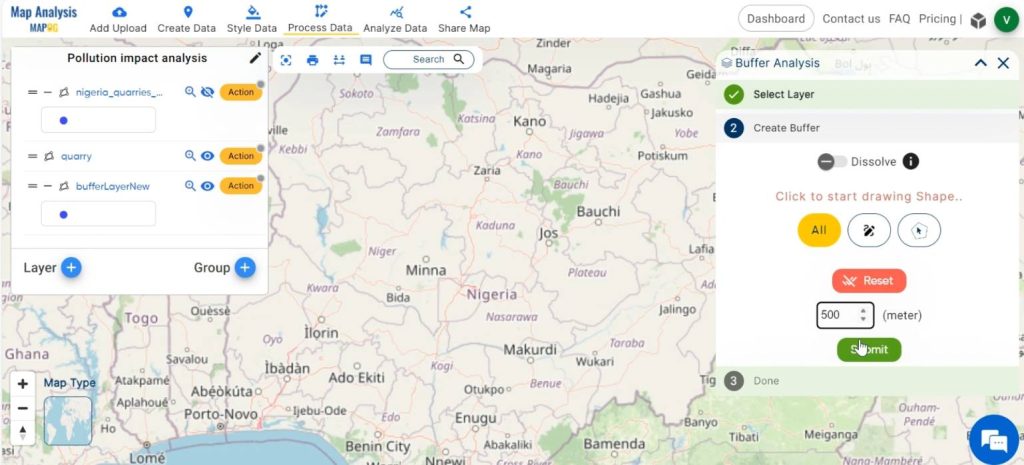
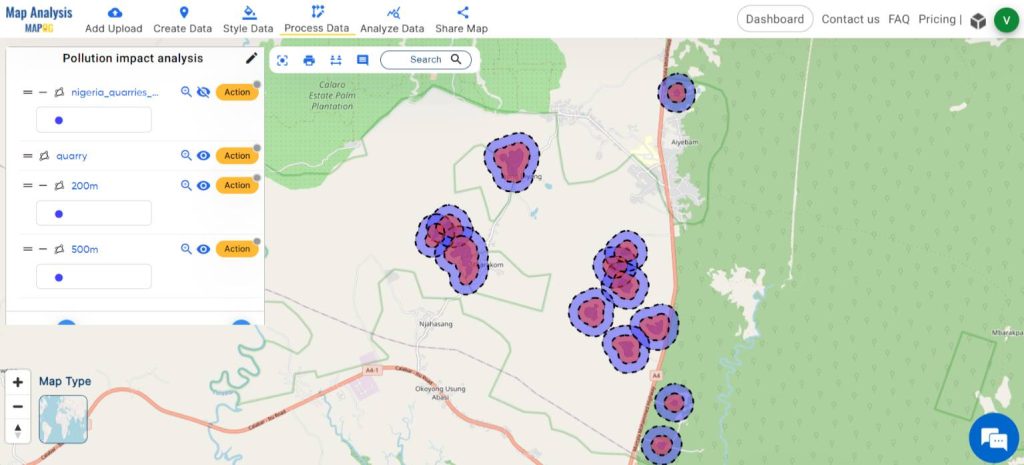
Create buffer zones around Quarry polygons either by enabling the “Buffer tool” from “Process data ” or selecting “Create buffer” option from the “Action”. Give the values of range as 200-meter, 500-meter etc. Click on “Submit” option.
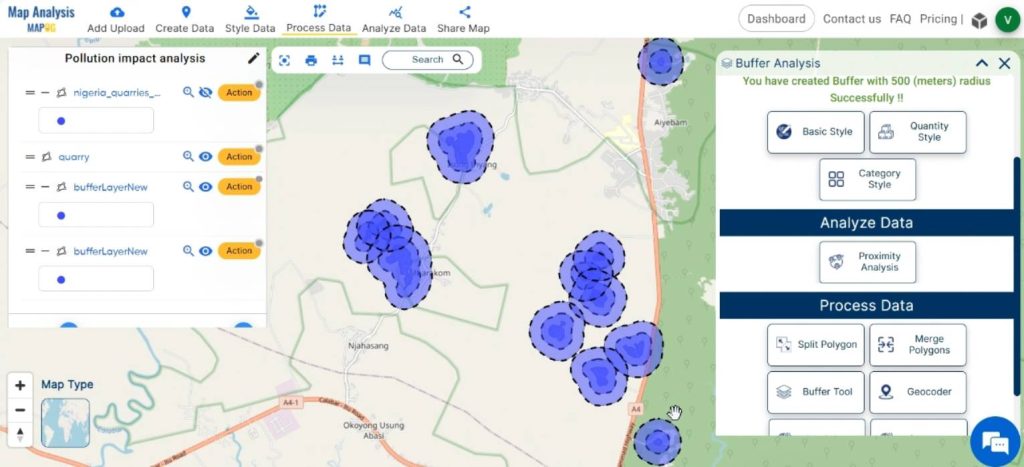
Now the buffer zones have been created.
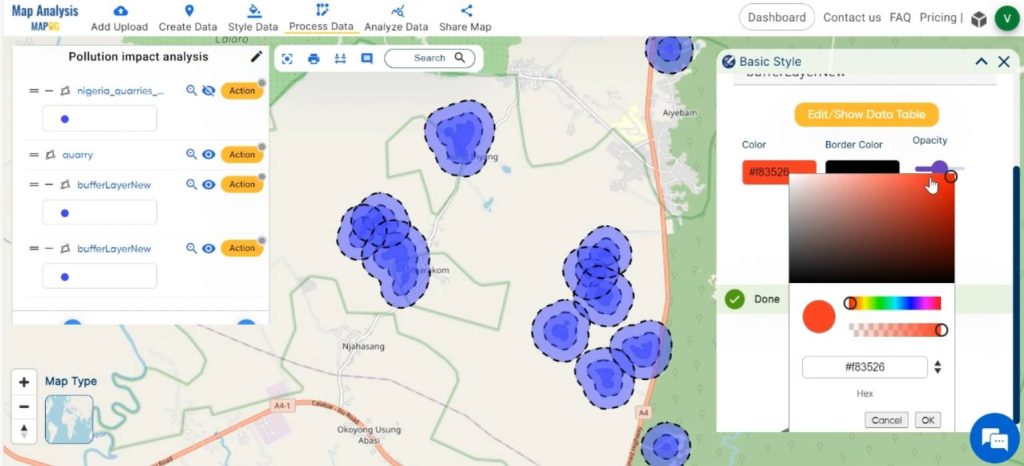
Step 6: Styling and Finalization
Using the Basic style, style the buffer zones with suitable colors to differentiate between them.
Do the final adjustments, like renaming the buffer layers.
Now, the map delineates the hazardous zone around quarries pointing out to the pollution impacted regions.
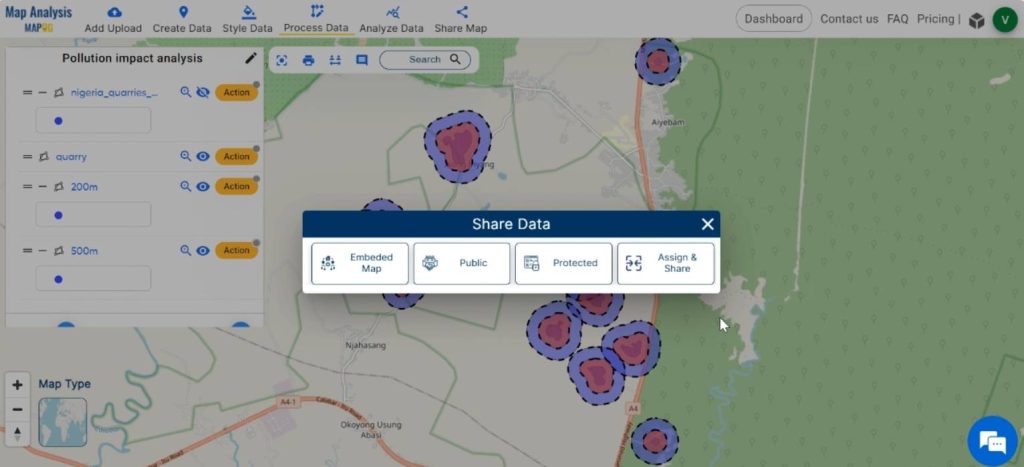
Step 7: Share the map
At last, share the map to your friends or post it on social media using the share tool.
Major Findings– Create Map for Pollution impact analysis
The major findings obtained from pollution impact analysis using MAPOG are listed below:
- Environmental Protection: Helps to identify the extent of environmental degradation caused by quarrying activities. And thus helps to implement measures to protect sensitive ecosystems, wildlife habitats, and natural resources from further damage.
- Health Risk Assessment: Identifying impact zones helps health officials to mitigate risks associated with exposure to these pollutants.
- Resource Management: They can implement conservation measures to safeguard these vital resources like soil and water for future generations.
- Urban Planning: They can minimise conflicts between residential or commercial development and industrial operations, thereby promoting sustainable urban growth.
- Community Awareness and Engagement: Mapping impact zones raises awareness among local communities living near quarries.
- Regulatory Compliance: By quantifying the spatial extent of environmental impacts, regulatory agencies can enforce measures to mitigate these impacts and hold quarry operators accountable for their environmental responsibilities.
In summary, MAPOG‘s tools have been crucial in delineating the impact regions surrounding quarries and thus for decision-making and effective management of quarrying activities and their associated impacts.
Domain and Industry– Create Map for Pollution impact analysis
The major beneficiaries of this analysis include:
Health officials: Identifying hazardous zones around pollution sites allows them to assess and mitigate potential health risks posed to nearby communities.
Local government: It helps them to ensure the safety of the public by regulating quarry operations in compliance with environmental standards and helps in making informed decisions about infrastructure development, land use policies, and emergency response planning.
Urban planners: By understanding the spatial distribution of hazardous zones, planners can avoid siting residential, commercial, or recreational facilities in high-risk areas associated with quarrying activities.
Planters/ farmers: By identifying areas where soil and water quality may be compromised by quarry-related pollution, farmers can take measures to mitigate risks and protect their crops from contamination.
Groundwater departments: By mapping hazardous zones and monitoring groundwater quality in proximity to quarries, groundwater departments can identify areas at risk of contamination and implement measures. Thus, enabling them to protect and preserve groundwater resources.
Conclusion– Create Map for Pollution impact analysis
In conclusion, MAPOG platform offers a powerful approach for tracing out the hazardous zone around pollution sites like quarries. Thus, this knowledge serves as a foundation for identifying impact zones around quarries for protecting the environment, safeguarding public health, promoting sustainable resource management, facilitating urban planning, fostering community engagement, and ensuring regulatory compliance.
Link To Data
Other Articles
- Protecting Wetlands: Guide to Create GIS Map for Nature
- GIS Analysis in Urban Planning: Reshaping Transportation Future Insights of state/city
- Fast Emergency Response: Using GIS and Isochrone Maps for 10-Minute Ambulance Arrival
- Mapping Tiger Attack Hotspots – Create an Online Map and Share
- Make Routes for Military Aerial Planning- Through Bearing angle and Distance calculation – Online Route Compass
- Mapping Healthcare Efficiency: GIS Buffer Analysis of Hospital Locations
- Add WMS- Two step online view of WMS layer on a map
- Plot ATM locations on a map and embed on your website
- Map habitat locations of endangered animals & keep track of their living