Create Map on Literacy Rate, where we explore literacy rates using MAPOG, unraveling the stories behind the numbers. Literacy rate refers to the percentage of people in a given area who can read and write, a crucial measure shaping our understanding of educational landscapes.
Key Concept on Create Map on Literacy Rate:
One can use MAPOG to transform raw data into a visual story, bringing a clear understanding of the intricate world of literacy rates. Links to the data are provided at the end of this article. Also, check our other blog GIS Analysis in Urban Planning: Reshaping Transportation Future Insights of state/city.
Steps to Create Map on Literacy Rate:
Step 1:
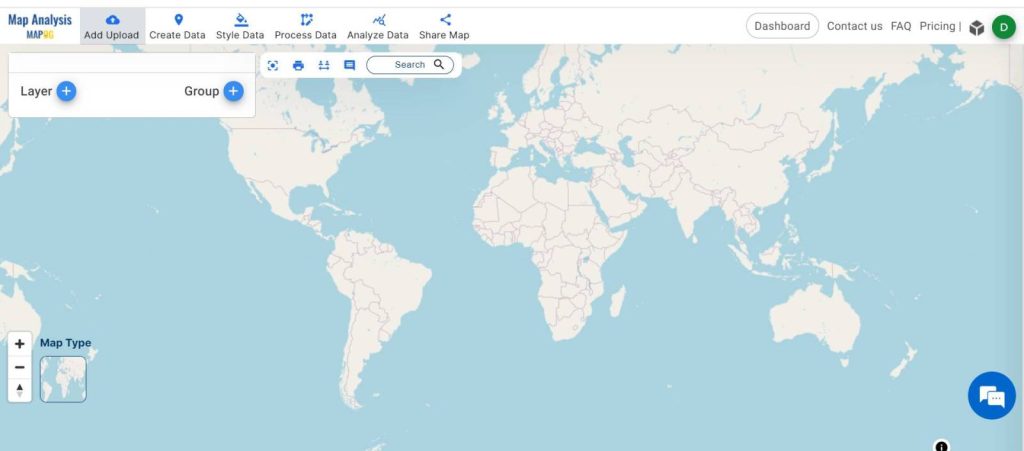
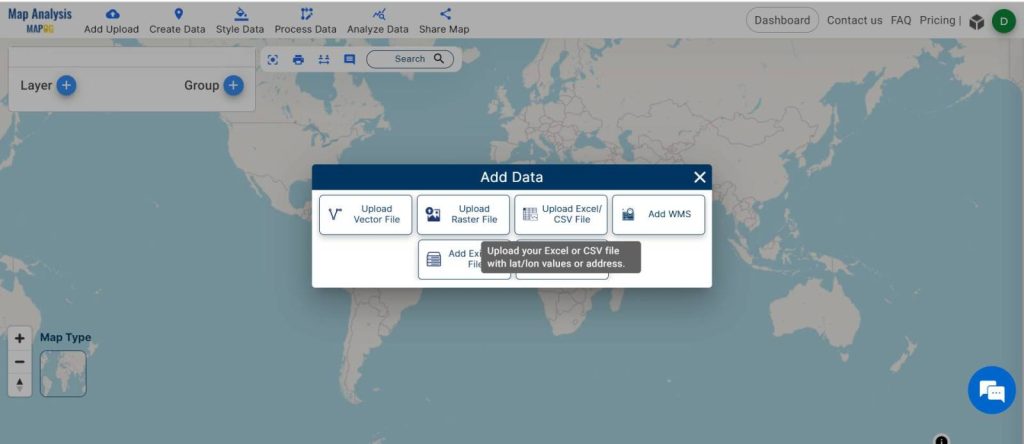
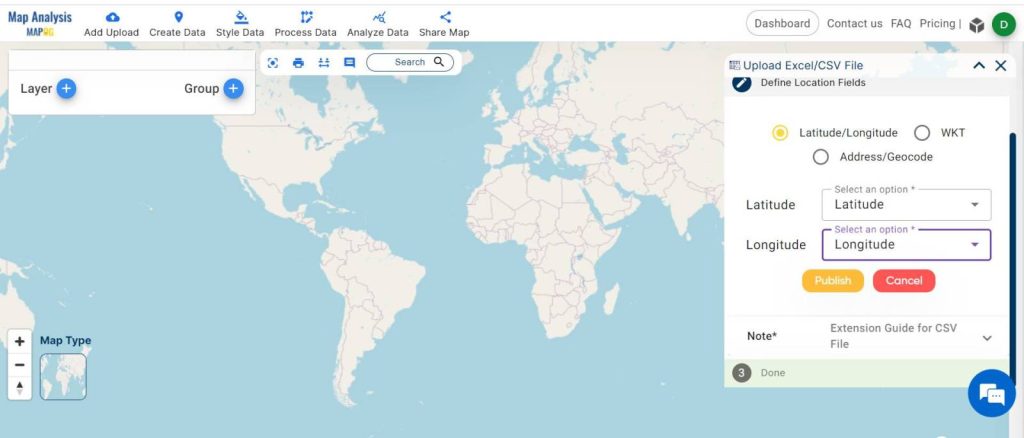
First, open the ‘MAPOG Map Analysis interface. From the menu toolbar, go to ‘Add Upload’, then click on ‘Upload Excel/CSV File’.
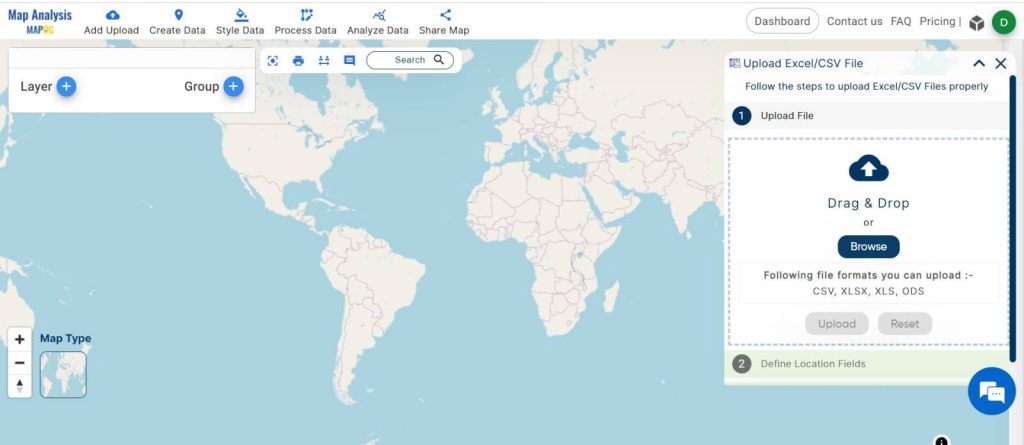
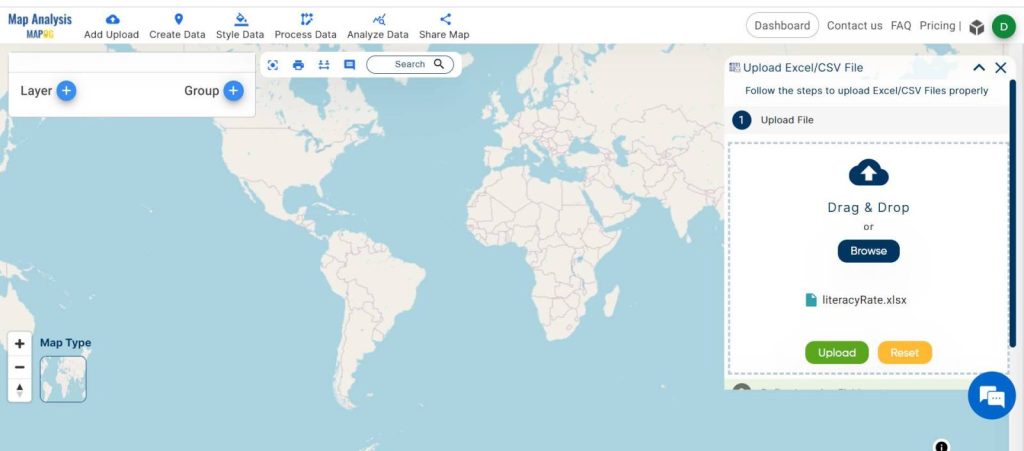
Now, browse and select your Excel or CSV file containing latitude and longitude data and ‘upload’.
Choose the latitude and longitude option. Now Publish One can also choose the WKT or Address/Geocode option from here. However, this data must be included in the raw data.
Step 2:
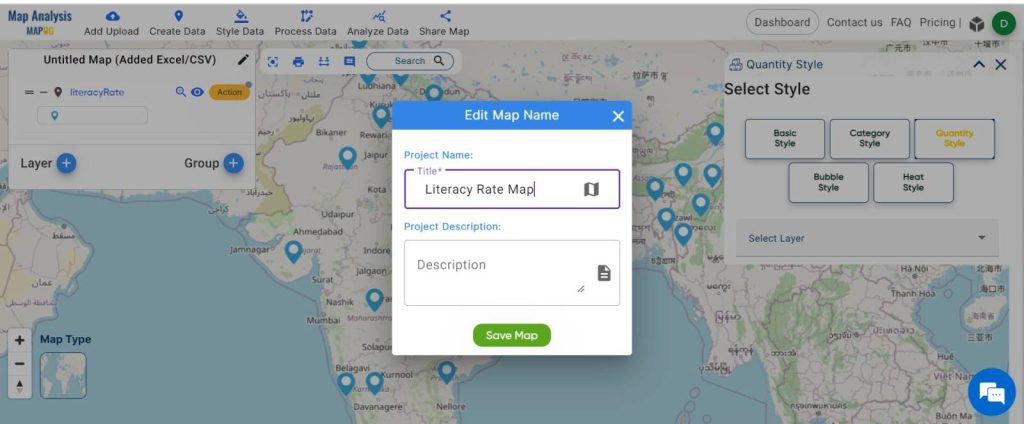
Let’s give a suitable name to the layer from the ‘Edit Map Name’ section. And ‘Save map’.
Step 3:
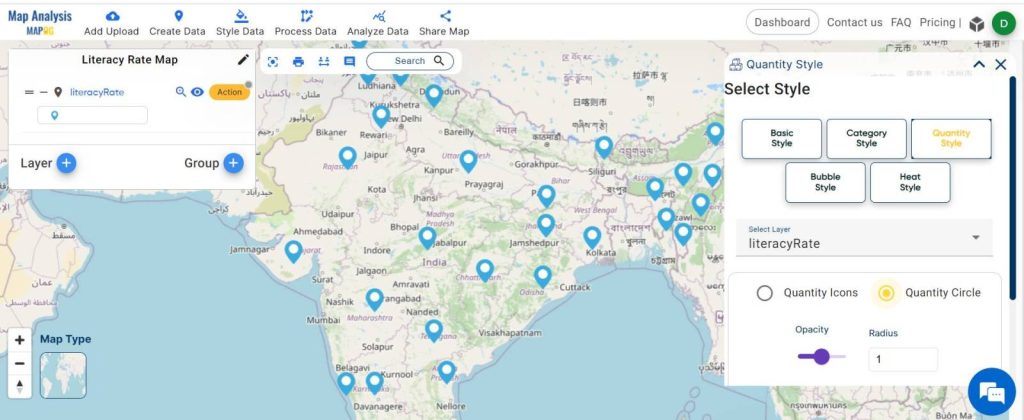
Next, go to ‘Style Data‘ in the menu toolbar and click on ‘Quantity Style‘.
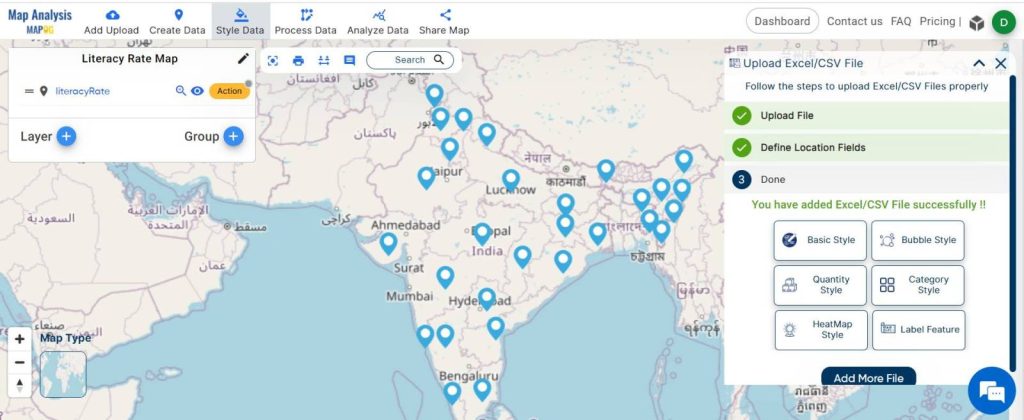
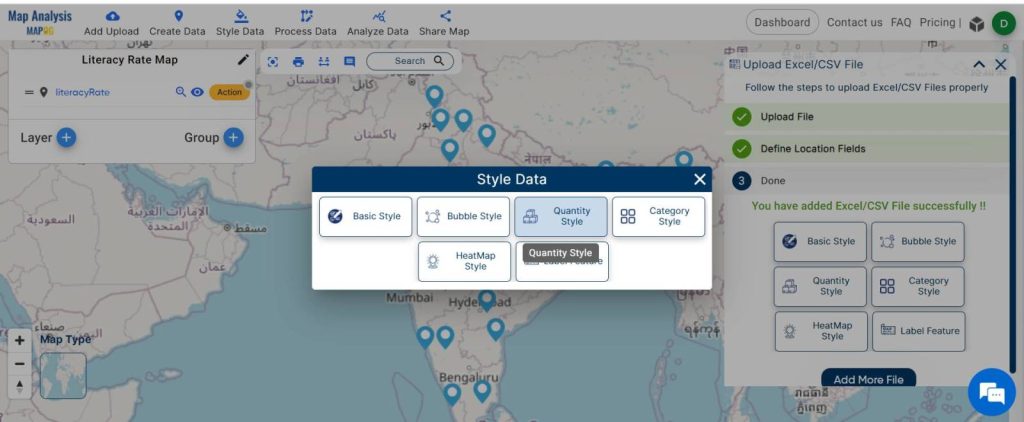
Select the layer for which you want to apply the quantity style. Choose ‘quantity circle’. One can also choose ‘Quantity Icons’.
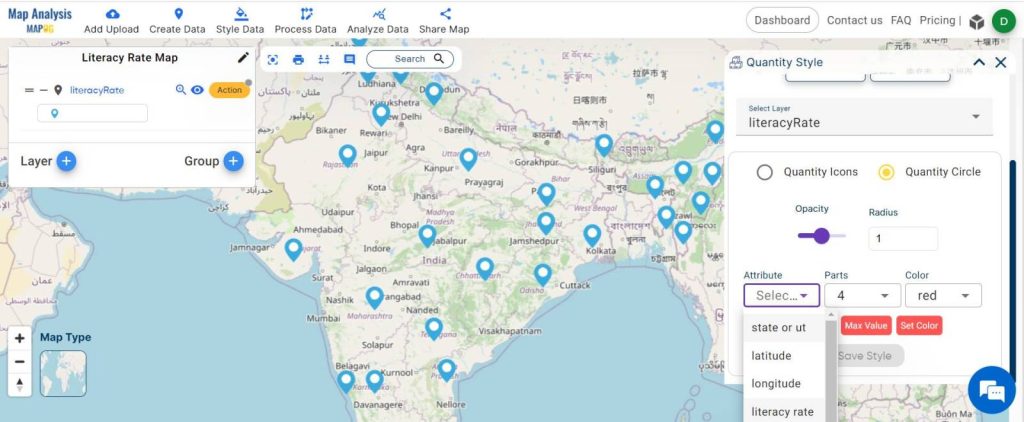
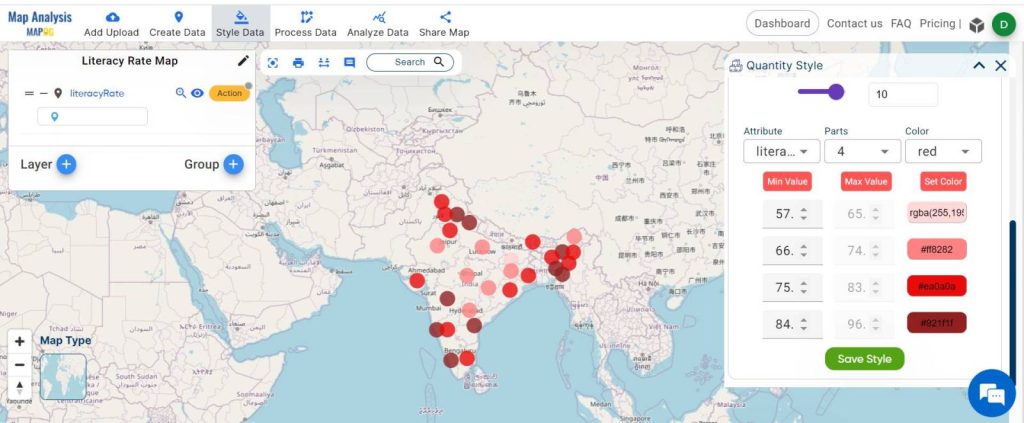
Then, select the attribute ‘literacy rate’ to define the style. Specify the number of parts, and customize the color and shades. Set minimum values as per your data and adjust the circle radius. Once done, click Save Style to add the layer style successfully.
Step 4:
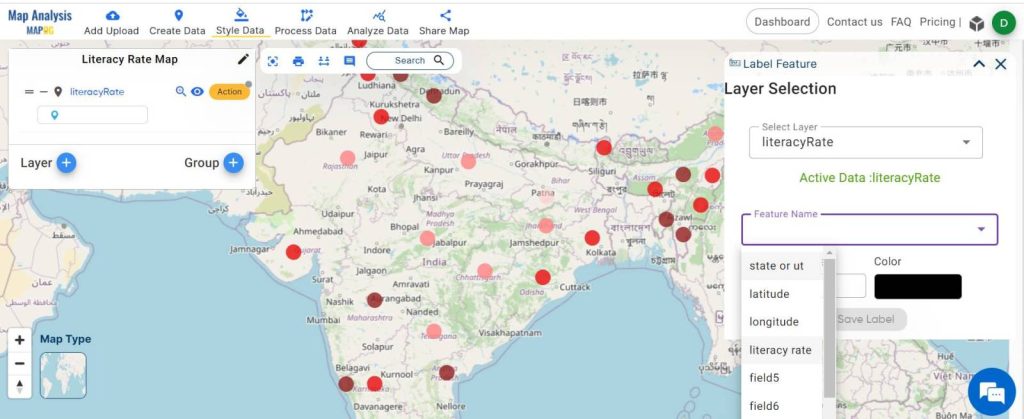
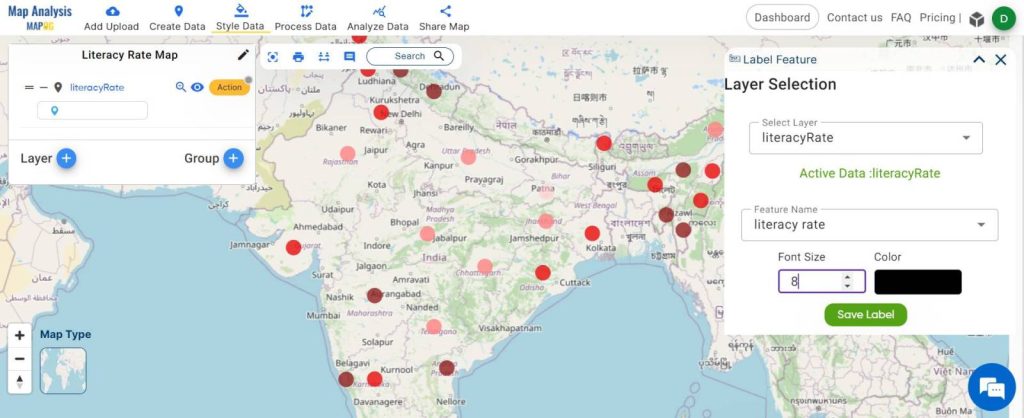
Proceed to label the features by going to Style Data in the menu toolbar and selecting ‘Label Feature‘.
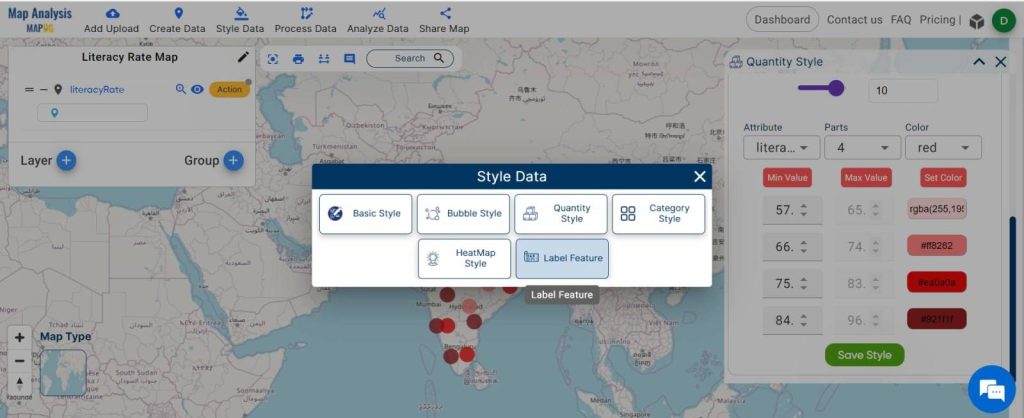
First, select the layer, then select the feature ‘literacy rate’, adjust the font size, and modify the color. After making these selections, click Save Label to add the label feature.
Step 5:
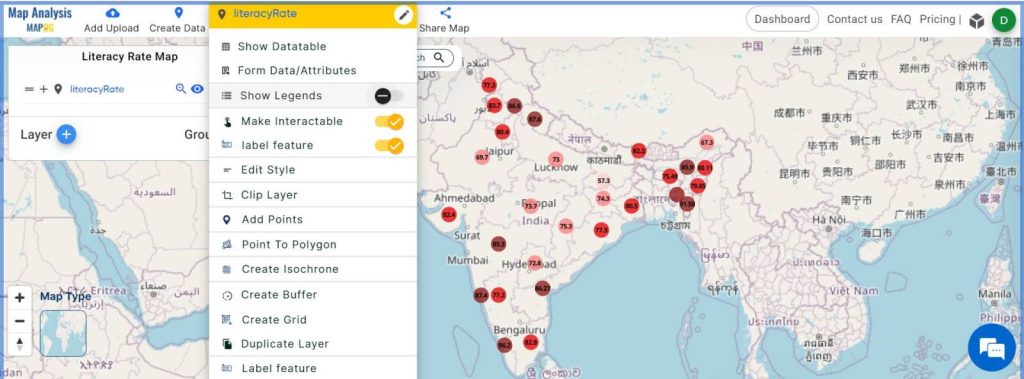
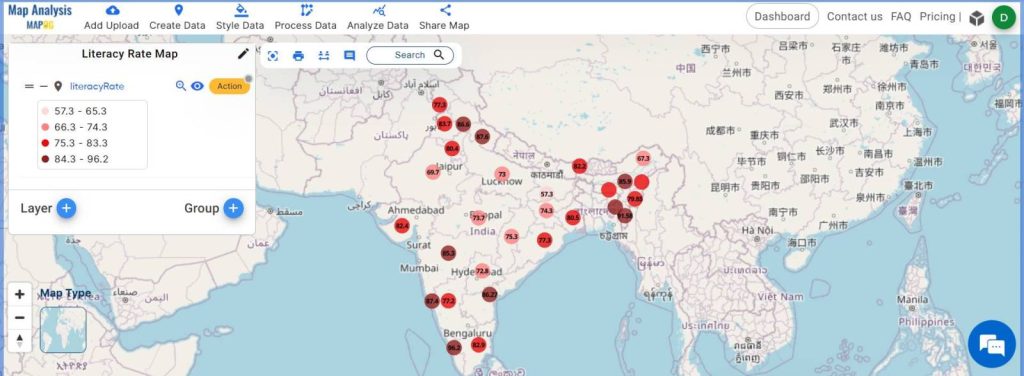
One can see the legend, just go to the action button and select the ‘Show legend’ option. The legend is now showing.
The final output map illustrates the literacy rate of an area, with dark colors indicating higher literacy rates and lighter shades denoting lower literacy rates. The labels allow for easy interpretation. You can see the literacy rate values from here.
Major Findings:
- The map speaks volumes with its circles – dark ones mean better literacy and lighter ones mean there’s room for improvement.
- Each circle shows the exact literacy rate percentage, making it crystal clear.
- Use the legend for quick insights – dark colors are good, and light colors need attention, helping us identify areas for educational growth.
Industry and Domain Impact:
- Industries, particularly education and urban planning, significantly benefit from Literacy Rate Mapping’s work.
- The maps, highlighting literacy rates, offer valuable insights for informed decision-making.
- In education, it aids in shaping policies, while in urban planning, it contributes to strategic development.
Conclusion to Create Map on Literacy Rate:
Whether you navigate the landscape of education, urban planning, or any sector seeking clarity, MAPOG stands as your ultimate guide. It simplifies complexity, helping design a better and brighter world.
1 thought on “Create Map on Literacy Rate”