Welcome to an insightful exploration of education accessibility through comprehensive map analysis using MAPOG. In this journey, we focus on school district coverage, using a Country as an example. Our purpose is to employ Buffer Analysis, as indicated in our topic Create Map – School Map Area Coverage Through Buffer Analysis, to unveil areas with limited access. By doing so, we aim to provide valuable insights for educational planning and resource allocation, contributing to the enhancement of educational landscapes, particularly in regions like Somalia. Join us as we navigate this mapping journey to foster inclusive and informed education access.
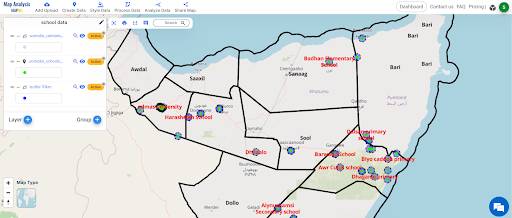
Key Concept – School Map Area Coverage Through Buffer Analysis
This article provides a step-by-step guide on utilizing the MAPOG Map Analysis tool, with a focus on school coverage in Somalia. The links for GIS data which we are using here are provided at the end of the article. The straightforward guide empowers users to navigate the tool effectively for insightful education planning. In addition to its applications, MAPOG offers versatile use cases in various domains such as environmental conservation and disaster management.
Buffer Tool
Buffer analysis is a geographic analysis technique used in GIS to create a zone or area around a feature based on a specified distance or radius. This zone, known as a buffer, is useful for studying spatial relationships, proximity, and impact assessment.
How to Steps for Create Map To Review School Map Area Coverage Through Buffer Analysis
GIS data links –
Step 1: Accessing the Analysis Tool
Enter the MAPOG analysis tool to initiate the mapping process. Navigate through the platform’s interface to locate the essential features for school district coverage in Somalia. (Disclaimer: This data we are taking for reference and will be considered only for taking it as an example which was been added through Open Street Map Data).
Step 2: Uploading / Adding GIS Data for Creating Map to review School coverage through Buffer Analysis
- Click on ‘Add Upload’ within the analysis tool. From the options presented, select ‘Add GIS Data. Search for the country and data for analysis in GIS data tool and click on the ‘add’ button for analysis
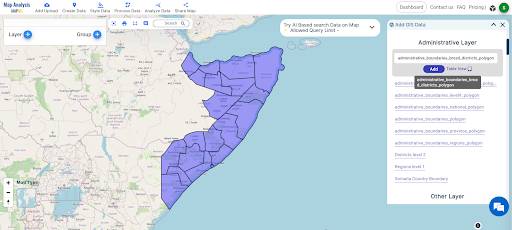
- Click on the “Add” button on the left side to add the District layer of Country selected (as an example) to the Map Analysis section.
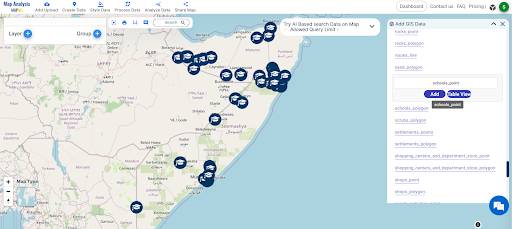
Click on the “Add” button on the left side to upload the School layer of a Country from Add GIS Data to the Map Analysis section.
Step 3: Customizing Dataset Styles
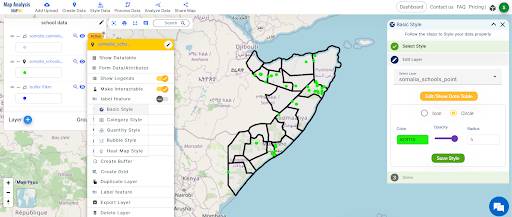
Refine your analysis by customising the visual representation of Country school district data. Click the action button and select ‘Edit Style’ to tailor the appearance of datasets according to your specific preferences. This step ensures a personalised and clear presentation of the mapped information
Step 4: Labelling Key Points
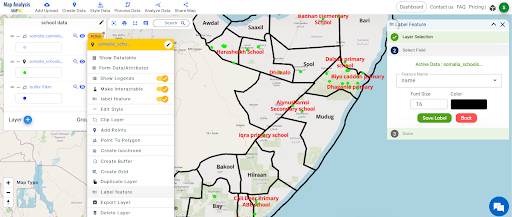
Enhance your understanding by labelling key points on the map. Click the action button associated with the desired layer, then choose ‘Label Feature.’ This action provides a clearer depiction of school district boundaries and relevant information within the Country context.
Step 5: Generating Buffer Zones
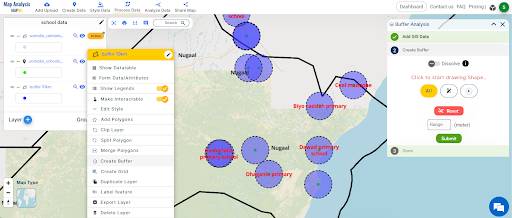
In the next step, create buffer zones around school points Layer Created. Select the layer, click ‘Create Buffer‘ from the action menu, and set parameters like distances (e.g., 5km, 10km) for detailed spatial insights into the educational landscape.
Step 6: Rename Layer
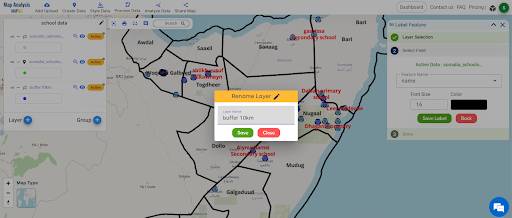
Rename your layer by clicking the action button, then select the pencil icon to edit the layer name.
Step 7: Save and Rename Your Project
Save your project by clicking the pencil icon above the action button, where you can also rename your project for better understanding.
Major Findings – School Map Area Coverage Through Buffer Analysis
- Identify regions with limited educational access.
- Obtain data for informed resource allocation.
- Highlight areas requiring strategic educational planning.
- Understand spatial connections within the educational landscape.
- Recognize patterns in educational coverage across different areas.
- Inform interventions to address specific educational needs.
- Facilitate decisions based on concrete data regarding access and coverage.
- Use findings to engage communities in improving educational accessibility.
In summary, these step-by-step actions enable users to conduct a thorough buffer analysis, revealing crucial insights into limited access areas and facilitating strategic decision-making for educational planning and resource allocation in country.

The analysis of school district coverage using buffer analysis in a specific area, such as A Country District, holds several practical uses:
- Resource Allocation: By identifying areas with limited educational access, this analysis aids in targeted resource allocation, ensuring that educational resources are distributed efficiently to areas in need.
- Infrastructure Planning: The spatial insights obtained can inform the planning of educational infrastructure, helping authorities prioritize the construction of schools and other facilities in areas with insufficient coverage.
- Access Improvement: The analysis highlights regions with restricted access to schools. This information is crucial for policymakers and educators to develop strategies for improving access, such as implementing transportation solutions or establishing new educational centers.
- Informed Decision-Making: The visual representation of school district boundaries and relevant information enhances decision-making processes. Policymakers can make more informed choices regarding education policies, funding, and interventions based on the identified patterns.
- Government Reporting: The insights derived from the analysis can be used in official reports to government bodies, NGOs, and international organizations. This reporting aids in securing funding and support for initiatives targeting educational improvement in specific regions.
- Strategic Planning: The creation of buffer zones helps in strategic planning by revealing the spatial relationships and coverage patterns. This information is valuable for devising long-term plans that address the unique challenges of each region.
- Monitoring Progress: Periodic re-analysis using the same methodology enables the monitoring of progress over time. Decision-makers can assess the impact of interventions and adjust strategies based on changing educational needs in different areas.
Domain and Industry – School Map Area Coverage Through Buffer Analysis
This tool finds application in education planning, providing a practical solution for understanding access disparities. Industries involved include education, urban planning, and governmental organizations aiming for informed decision-making.
Conclusion – School Map Area Coverage Through Buffer Analysis
In conclusion, MAPOG‘s map analysis tool proves to be a valuable asset for enhancing education landscapes. By following these precise steps outlined in this guide, users can gain profound perspectives, fostering inclusive educational planning and access. The GIS data links provided at the end of the article enable users to replicate this process in various geographical contexts. For any queries, reach out to support@mapog.com. Explore MAPOG‘s innovative products for exciting possibilities in map analysis and educational planning.
GIS data links
Other Articles
- Protecting Wetlands: Guide to Create GIS Map for Nature
- GIS Analysis in Urban Planning: Reshaping Transportation Future Insights of state/city
- Fast Emergency Response: Using GIS and Isochrone Maps for 10-Minute Ambulance Arrival
- Mapping Tiger Attack Hotspots – Create an Online Map and Share
- Make Routes for Military Aerial Planning- Through Bearing angle and Distance calculation – Online Route Compass
- Mapping Healthcare Efficiency: GIS Buffer Analysis of Hospital Locations
- Add WMS- Two step online view of WMS layer on a map
- Plot ATM locations on a map and embed on your website
- Map habitat locations of endangered animals & keep track of their living
1 thought on “Create Map – School Map Area Coverage Through Buffer Analysis”